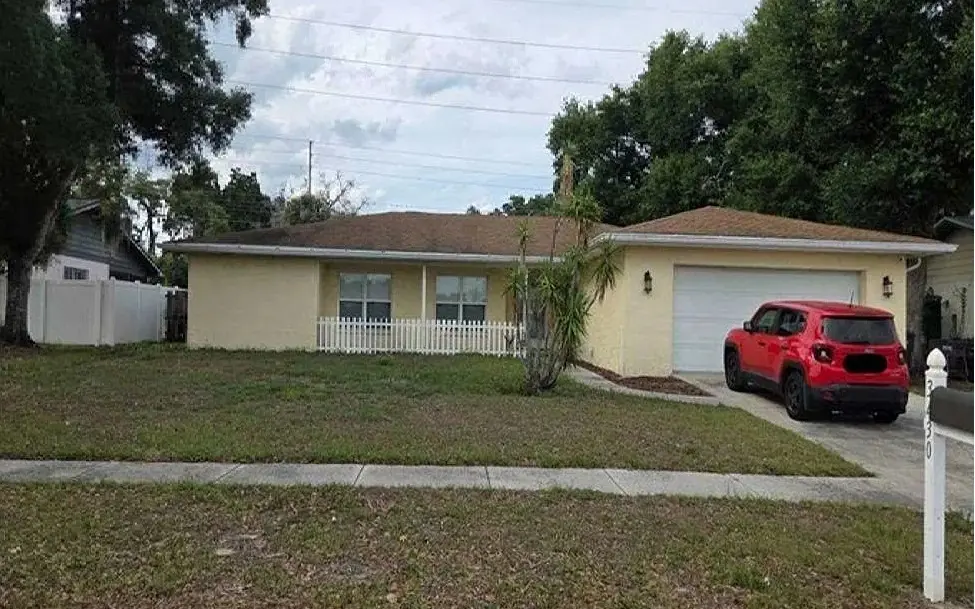
3430 Yale Cir · Riverview, FL
Flood risk 1/10 · Minimal
- FEMA flood zone
- X (unshaded)
- Chance of flooding over 30 yrs
- 0.0%
- Est. flood insurance / yr
- $507 – $1,088
Fire risk 1/10 · Minimal
- Est. fire insurance / yr
- $947 – $1,759
Heat risk 10/10 · Severe
- Hot days now (above 109°F)
- 7 days/yr
- Hot days in 30 yrs
- 27 days/yr
Wind risk 9/10 · Severe
- Chance of severe wind over 30 yrs
- 99.0%
Air-quality risk 4/10 · Minor
- Unhealthy air days now
- 4 days/yr
- Unhealthy air days in 30 yrs
- 5 days/yr
Risk factors via First Street. Map © Google.
Why this score? — see what drove the D+ grade
The composite is a weighted blend of 9 inputs, each scored 0–100. Each bar is that input's sub-score; the figure is the points it added to the 100-point composite (weight × sub-score).
- Cash flow +15.0/30.0
- ARV discount +7.5/15.0
- 1% rule +5.0/10.0
- DSCR +5.0/10.0
- Schools +4.2/10.0
- Livability +4.0/5.0
- Condition / age +2.5/5.0
- Rent growth +2.3/5.0
- Appreciation +0.0/10.0
$5,000
🖨 Deal sheet (PDF) 📄 Offer letter ✓ Due diligence
Listing remarks
Foreclosure Auction Ends June 29, 2026 at 10:00 AM EST. Explore this charming 3-bedroom, 2-bath residence set in a peaceful and well-located Riverview community. The list price is the opening bid for the online auction. Sold As-is. Explore more details and submit your bid through Federa.
Key facts
- 2 garage spots
- Listed 3 days
Property features AI
Exterior
- Parking: Attached or detached 2-car garage
- Home design: Residential property; One story
- Exterior features: Approximately 0.26-acre lot; Zoned RSC-4
Interior
- Bathrooms: Two full bathrooms
- Interior features: Single-story layout
Neighborhood map
What this means for you Summary
Snapshot
- This is a 3-bed/2.0-bath single-family listed at $5k.
Deal economics
- At list price, monthly cash flow is $2k ($22k/yr) — positive.
- The deal already cash-flows at list — no discount required.
- Meets the 1% rule at list price ($2k rent vs $5k).
Location & tenants
- Location reads 79/100 on livability (#134 in FL, #2,000 nationally) — a middle-class / working-renter tenant base. Strengths: housing A+, health & safety A+, employment B+; Watch: amenities F.
- Hillsborough (suburban): math 47% / reading 50% proficiency, ranked #41 of 73 in FL (top 56%) — families likely to look elsewhere, expect single-tenant / working-renter base with shorter leases.
- Zoned schools: Symmes Elementary School (math 55% / reading 57%, grade C+, #832 of 2,144 statewide, top 40%, 423 students, 49% FRL); Giunta Middle School (math 22% / reading 28%, grade F, #517 of 571 statewide, top 91%, 857 students, 74% FRL); Riverview High School (math 37% / reading 50%, grade F, #248 of 667 statewide, top 38%, 2,599 students, 46% FRL) — zoned schools at 56% FRL track the district average.
- Market conditions: Rents soft (-0.9%/yr); 572 active listings in the ZIP; 40 comparable units currently listed for rent nearby; rentals at typical pace (median 20d on market — plan ~3-4 weeks tenant-placement turnaround); solid renter incomes; 9,053 units permitted in Hillsborough County in 2024 (4,555 in 5+ unit buildings).
- This rent runs 33% of the median local income ($86k/yr) — at the standard rent-burdened threshold; future hikes will face affordability resistance.
Forward outlook
- Local home prices are declining (-3.0%/yr); year-one equity from $35 of loan paydown is wiped out by about $150 of value loss. Plan a longer hold.
- Hillsborough County population projected at +37% by 2050 — long-run rental-demand tailwind backs the buy-and-hold thesis.
- At projected returns (-3.0% appreciation + 0.0% rent growth), your $1k cash investment doubles in ~1 year — after that, you're playing with house money.
Negotiation context
- Only 3 days on market — expect competitive offers; lowballing is unlikely to land.
Risks & watch-outs
- Climate carrying-cost: severe wind risk, 99% chance of damaging wind over 30y; extreme-heat days projected 7→27/yr by 2055 (HVAC capex compounding) — expect insurance premiums to compound above CPI over the hold.
Questions for the listing agent
- Built in 1976 — when were the roof, HVAC, electrical panel, plumbing, and water heater last replaced?
- Is there a deadline driving the sale (1031 exchange, divorce, estate, relocation)? That informs how much negotiation room exists.
- Schools are B-rated — typically a magnet for longer-tenancy family renters. What's the average tenant stay here, and is there a school-zone premium baked into asking?
- The area grade is low — what's the realistic commute time and amenity access for the typical tenant pool here? Any planned neighborhood developments (good or bad) we should know about?
- What's the average days-on-market for RENTAL listings here right now (not sales)? A rising rental-DOM trend means longer vacancies and softer asking-rent achievability than the comps imply.
- What's the recent tenant-quality profile in this submarket — average credit score on applications, eviction rate, late-payment / NSF rate, and stable-employment percentage? A property-management company in the area should have these aggregated.
- How much new for-sale + rental construction is in the pipeline within 1–3 miles? Heavy new supply typically softens prices + rents 12–24 months out; constrained supply supports both.
Investment metrics
- 1% rule
- 47.50% ✓
- Cap rate
- 448.32%
- Cash-on-cash
- 1578.67%
- DSCR
- 71.24
- GRM
- 0.2
CMA / ARV
No comps found within radius.
Projected returns pro-forma
-3.0% appreciation · 0.0% rent growth · sell at horizon
- IRR
- —
- Equity multiple
- 79.26×
- Total profit
- $109,569
- Equity at exit
- $746
- IRR
- —
- Equity multiple
- 157.93×
- Total profit
- $219,705
- Equity at exit
- $432
Cash invested: $1,400 (down + closing). Projections, not guarantees.
Landlord ↔ Tenant lean methodology
- Overall (STATE)
- 87 Strongly Landlord-Friendly
- State Florida
- 87 Strongly Landlord-Friendly · R+3
- County
- — inherits STATE
- City
- — inherits STATE
ZIP-level market 33578
- Home prices YoY
- -12.9%
- Rents YoY
- -0.9%
- Active inventory
- 572
- Price-to-rent
- 0.2×
Monthly cashflow live
- Estimated rent
- $2,375 high interval (Pro) →
- Mortgage (P&I)
- −$26
- Tax est. 1.5%
- −$6 /mo · $75/yr
- Insurance
- −$2
- HOA
- −$0
- Vacancy / Maint / Mgmt
- −$499
- Net cashflow
- $1,842
Break-even live
Sensitivity live
| Price | -10% $1,845 | -5% $1,844 | +0% $1,842 | +5% $1,840 | +10% $1,838 |
|---|---|---|---|---|---|
| Rent | -10% $1,654 | -5% $1,748 | +0% $1,842 | +5% $1,936 | +10% $2,029 |
| Rate | -1.0pp $1,844 | -0.5pp $1,843 | base $1,842 | +0.5pp $1,840 | +1.0pp $1,839 |
UW: 25.0% down · 7.5% · 30yr · 1.5% tax · 5.0% vac · 8.0% maint · 8.0% mgmt
Financing live
Cash to close
- Down payment
- $1,250
- Closing costs
- $150
- Reserves months
- —
- Total cash needed
- —
Loan-product check · same deal, 3 products live
Conventional
25% down · 7.5% · 30yr
- Down + closing
- —
- Monthly P&I
- —
- Monthly cashflow
- —
- DSCR
- —
- Eligible?
- —
Personal DTI + credit; lowest rate.
DSCR
20% down · 8.5% · 30yr
- Down + closing
- —
- Monthly P&I
- —
- Monthly cashflow
- —
- DSCR
- —
- Eligible?
- —
No personal income docs; deal must DSCR.
Hard money
10% down · 12.0% · 12mo
- Down + closing
- —
- Monthly P&I
- —
- Monthly cashflow
- —
- DSCR
- —
- Eligible?
- —
Short-term bridge; refi at stabilization.
Rent comps 40 comps
| Address | Beds | Baths | Sqft | Rent | $/sqft | DOM | Units | Dist |
|---|---|---|---|---|---|---|---|---|
| 11112 Swansea St Riverview, FL | 2.0 | 2.0 | 1731 | $2,500 | $1.44 | 18d | 1 | 0.41mi |
| 5422 Watson Rd Riverview, FL | 4.0 | 2.0 | 2080 | $2,495 | $1.20 | 13d | 1 | 0.42mi |
| 1407 Trail Boss Ln Brandon, FL | 4.0 | 2.0 | 1857 | $2,395 | $1.29 | 19d | 1 | 0.45mi |
| 5403 Lindburg St Riverview, FL | 4.0 | 2.0 | 1830 | $2,300 | $1.26 | 26d | 1 | 0.56mi |
| 1024 Hallwood Loop Brandon, FL | 3.0 | 2.0 | 1466 | $2,245 | $1.53 | 1d | 1 | 0.58mi |
| 6523 Watson Rd Riverview, FL | 3.0 | 2.0 | 1937 | $2,950 | $1.52 | 21d | 1 | 0.59mi |
| 1407 Wakefield Dr Brandon, FL | 3.0 | 2.0 | 1728 | $2,200 | $1.27 | 23d | 1 | 0.68mi |
| 816 Centerwood Ct Brandon, FL | 3.0 | 2.0 | 1391 | $2,009 | $1.44 | 26d | 1 | 0.72mi |
| 856 Creekway Ct Brandon, FL | 3.0 | 2.0 | 1556 | $2,045 | $1.31 | 23d | 1 | 0.73mi |
| 2023 Green Juniper Ln Brandon, FL | 3.0 | 2.0 | 1306 | $2,125 | $1.63 | 19d | 1 | 0.75mi |
| 1305 Lakehurst Way Brandon, FL | 4.0 | 2.0 | 2221 | $2,550 | $1.15 | 5d | 1 | 0.88mi |
| 1904 Firethorn Ct Brandon, FL | 3.0 | 2.0 | 1773 | $2,095 | $1.18 | 23d | 1 | 0.90mi |
| 1904 Firethorn Ct Brandon, FL | 3.0 | 2.0 | 1773 | $2,095 | $1.18 | 18d | 1 | 0.90mi |
| 1010 Summer Breeze Dr Brandon, FL | 3.0 | 2.0 | 1545 | $2,250 | $1.46 | 1d | 1 | 0.98mi |
| 826 Milano Cir Brandon, FL | 1.0–3.0 | 1.0–2.0 | 1048 | $2,029 | $1.94 | 1d | 16 | 0.98mi |
| 3812 Pinedale St Brandon, FL | 4.0 | 2.0 | 1586 | $2,295 | $1.45 | 19d | 1 | 1.02mi |
| 5701 Summerall Vista Cir Riverview, FL | 1.0–3.0 | 1.0–2.0 | 1071 | $2,898 | $2.71 | 1d | 26 | 1.02mi |
| 609 Princeton St Brandon, FL | 4.0 | 2.0 | 1681 | $2,150 | $1.28 | 26d | 1 | 1.05mi |
| 6623 Summer Haven Dr Riverview, FL | 4.0 | 2.0 | 1337 | $2,300 | $1.72 | 25d | 1 | 1.08mi |
| 3818 Southview Dr Brandon, FL | 3.0 | 2.0 | 1373 | $2,245 | $1.64 | 26d | 1 | 1.08mi |
| 602 Pine Forest Dr Brandon, FL | 3.0 | 2.0 | 1450 | $2,595 | $1.79 | 26d | 1 | 1.10mi |
| 6637 Summer Haven Dr Riverview, FL | 4.0 | 2.0 | 1534 | $2,280 | $1.49 | 26d | 1 | 1.10mi |
| 924 Ridge Haven Dr Brandon, FL | 4.0 | 2.0 | 1956 | $2,700 | $1.38 | 6d | 1 | 1.12mi |
| 924 Ridge Haven Dr Brandon, FL | 4.0 | 2.0 | 1956 | $2,700 | $1.38 | 26d | 1 | 1.12mi |
| 6708 Summer Haven Dr Riverview, FL | 3.0 | 2.0 | 1330 | $2,080 | $1.56 | 0d | 1 | 1.12mi |
| 622 Breezeway Ct Brandon, FL | 4.0 | 2.5 | 1854 | $2,300 | $1.24 | 5d | 1 | 1.12mi |
| 6923 Summer Harbor Ln Riverview, FL | 3.0 | 2.0 | 1314 | $1,960 | $1.49 | 6d | 1 | 1.16mi |
| 6719 Summer Cove Dr Riverview, FL | 3.0 | 2.0 | 1298 | $2,240 | $1.73 | 6d | 1 | 1.18mi |
| 6713 Summer Cove Dr Riverview, FL | 3.0 | 2.0 | 1298 | $2,170 | $1.67 | 1d | 1 | 1.20mi |
| 10650 Mystic Seafloor Dr Riverview, FL | 1.0–3.0 | 1.0–2.0 | 1049 | $2,505 | $2.39 | 1d | 30 | 1.21mi |
| 2202 Cattleman Dr Brandon, FL | 3.0 | 2.0 | 1532 | $2,441 | $1.59 | 6d | 1 | 1.23mi |
| 1403 Scotch Pine Dr Brandon, FL | 3.0 | 2.0 | 1825 | $2,726 | $1.49 | 15d | 1 | 1.23mi |
| 1540 Chepacket St Brandon, FL | 3.0 | 2.0 | 1417 | $2,220 | $1.57 | 26d | 1 | 1.25mi |
| 10840 Johanna Ave Riverview, FL | 3.0 | 2.5 | 1477 | $1,950 | $1.32 | 26d | 1 | 1.32mi |
| 6339 Osprey Lake Cir Riverview, FL | 3.0 | 3.0 | 1412 | $2,000 | $1.42 | 26d | 1 | 1.32mi |
| 1434 Hatcher Loop Dr Brandon, FL | 4.0 | 2.0 | 1885 | $2,795 | $1.48 | 1d | 1 | 1.33mi |
| 10831 Johanna Ave Riverview, FL | 4.0 | 3.0 | 1708 | $2,200 | $1.29 | 16d | 1 | 1.35mi |
| 1413 Tiverton Dr Brandon, FL | 3.0 | 2.0 | 1303 | $2,200 | $1.69 | 19d | 1 | 1.36mi |
| 1505 Scotch Pine Dr Brandon, FL | 3.0 | 2.0 | 1660 | $2,295 | $1.38 | 17d | 1 | 1.36mi |
| 10854 Lake Saint Charles Blvd Riverview, FL | 3.0 | 2.5 | 1544 | $1,950 | $1.26 | 23d | 1 | 1.36mi |
Listing history 3 events
-
2026-06-21days on market $5,000 Active 3 DOM
-
2026-06-18remarks 288-char remark
-
2026-06-18$5,000 Active 1 DOM
ⓘ Source: listings_history table (triggers on properties + properties_extension) + one-shot
backfill from property_details.listing_events for pre-trigger history.
Climate risk First Street
- Flood 1/10 Low FEMA zone X (unshaded) · 0% chance over 30 yrs
- Wildfire 1/10 Low
- Heat 10/10 Extreme 7 d/yr ≥109°F today · 27 d/yr by 30 yrs out
- Wind 9/10 Extreme 99% chance of damaging wind over 30 yrs
- Air quality 4/10 Moderate 4 unhealthy d/yr today · 5 by 30 yrs out
Nearby sold comps map
Loading sold comps map…
Walkable amenities ~0.75 mi
Loading nearby amenities…
Taxation est. · year 1
- Rental income
- $28,501
- − Mortgage interest
- −$280
- − Property taxes
- −$75
- − Insurance
- −$25
- − Repairs & maintenance
- −$2,280
- − Management
- −$2,280
- − Depreciation
- −$145
- Taxable income
- $23,416
- Est. tax owed @ 24.0%
- −$5,620
- After-tax cash flow
- $16,482/yr
For passive investors: Depreciation is non-cash, so a rental often shows a tax loss while cash-flowing — sheltering income. Rental losses are passive: they offset passive income freely, and up to $25,000/yr can offset ordinary (W-2) income if you actively participate and your MAGI is under $100k (phasing out to $0 by $150k); unused losses carry forward. On sale, claimed depreciation is recaptured at up to 25%, and gains may owe capital-gains tax (a 1031 exchange can defer both). Figures are a year-1 estimate at your 24.0% rate — not tax advice; consult a CPA.
Schools (NCES district)
- District
- Hillsborough
- NCES district ID
- 1200870
- Math proficiency
- 47% ▼ -8.00%
- Reading proficiency
- 50% ▼ -4.00%
- Median HH income
- $50,622
- Composite
- 41.6/100
- National rank
- #3435
- State rank
- #41 of 73 in FL
Livability — Riverview
- Score
- 79/100
- State rank
- #134
- US rank
- #2000
Category grades
Schools grade is shown separately in the Schools card above.
Census & demographics
- Census place
- Riverview, FL
- County
- Hillsborough County · 1,540,968 people
- City population
- 137,988
- Metro
- Tampa-St. Petersburg-Clearwater, FL
- Population (ZIP)
- 60,651
- Household income
- $85,921
- Rent vs Own
- Severe rent burden
- 3063.0
Population outlook (Hillsborough County) Hauer SSP2
- Today (2025)
- 1,607,022 people
- By 2030
- 1,733,968 · +7.9%
- By 2040
- 1,979,565 · +23.2%
- By 2050
- 2,203,427 · +37.1%
- By 2075
- 2,667,893 · +66.0%
- By 2100
- 2,891,558 · +79.9%
Race, ethnicity, and origin ACS 2023
- Neighborhood character
- Diverse neighborhood (Simpson 0.69)
- Race & ethnicity
- White 43% Hispanic / Latino 26% Black 23% Two or more races 17% Asian 3%
- Hispanic origin (detail)
- Mexican 4% Puerto Rican 8% Cuban 3% Dominican 4%
- Common ancestry
- Romanian 3% Hispanic 3% Lithuanian 2%
- Foreign-born
- 14% · Canada, Jamaica, China
- Languages at home
- 73% English-only · Spanish 19% French/Haitian/Cajun 3% Other Indo-European 2%
Political lean MEDSL · Hillsborough
- 2024 margin
- Toss-up / Even · D 47.8% · R 50.9% · Other 1.3%
- 2008→2024 swing
- -10.2pp toward R · 2008: 7.1pp · 2024: -3.1pp
- All cycles
- 2024: R+3.1 2020: D+6.9 2016: D+6.8 2012: D+6.7 2008: D+7.1
Not yet ingested
- Civics
- —
Market trends
- HPI YoY
- ▼ -48.42%
- Current HPI
- 326.0368
- Rent YoY
- ▼ -0.95%
- Metro
- Tampa-St. Petersburg-Clearwater, FL
- State GDP YoY
- ▲ 3.28%
- F500 in state
- 36
Industry mix (Fortune 500 HQ in FL)
| Industry | F500 HQs | Revenue |
|---|---|---|
| Industrial Technology | 2 | $29B |
|
||
| Insurance | 2 | $17B |
|
||
| Retail | 1 | $60B |
|
||
| Technology Distribution | 1 | $58B |
|
||
| Homebuilding | 1 | $35B |
|
||
| Technology Manufacturing | 1 | $35B |
|
||
Price history
-92.9% since first listed6 events — show timeline
- 2026-06-18 Listed $5,000 NFMLS
- 2002-11-16 Sold (Public Records) $140,000 Public Records
- 1997-11-25 Sold (Public Records) $90,300 Public Records
- 1991-11-01 Sold (Public Records) $90,000 Public Records
- 1987-07-01 Sold (Public Records) $79,000 Public Records
- 1984-05-01 Sold (Public Records) $70,000 Public Records
Property tax history
+3.5%/yrLatest (2025): $2,005 · +9.2% YoY. Source: county tax records.
Cash-flow waterfall
monthlySold comps — $/sqft
last 12 mo · ≤1 miLoading sold comps…