 🏗️ New Construction
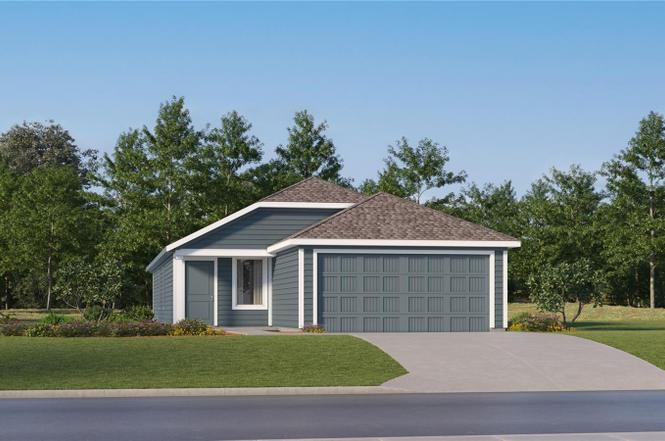
5626 Morant Bay Path · Poinciana, FL
Flood risk No data
- FEMA flood zone
- —
- Chance of flooding over 30 yrs
- —
- Est. flood insurance / yr
- —
Fire risk No data
- Est. fire insurance / yr
- —
Heat risk No data
- Hot days now (above threshold)
- —
- Hot days in 30 yrs
- —
Wind risk No data
- Chance of severe wind over 30 yrs
- —
Air-quality risk No data
- Unhealthy air days now
- —
- Unhealthy air days in 30 yrs
- —
Risk factors via First Street. Map © Google.
Why this score? — see what drove the F grade
The composite is a weighted blend of 9 inputs, each scored 0–100. Each bar is that input's sub-score; the figure is the points it added to the 100-point composite (weight × sub-score).
- Cash flow +7.6/30.0
- ARV discount +7.5/15.0
- Schools +3.6/10.0
- Livability +2.9/5.0
- Rent growth +2.7/5.0
- Condition / age +2.5/5.0
- 1% rule +2.4/10.0
- DSCR +1.7/10.0
- Appreciation +0.0/10.0
$325,540
🖨 Deal sheet (PDF) 📄 Offer letter ✓ Due diligence
Listing remarks
Under Construction. Introducing the new and exciting Sentosa! This elegant four-bedroom home provides convenient single-story living. An open-concept floorplan maximizes interior space and encourages seamless transitions between a modern kitchen, elegant dining room and comfortable family room. Three secondary bedrooms are tucked away to the side of the home, while a luxurious owner’s suite is nestled into a private rear corner, complete with a full bathroom and walk-in closet. Westview is a master-planned community in Poinciana, FL. This amenity-rich, pet-friendly community has something for residents of all ages to enjoy, including a swimming pool, dog park, clubhouse and sports fie
Key facts
- Single-story living
- Full bathroom
- Walk-in closet
Tags
Neighborhood map
What this means for you Summary
Snapshot
- This is a 4-bed/2.0-bath land listed at $326k.
Deal economics
- At list price, monthly cash flow is $-396 ($-5k/yr) — negative.
- To cash-flow at today's rent, offer at most $268k (17.6% below list).
- To meet the 1% rule (rent ≥ 1% of price), the offer needs to be $241k (26.0% below list).
- Recommended offer: $241k (26.0% below list) — sets the bar for 1% rule.
Location & tenants
- Location reads 57/100 on livability (#859 in FL) — a working-class tenant base; expect higher turnover. Strengths: cost of living A+, housing A+; Watch: employment D+, amenities F, commute F.
- Osceola (suburban): math 39% / reading 45% proficiency, ranked #60 of 73 in FL (top 82%) — families likely to look elsewhere, expect single-tenant / working-renter base with shorter leases; 60% free/reduced lunch — lower-income household profile, screen leases tightly.
- Zoned schools: Poinciana Academy of Fine Arts (math 18% / reading 34%, grade F, #2,015 of 2,144 statewide, top 94%, 632 students, 66% FRL); Discovery Intermediate School (math 25% / reading 30%, grade F, #495 of 571 statewide, top 87%, 898 students, 62% FRL); Liberty High School (math 15% / reading 25%, grade F, #554 of 667 statewide, top 84%, 1,613 students, 52% FRL) — zoned schools at 60% FRL track the district average.
- Zoned-school proficiency averages 24% at this address vs 42% district-wide (-18 pts) — the specific schools serving this property underperform the Osceola average; the district grade overstates school quality for this exact location.
- Market conditions: Rents flat; 612 active listings in the ZIP; 40 comparable units currently listed for rent nearby; rentals at typical pace (median 26d on market — plan ~3-4 weeks tenant-placement turnaround); 8,813 units permitted in Osceola County in 2024 (3,072 in 5+ unit buildings).
- This rent runs 44% of the median local income ($66k/yr) — at the standard rent-burdened threshold; future hikes will face affordability resistance.
Forward outlook
- Local home prices are declining (-3.0%/yr); year-one equity from $2k of loan paydown is wiped out by about $10k of value loss. Plan a longer hold.
- Osceola County population projected at +73% by 2050 — long-run rental-demand tailwind backs the buy-and-hold thesis.
Negotiation context
- It's been on market 113 days — a 9% lower offer ($296k) is reasonable based on typical stale-listing flexibility.
- 2 sale attempts; this cycle's ask has dropped $27k (8%) from the opening price — seller is motivated, your offer sets the floor, not the list.
Questions for the listing agent
- What do current leases actually rent for vs. the listed asking? Can we see a recent rent roll and the last 12 months of T-12 income?
- It's been on market 113 days. Have you received any prior offers? Is the seller open to a 26% concession, seller financing, or rate buy-down credit?
- What does the HOA fee cover, when was the last increase, and are there any pending special assessments or reserve-fund shortfalls?
- Why hasn't it sold? Are there any deal-killer items the seller is aware of (foundation, flood, title, zoning, code violations)?
- Is there a deadline driving the sale (1031 exchange, divorce, estate, relocation)? That informs how much negotiation room exists.
- Schools are F-rated, which usually means shorter tenancies and higher turnover. Who's the typical renter profile here, and what's been the actual vacancy rate?
- The area grade is low — what's the realistic commute time and amenity access for the typical tenant pool here? Any planned neighborhood developments (good or bad) we should know about?
- What's the average days-on-market for RENTAL listings here right now (not sales)? A rising rental-DOM trend means longer vacancies and softer asking-rent achievability than the comps imply.
- What's the recent tenant-quality profile in this submarket — average credit score on applications, eviction rate, late-payment / NSF rate, and stable-employment percentage? A property-management company in the area should have these aggregated.
- How much new for-sale + rental construction is in the pipeline within 1–3 miles? Heavy new supply typically softens prices + rents 12–24 months out; constrained supply supports both.
Investment metrics
- 1% rule
- 0.74% ✗
- Cap rate
- 4.83%
- Cash-on-cash
- -5.22%
- DSCR
- 0.77
- GRM
- 11.3
CMA / ARV
No comps found within radius.
Projected returns pro-forma
-3.0% appreciation · 0.82% rent growth · sell at horizon
- IRR
- -27.7%
- Equity multiple
- 0.09×
- Total profit
- $-83,092
- Equity at exit
- $48,539
- IRR
- -36.8%
- Equity multiple
- -0.37×
- Total profit
- $-124,894
- Equity at exit
- $28,147
Cash invested: $91,151 (down + closing). Projections, not guarantees.
Landlord ↔ Tenant lean methodology
- Overall (STATE)
- 87 Strongly Landlord-Friendly
- State Florida
- 87 Strongly Landlord-Friendly · R+3
- County
- — inherits STATE
- City
- — inherits STATE
ZIP-level market 34758
- Home prices YoY
- -14.3%
- Rents YoY
- 0.8%
- Active inventory
- 612
- Price-to-rent
- 11.3×
Monthly cashflow live
- Estimated rent
- $2,410 high interval (Pro) →
- Mortgage (P&I)
- −$1,707
- Tax est. 1.5%
- −$407 /mo · $4,883/yr
- Insurance
- −$136
- HOA
- −$50
- Vacancy / Maint / Mgmt
- −$506
- Net cashflow
- $-396
Break-even live
Sensitivity live
| Price | -10% $-171 | -5% $-284 | +0% $-396 | +5% $-509 | +10% $-621 |
|---|---|---|---|---|---|
| Rent | -10% $-587 | -5% $-491 | +0% $-396 | +5% $-301 | +10% $-206 |
| Rate | -1.0pp $-232 | -0.5pp $-313 | base $-396 | +0.5pp $-481 | +1.0pp $-566 |
UW: 25.0% down · 7.5% · 30yr · 1.5% tax · 5.0% vac · 8.0% maint · 8.0% mgmt
Financing live
Cash to close
- Down payment
- $81,385
- Closing costs
- $9,766
- Reserves months
- —
- Total cash needed
- —
Loan-product check · same deal, 3 products live
Conventional
25% down · 7.5% · 30yr
- Down + closing
- —
- Monthly P&I
- —
- Monthly cashflow
- —
- DSCR
- —
- Eligible?
- —
Personal DTI + credit; lowest rate.
DSCR
20% down · 8.5% · 30yr
- Down + closing
- —
- Monthly P&I
- —
- Monthly cashflow
- —
- DSCR
- —
- Eligible?
- —
No personal income docs; deal must DSCR.
Hard money
10% down · 12.0% · 12mo
- Down + closing
- —
- Monthly P&I
- —
- Monthly cashflow
- —
- DSCR
- —
- Eligible?
- —
Short-term bridge; refi at stabilization.
Rent comps 40 comps
| Address | Beds | Baths | Sqft | Rent | $/sqft | DOM | Units | Dist |
|---|---|---|---|---|---|---|---|---|
| 5603 Morant Bay Path Kissimmee, FL | 4.0 | 2.5 | 1910 | $2,350 | $1.23 | 9d | 1 | 0.02mi |
| 5620 Morant Bay Path Kissimmee, FL | 4.0 | 2.5 | 1910 | $2,350 | $1.23 | 25d | 1 | 0.02mi |
| 5602 Morant Bay Path Kissimmee, FL | 3.0 | 2.0 | 1424 | $2,250 | $1.58 | 9d | 1 | 0.03mi |
| 5626 Morant Bay Path Kissimmee, FL | 4.0 | 2.0 | 1600 | $2,295 | $1.43 | 9d | 1 | 0.03mi |
| 5524 Morant Bay Path Unit A Kissimmee, FL | 3.0 | 2.0 | 1825 | $2,200 | $1.21 | 25d | 1 | 0.03mi |
| 5639 Morant Bay Path Kissimmee, FL | 4.0 | 2.5 | 1910 | $2,500 | $1.31 | 25d | 1 | 0.04mi |
| 5548 Morant Bay Path Kissimmee, FL | 3.0 | 2.0 | 1825 | $2,200 | $1.21 | 25d | 1 | 0.11mi |
| 5548 Morant Bay Path Unit A Kissimmee, FL | 3.0 | 2.0 | 1825 | $2,200 | $1.21 | 0d | 1 | 0.12mi |
| 5530 Morant Bay Path Kissimmee, FL | 4.0 | 3.0 | 2175 | $2,550 | $1.17 | 25d | 1 | 0.14mi |
| 5525 Morant Bay Path Kissimmee, FL | 3.0 | 2.0 | 1825 | $2,200 | $1.21 | 25d | 1 | 0.15mi |
| 5513 Pimenta Ct Kissimmee, FL | 4.0 | 2.5 | 1910 | $2,350 | $1.23 | 16d | 1 | 0.26mi |
| 4269 Curacao Pl Kissimmee, FL | 3.0 | 2.0 | 1567 | $2,100 | $1.34 | 25d | 1 | 0.36mi |
| 4271 Curacao Pl Kissimmee, FL | 3.0 | 2.0 | 1567 | $2,200 | $1.40 | 25d | 1 | 0.36mi |
| 4251 Curacao Pl Kissimmee, FL | 3.0 | 2.0 | 1562 | $1,890 | $1.21 | 4d | 1 | 0.36mi |
| 4325 Curacao Pl Kissimmee, FL | 3.0 | 2.0 | 1562 | $2,000 | $1.28 | 25d | 1 | 0.37mi |
| 662 Brockton Dr Kissimmee, FL | 4.0 | 2.0 | 1632 | $1,920 | $1.18 | 3d | 1 | 0.44mi |
| 662 Brockton Dr Kissimmee, FL | 3.0 | 2.0 | 1632 | $1,920 | $1.18 | 25d | 1 | 0.44mi |
| 4505 Ochos Rios Pl Kissimmee, FL | 3.0 | 2.0 | 1872 | $2,100 | $1.12 | 25d | 1 | 0.50mi |
| 604 Basingstoke Ct Kissimmee, FL | 3.0 | 2.0 | 1739 | $1,945 | $1.12 | 25d | 1 | 0.54mi |
| 5665 Nispero Way Kissimmee, FL | 3.0 | 2.5 | 1856 | $2,350 | $1.27 | 25d | 1 | 0.77mi |
| 5640 Nispero Way Kissimmee, FL | 3.0 | 2.0 | 1603 | $2,190 | $1.37 | 25d | 1 | 0.79mi |
| 5652 Nispero Way Kissimmee, FL | 3.0 | 2.5 | 1853 | $2,390 | $1.29 | 25d | 1 | 0.79mi |
| 5750 Gingham Dr Kissimmee, FL | 4.0 | 2.0 | 1940 | $2,350 | $1.21 | 25d | 1 | 0.82mi |
| 5781 Gingham Dr Kissimmee, FL | 4.0 | 2.0 | 1936 | $2,390 | $1.23 | 25d | 1 | 0.84mi |
| 5625 Le Marin Way Kissimmee, FL | 3.0 | 2.0 | 2000 | $2,400 | $1.20 | 6d | 1 | 0.90mi |
| 4763 Guinep Ln Kissimmee, FL | 4.0 | 2.5 | 1879 | $2,300 | $1.22 | 16d | 1 | 0.90mi |
| 5456 Le Marin Way Poinciana, FL | 4.0 | 2.0 | 1845 | $2,000 | $1.08 | 25d | 1 | 0.91mi |
| 4799 Guinep Ln Kissimmee, FL | 3.0 | 2.0 | 1455 | $2,200 | $1.51 | 16d | 1 | 0.95mi |
| 4799 Guinep Ln Unit 4799 Kissimmee, FL | 3.0 | 2.0 | 1455 | $2,200 | $1.51 | 9d | 1 | 0.95mi |
| 102 Brixham Ct Unit A Poinciana, FL | 3.0 | 2.0 | 1304 | $1,800 | $1.38 | 25d | 1 | 0.97mi |
| 5803 Le Marin Way Kissimmee, FL | 3.0 | 2.0 | 1555 | $2,000 | $1.29 | 19d | 1 | 0.98mi |
| 5794 Le Marin Way Kissimmee, FL | 4.0 | 2.5 | 1881 | $2,400 | $1.28 | 25d | 1 | 1.00mi |
| 2511 Skyline Loop Kissimmee, FL | 3.0 | 2.5 | 1834 | $2,200 | $1.20 | 25d | 1 | 1.01mi |
| 2452 Skyline Loop Kissimmee, FL | 3.0 | 2.5 | 1840 | $1,900 | $1.03 | 25d | 1 | 1.02mi |
| 5822 Le Marin Way Kissimmee, FL | 3.0 | 2.0 | 1444 | $1,895 | $1.31 | 5d | 1 | 1.02mi |
| 2500 Skyline Loop Kissimmee, FL | 3.0 | 2.5 | 1689 | $1,990 | $1.18 | 25d | 1 | 1.03mi |
| 131 Barrington Dr Kissimmee, FL | 4.0 | 2.0 | 1670 | $2,250 | $1.35 | 25d | 1 | 1.04mi |
| 4814 Yellow Elder Way Kissimmee, FL | 4.0 | 3.0 | 2174 | $2,300 | $1.06 | 18d | 1 | 1.04mi |
| 122 Barrington Dr Kissimmee, FL | 3.0 | 2.0 | 1472 | $1,819 | $1.24 | 0d | 1 | 1.05mi |
| 2550 Skyline Loop Poinciana, FL | 3.0 | 3.0 | 1873 | $2,300 | $1.23 | 23d | 1 | 1.05mi |
HOA detail
- Monthly dues
- $50 · $600/yr
- Likely covers
- pool
Listing history 11 events
-
2026-04-13status Pending
-
2026-04-09price $325,540
-
2026-03-25price $345,540
-
2026-03-17price $339,540
-
2026-03-06price $334,540
-
2026-02-20status Active
-
2026-02-20price $346,540
-
2026-01-11status Pending
-
2026-01-06price $329,540
-
2025-12-16soldstatus $4,356,531
-
2025-11-11$352,540 Active
ⓘ Source: listings_history table (triggers on properties + properties_extension) + one-shot
backfill from property_details.listing_events for pre-trigger history.
Nearby sold comps map
Loading sold comps map…
Walkable amenities ~0.75 mi
Loading nearby amenities…
Taxation est. · year 1
- Rental income
- $28,914
- − Mortgage interest
- −$18,235
- − Property taxes
- −$4,883
- − Insurance
- −$1,628
- − Repairs & maintenance
- −$2,313
- − Management
- −$2,313
- − HOA
- −$600
- − Depreciation
- −$9,470
- Taxable loss
- −$10,528
- Est. tax savings @ 24.0%
- +$2,527
- After-tax cash flow
- $-2,228/yr
For passive investors: Depreciation is non-cash, so a rental often shows a tax loss while cash-flowing — sheltering income. Rental losses are passive: they offset passive income freely, and up to $25,000/yr can offset ordinary (W-2) income if you actively participate and your MAGI is under $100k (phasing out to $0 by $150k); unused losses carry forward. On sale, claimed depreciation is recaptured at up to 25%, and gains may owe capital-gains tax (a 1031 exchange can defer both). Figures are a year-1 estimate at your 24.0% rate — not tax advice; consult a CPA.
Schools (NCES district)
- District
- Osceola
- NCES district ID
- 1201470
- Math proficiency
- 39% ▼ -9.00%
- Reading proficiency
- 45% ▼ -4.00%
- Median HH income
- $45,528
- Composite
- 35.7/100
- National rank
- #4865
- State rank
- #60 of 73 in FL
Livability — Poinciana
- Score
- 57/100
- State rank
- #859
- US rank
- #21760
Category grades
Schools grade is shown separately in the Schools card above.
Census & demographics
- Census place
- Poinciana, FL
- County
- Osceola County · 410,217 people
- City population
- 91,336
- Metro
- Orlando-Kissimmee-Sanford, FL
- Population (ZIP)
- 46,768
- Household income
- $66,339
- Rent vs Own
- Severe rent burden
- 1302.0
Population outlook (Osceola County) Hauer SSP2
- Today (2025)
- 447,624 people
- By 2030
- 511,823 · +14.3%
- By 2040
- 642,986 · +43.6%
- By 2050
- 774,552 · +73.0%
- By 2075
- 1,078,144 · +140.9%
- By 2100
- 1,269,660 · +183.6%
Race, ethnicity, and origin ACS 2023
- Neighborhood character
- Diverse neighborhood (Simpson 0.58)
- Race & ethnicity
- Hispanic / Latino 60% Black 22% Two or more races 16% White 13% Asian 1%
- Hispanic origin (detail)
- Mexican 1% Puerto Rican 36% Cuban 3% Dominican 7%
- Common ancestry
- Hispanic 8% Romanian 1%
- Foreign-born
- 24% · Canada, Jamaica
- Languages at home
- 42% English-only · Spanish 48% French/Haitian/Cajun 7% Arabic 1%
Political lean MEDSL · Osceola
- 2024 margin
- Toss-up / Even · D 48.7% · R 50.2% · Other 1.1%
- 2008→2024 swing
- -21.2pp toward R · 2008: 19.7pp · 2024: -1.4pp
- All cycles
- 2024: R+1.4 2020: D+13.8 2016: D+25.0 2012: D+24.5 2008: D+19.7
Not yet ingested
- Civics
- —
Market trends
- HPI YoY
- ▼ -49.53%
- Current HPI
- 295.8928
- Rent YoY
- ▲ 0.82%
- Metro
- Orlando-Kissimmee-Sanford, FL
- State GDP YoY
- ▲ 3.28%
- F500 in state
- 36
Industry mix (Fortune 500 HQ in FL)
| Industry | F500 HQs | Revenue |
|---|---|---|
| Industrial Technology | 2 | $29B |
|
||
| Insurance | 2 | $17B |
|
||
| Retail | 1 | $60B |
|
||
| Technology Distribution | 1 | $58B |
|
||
| Homebuilding | 1 | $35B |
|
||
| Technology Manufacturing | 1 | $35B |
|
||
Price history
-7.7% since first listed11 events — show timeline
- 2026-04-13 Pending — Stellar MLS as Distributed by MLS Grid
- 2026-04-09 Price Changed $325,540 Stellar MLS as Distributed by MLS Grid
- 2026-03-25 Price Changed $345,540 Stellar MLS as Distributed by MLS Grid
- 2026-03-17 Price Changed $339,540 Stellar MLS as Distributed by MLS Grid
- 2026-03-06 Price Changed $334,540 Stellar MLS as Distributed by MLS Grid
- 2026-02-20 Relisted — Stellar MLS as Distributed by MLS Grid
- 2026-02-20 Price Changed $346,540 Stellar MLS as Distributed by MLS Grid
- 2026-01-11 Pending — Stellar MLS as Distributed by MLS Grid
- 2026-01-06 Price Changed $329,540 Stellar MLS as Distributed by MLS Grid
- 2025-12-16 Sold (Public Records) $4,356,531 Public Records
- 2025-11-11 Listed $352,540 Stellar MLS as Distributed by MLS Grid
Cash-flow waterfall
monthlySold comps — $/sqft
last 12 mo · ≤1 miLoading sold comps…