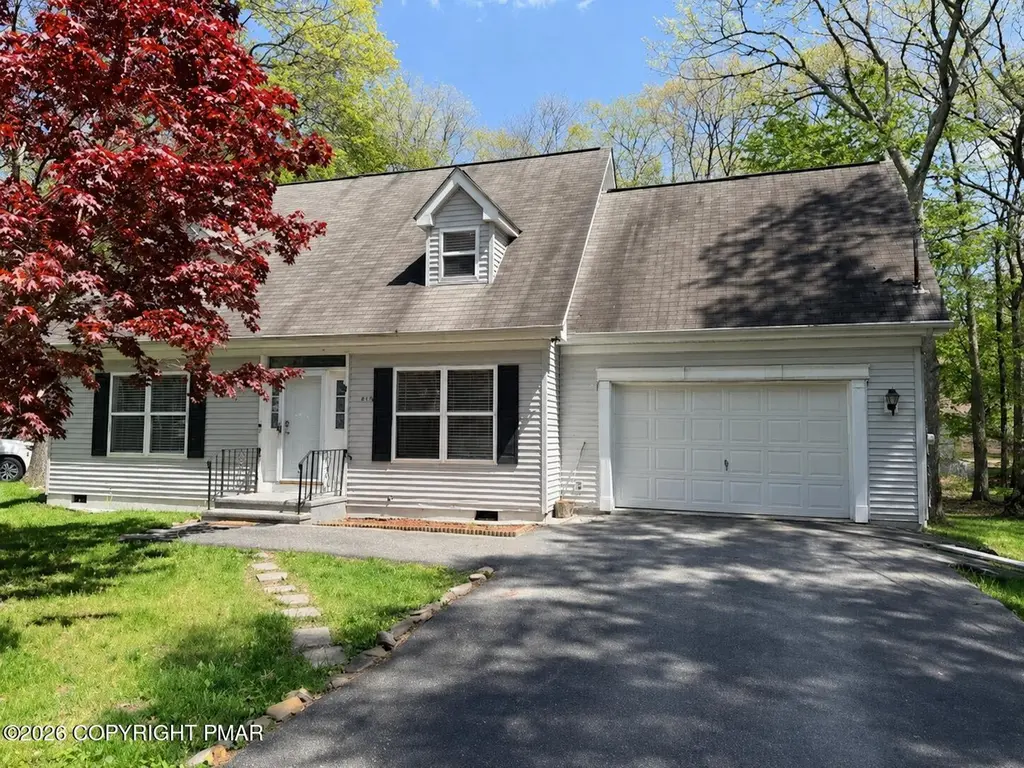
6121 Horatio Rd · Mount Pocono, PA
Flood risk 1/10 · Minimal
- FEMA flood zone
- X (unshaded)
- Chance of flooding over 30 yrs
- 0.0%
- Est. flood insurance / yr
- $507 – $1,088
Fire risk 5/10 · Moderate
- Est. fire insurance / yr
- $511 – $949
Heat risk 2/10 · Minimal
- Hot days now (above 90°F)
- 7 days/yr
- Hot days in 30 yrs
- 14 days/yr
Wind risk 4/10 · Minor
- Chance of severe wind over 30 yrs
- 7.0%
Air-quality risk 2/10 · Minimal
- Unhealthy air days now
- 1 days/yr
- Unhealthy air days in 30 yrs
- 2 days/yr
Risk factors via First Street. Map © Google.
Why this score? — see what drove the D+ grade
The composite is a weighted blend of 9 inputs, each scored 0–100. Each bar is that input's sub-score; the figure is the points it added to the 100-point composite (weight × sub-score).
- Cash flow +13.7/30.0
- Appreciation +6.2/10.0
- ARV discount +5.8/15.0
- DSCR +4.2/10.0
- Schools +4.0/10.0
- Livability +3.9/5.0
- 1% rule +3.5/10.0
- Rent growth +2.5/5.0
- Condition / age +2.5/5.0
$298,900
🖨 Deal sheet 📄 Offer letter ✓ Due diligence
Listing remarks
OPEN HOUSE Sat. June 20 12-3 PM! Special incenntives for attendees! Now is the perfect time to relocate to this bright and spacious, freshly painted Cape Cod featuring an open floor plan with 3 bedrooms and 2 full baths. The bonus room above the one-car garage offers the potential for a 4th bedroom, home office, or guest space. Enjoy outdoor entertaining on the large deck, plus extra storage with the convenient shed. Ideally located close to schools, shopping, and just minutes from Kalahari and Great Wolf resorts. Property is located in SHORT TERM RENTAL friendly community witha very LOW HOA fees. Schedule your private showing today! Some pictures were virtually staged. Seller will cons
Key facts
- Large deck
- Open floor plan
- Close to schools
Tags
Property features AI
Finance
- Other: Subdivision: Pocono Farms East
- HOA & community: Homeowners association with an annual fee of $155 (about $12.92/month); association reports no amenities
Exterior
- Parking: Attached garage with 2 spaces; Additional paved off-street parking for 4 vehicles; Driveway; garage faces front
- Utilities: Public water; Mound septic / septic tank; 200+ amp electric service
- Home design: Single-family residence; House with 2 stories; Primary entry on level 1; No common walls
- Construction: Asphalt shingle roof; Built as a house (structure type: house)
- Exterior features: Deck; Storm doors; Shed(s); Paved private-maintained road access; Lot approximately 0.29 acres (81 x 150)
Interior
- Kitchen: Oven; Electric range; Refrigerator; Dishwasher
- Bedrooms: Bedrooms on main and upper levels
- Flooring: Laminate flooring; Tile flooring
- Bathrooms: 2 full bathrooms
- Heating & cooling: Electric baseboard heating; Ceiling fans for cooling
- Interior features: Open floorplan; Ceiling fans; Blinds; Unfurnished
- Laundry & utility: Laundry on main level
Neighborhood map
What this means for you Summary
Snapshot
- This is a 3-bed/2.0-bath single-family listed at $299k.
Deal economics
- At list price, monthly cash flow is $24 ($284/yr) — positive.
- The deal already cash-flows at list — no discount required.
- To meet the 1% rule (rent ≥ 1% of price), the offer needs to be $254k (15.2% below list).
- Recommended offer: $254k (15.2% below list) — sets the bar for 1% rule.
- Cap rate 6.4% vs local median 5.1% in Mount Pocono — meaningfully above typical; check what's discounted (condition, days-on-market, listing class) to confirm the premium yield is real.
Location & tenants
- Location reads 77/100 on livability (#362 in PA, #3,166 nationally) — a middle-class / working-renter tenant base. Strengths: crime A+, cost of living A+, housing A+; Watch: schools F, commute F.
- Pocono Mountain SD (rural): math 37% / reading 55% proficiency, ranked #245 of 539 in PA (top 46%) — families likely to look elsewhere, expect single-tenant / working-renter base with shorter leases.
- Market conditions: 355 active listings in the ZIP; 5 comparable units currently listed for rent nearby; rentals lingering (median 44d on market — plan ~5-8 weeks vacancy on turnover, expect pricing pressure); 100% of comp listings sitting > 30 days — soft ceiling on asking rent; 278 units permitted in Monroe County in 2024 (52 in 5+ unit buildings).
Forward outlook
- In year one you build about $9k of equity ($2k loan paydown + $7k appreciation (2.4% local appreciation)).
- Monroe County population projected at -11% by 2050 — secular population decline; favor cash flow + early exit over multi-decade hold.
- At projected returns (2.4% appreciation + 3.0% rent growth), your $84k cash investment doubles in ~7 years — after that, you're playing with house money.
- By year 4, paydown + projected appreciation supports a ~$31k cash-out refi (75% LTV) — recoverable capital for the next deal without selling this one.
Negotiation context
- It's been on market 31 days — a 3% lower offer ($290k) is reasonable based on typical stale-listing flexibility.
- 5 sale attempts since 12y ago with the ask held roughly flat each time — persistent listings suggest the price (not the market) is what's stuck; bring a comps-based counter.
- Current owner paid $65k; list at $299k implies a 360% gain — meaningful room to come down on a strong offer.
Risks & watch-outs
- Climate carrying-cost: moderate wildfire risk — expect insurance premiums to compound above CPI over the hold.
Questions for the listing agent
- It's been on market 31 days. Have you received any prior offers? Is the seller open to a 15% concession, seller financing, or rate buy-down credit?
- What does the HOA fee cover, when was the last increase, and are there any pending special assessments or reserve-fund shortfalls?
- Is there a deadline driving the sale (1031 exchange, divorce, estate, relocation)? That informs how much negotiation room exists.
- Schools are F-rated, which usually means shorter tenancies and higher turnover. Who's the typical renter profile here, and what's been the actual vacancy rate?
- The area grade is low — what's the realistic commute time and amenity access for the typical tenant pool here? Any planned neighborhood developments (good or bad) we should know about?
- What's the average days-on-market for RENTAL listings here right now (not sales)? A rising rental-DOM trend means longer vacancies and softer asking-rent achievability than the comps imply.
- What's the recent tenant-quality profile in this submarket — average credit score on applications, eviction rate, late-payment / NSF rate, and stable-employment percentage? A property-management company in the area should have these aggregated.
- How much new for-sale + rental construction is in the pipeline within 1–3 miles? Heavy new supply typically softens prices + rents 12–24 months out; constrained supply supports both.
Investment metrics
- 1% rule
- 0.85% ✗
- Cap rate
- 6.39%
- Cash-on-cash
- 0.34%
- DSCR
- 1.02
- GRM
- 9.8
CMA / ARV
- ARV (on-the-fly)
- $287,760
- Comps found
- 12
Show comp detail 12 sales within ~0.75 mi
| Address | Dist | Beds/Ba | Sqft | Sold | Price | $/sf | Match |
|---|---|---|---|---|---|---|---|
| 322 Coach Rd | 0.24mi | 3/2.0 | 1,684 (+3%) | 2mo | $247,500 | $147 | 82 |
| 3217 Hamlet Dr | 0.09mi | 3/2.0 | 1,452 (-11%) | 3mo | $255,000 | $176 | 74 |
| 3109 Robert David Dr | 0.55mi | 3/2.0 | 1,576 (-4%) | 3mo | $285,000 | $181 | 66 |
| 8143 Mayfair Rd | 0.51mi | 3/2.0 | 1,584 (-3%) | 8mo | $330,000 | $208 | 64 |
| 431 Northampton Rd | 0.42mi | 4/1.5 (+1) | 1,744 (+7%) | 1mo | $265,000 | $152 | 62 |
| 1510 Belgravia Dr | 0.52mi | 3/2.0 | 1,712 (+5%) | 8mo | $285,000 | $166 | 61 |
| 135 Fergus Way | 0.72mi | 3/2.0 | 1,620 (-1%) | 7mo | $249,999 | $154 | 59 |
| 409 Northampton Rd | 0.35mi | 3/2.0 | 1,426 (-13%) | 4mo | $233,000 | $163 | 59 |
| 2150 Geraci Pl | 0.46mi | 3/2.0 | 1,468 (-10%) | 7mo | $293,000 | $200 | 56 |
| 4109 Devon Dr | 0.64mi | 4/3.0 (+1) | 1,615 (-1%) | 6mo | $300,000 | $186 | 55 |
| 1717 Gordon Ln | 0.63mi | 3/2.0 | 1,811 (+11%) | 5mo | $250,000 | $138 | 49 |
| 139 Fergus Way | 0.73mi | 3/2.5 | 1,456 (-11%) | 1mo | $285,000 | $196 | 44 |
Match score weights: distance 35% · size 25% · config 20% · recency 20%. Top-matched comps best support the ARV.
Projected returns pro-forma
2.36% appreciation · 3.0% rent growth · sell at horizon
- IRR
- 5.9%
- Equity multiple
- 1.33×
- Total profit
- $27,446
- Equity at exit
- $123,705
- IRR
- 9.2%
- Equity multiple
- 2.30×
- Total profit
- $108,459
- Equity at exit
- $182,714
Cash invested: $83,692 (down + closing). Projections, not guarantees.
Landlord ↔ Tenant lean methodology
- Overall (STATE)
- 62 Landlord-Friendly
- State Pennsylvania
- 62 Landlord-Friendly · EVEN
- County
- — inherits STATE
- City
- — inherits STATE
ZIP-level market 18466
- Home prices YoY
- 1.2%
- Active inventory
- 355
- Price-to-rent
- 9.8×
Monthly cashflow live
- Estimated rent
- $2,535 high interval (Pro) →
- Mortgage (P&I)
- −$1,567
- Tax from tax record
- −$274 /mo · $3,291/yr
- Insurance
- −$125
- HOA
- −$13
- Vacancy / Maint / Mgmt
- −$532
- Net cashflow
- $24
Break-even live
UW: 25.0% down · 7.5% · 30yr · 1.5% tax · 5.0% vac · 8.0% maint · 8.0% mgmt
Financing live
Cash to close
- Down payment
- $74,725
- Closing costs
- $8,967
- Reserves months
- —
- Total cash needed
- —
Loan-product check · same deal, 3 products live
Conventional
25% down · 7.5% · 30yr
- Down + closing
- —
- Monthly P&I
- —
- Monthly cashflow
- —
- DSCR
- —
- Eligible?
- —
Personal DTI + credit; lowest rate.
DSCR
20% down · 8.5% · 30yr
- Down + closing
- —
- Monthly P&I
- —
- Monthly cashflow
- —
- DSCR
- —
- Eligible?
- —
No personal income docs; deal must DSCR.
Hard money
10% down · 12.0% · 12mo
- Down + closing
- —
- Monthly P&I
- —
- Monthly cashflow
- —
- DSCR
- —
- Eligible?
- —
Short-term bridge; refi at stabilization.
Rent comps 5 comps
| Address | Beds | Baths | Sqft | Rent | $/sqft | DOM | Units | Dist |
|---|---|---|---|---|---|---|---|---|
| 3262 Hamlet Dr Coolbaugh Township, PA | 3.0 | 2.0 | 1200 | $3,000 | $2.50 | 43d | 1 | 0.25mi |
| 217 Coach Rd Tobyhanna, PA | 3.0 | 2.0 | 2081 | $2,200 | $1.06 | 43d | 1 | 0.37mi |
| 238 Dorset Rd Tobyhanna, PA | 3.0 | 2.5 | 2164 | $2,200 | $1.02 | 43d | 1 | 0.40mi |
| 3222 Evergreen Cir Unit B Tobyhanna, PA | 3.0 | 2.0 | 1300 | $1,950 | $1.50 | 44d | 1 | 0.85mi |
| 6385 Cherokee Trl Tobyhanna, PA | 3.0 | 3.0 | 2028 | $3,500 | $1.73 | 43d | 1 | 1.42mi |
HOA detail
- Monthly dues
- $13 · $156/yr
Listing history 22 events
-
2026-06-19days on market $298,900 Active 31 DOM
-
2026-06-18days on market $298,900 Active 30 DOM
-
2026-06-17days on market $298,900 Active 29 DOM
-
2026-06-16days on market $298,900 Active 28 DOM
-
2026-06-15days on market $298,900 Active 27 DOM
-
2026-06-14days on market $298,900 Active 25 DOM
-
2026-06-13pricedays on market $298,900 Active 24 DOM
-
2026-06-10days on market $299,900 Active 22 DOM
-
2026-06-09days on market $299,900 Active 21 DOM
-
2026-06-08days on market $299,900 Active 20 DOM
-
2026-06-07days on market $299,900 Active 19 DOM
-
2026-06-02days on market $299,900 Active 14 DOM
-
2026-06-01days on market $299,900 Active 13 DOM
-
2026-05-31days on market $299,900 Active 12 DOM
-
2026-05-30remarks 699-char remark
-
2026-05-30days on market $299,900 Active 11 DOM
-
2026-05-19$299,900 Active
-
2020-09-30$175,000
-
2019-10-10$145,000
-
2016-07-22soldstatus $65,000
-
2016-03-29$69,900
-
2014-06-18$114,900
ⓘ Source: listings_history table (triggers on properties + properties_extension) + one-shot
backfill from property_details.listing_events for pre-trigger history.
Tax reassessment forecast PA · Partial reset (capped growth)
- Current annual tax
- $3,291 · $274/mo
- Projected year-2 tax
- $4,007 · $334/mo
- Expected delta
- +$716/yr (+$60/mo · 21.8%)
ⓘ Screening estimate from a state-policy table — verify with the county assessor before closing.
Climate risk First Street
- Flood 1/10 Low FEMA zone X (unshaded) · 0% chance over 30 yrs
- Wildfire 5/10 Major
- Heat 2/10 Low 7 d/yr ≥90°F today · 14 d/yr by 30 yrs out
- Wind 4/10 Moderate 7% chance of damaging wind over 30 yrs
- Air quality 2/10 Low 1 unhealthy d/yr today · 2 by 30 yrs out
Nearby sold comps map
Loading sold comps map…
Walkable amenities ~0.75 mi
Loading nearby amenities…
Taxation est. · year 1
- Rental income
- $30,423
- − Mortgage interest
- −$16,743
- − Property taxes
- −$3,291
- − Insurance
- −$1,494
- − Repairs & maintenance
- −$2,434
- − Management
- −$2,434
- − HOA
- −$156
- − Depreciation
- −$8,695
- Taxable loss
- −$4,824
- Est. tax savings @ 24.0%
- +$1,158
- After-tax cash flow
- $1,441/yr
For passive investors: Depreciation is non-cash, so a rental often shows a tax loss while cash-flowing — sheltering income. Rental losses are passive: they offset passive income freely, and up to $25,000/yr can offset ordinary (W-2) income if you actively participate and your MAGI is under $100k (phasing out to $0 by $150k); unused losses carry forward. On sale, claimed depreciation is recaptured at up to 25%, and gains may owe capital-gains tax (a 1031 exchange can defer both). Figures are a year-1 estimate at your 24.0% rate — not tax advice; consult a CPA.
Schools (NCES district)
- District
- Pocono Mountain SD
- NCES district ID
- 4219500
- Math proficiency
- 37% ▼ -5.00%
- Reading proficiency
- 55% ▲ 1.00%
- Median HH income
- $55,317
- Composite
- 39.91/100
- National rank
- #3856
- State rank
- #245 of 539 in PA
Livability — Mount Pocono
- Score
- 77/100
- State rank
- #362
- US rank
- #3166
Category grades
Schools grade is shown separately in the Schools card above.
Census & demographics
- Population (ZIP)
- 17,997
Population outlook (Monroe County) Hauer SSP2
- Today (2025)
- 164,099 people
- By 2030
- 161,412 · -1.6%
- By 2040
- 154,616 · -5.8%
- By 2050
- 146,710 · -10.6%
- By 2075
- 140,830 · -14.2%
- By 2100
- 138,472 · -15.6%
Race, ethnicity, and origin ACS 2023
- Neighborhood character
- Highly diverse neighborhood (Simpson 0.72)
- Race & ethnicity
- White 38% Hispanic / Latino 27% Black 24% Two or more races 17% Asian 4%
- Hispanic origin (detail)
- Puerto Rican 12% Dominican 6%
- Common ancestry
- Romanian 2% Portuguese 1% German 1%
- Foreign-born
- 16% · Canada
- Languages at home
- 77% English-only · Spanish 17% Other Indo-European 2% Russian/Polish/Slavic 1%
Political lean MEDSL · Monroe
- 2024 margin
- Toss-up / Even · D 49.1% · R 49.9%
- 2008→2024 swing
- -17.1pp toward R · 2008: 16.3pp · 2024: -0.8pp
- All cycles
- 2024: R+0.8 2020: D+6.4 2016: D+0.3 2012: D+14.0 2008: D+16.3
Not yet ingested
- Civics
- —
Market trends
- HPI YoY
- ▲ 2.36%
- Current HPI
- 202.4134
- Rent YoY
- —
- Metro
- —
- State GDP YoY
- ▲ 1.68%
- F500 in state
- 34
Industry mix (Fortune 500 HQ in PA)
| Industry | F500 HQs | Revenue |
|---|---|---|
| Healthcare | 2 | $309B |
|
||
| Insurance | 2 | $27B |
|
||
| Telecommunications / Media | 1 | $124B |
|
||
| Industrial Distribution | 1 | $22B |
|
||
| Financial Services | 1 | $20B |
|
||
| Chemicals / Materials | 1 | $18B |
|
||
Price history
+161.0% since first listed6 events — show timeline
- 2026-05-19 Listed $299,900 PMAR
- 2020-09-30 Listed $175,000 PMAR
- 2019-10-10 Listed $145,000 PMAR
- 2016-07-22 Sold (MLS) $65,000 PMAR
- 2016-03-29 Listed $69,900 PMAR
- 2014-06-18 Listed $114,900 PMAR
Property tax history
-0.6%/yrLatest (2026): $3,291 · +3.2% YoY. Source: county tax records.
Cash-flow waterfall
monthlySold comps — $/sqft
last 12 mo · ≤1 miLoading sold comps…