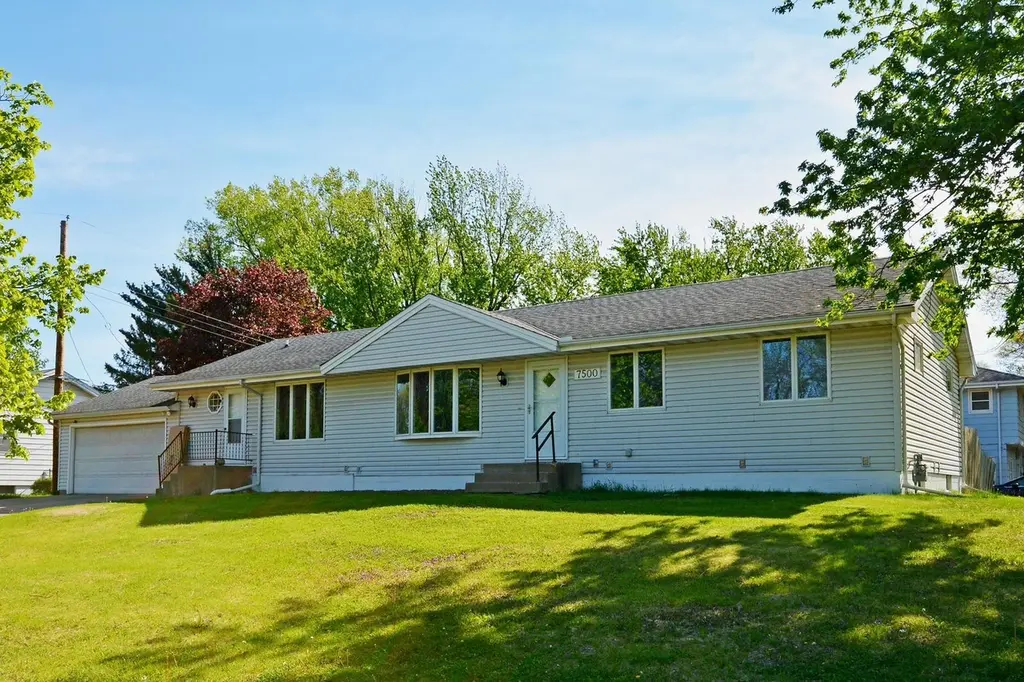
7500 Janell Ave N · Brooklyn Park, MN
Flood risk 1/10 · Minimal
- FEMA flood zone
- X (unshaded)
- Chance of flooding over 30 yrs
- 0.0%
- Est. flood insurance / yr
- $473 – $860
Fire risk 1/10 · Minimal
- Est. fire insurance / yr
- $888 – $1,650
Heat risk 2/10 · Minimal
- Hot days now (above 99°F)
- 7 days/yr
- Hot days in 30 yrs
- 14 days/yr
Wind risk 2/10 · Minimal
- Chance of severe wind over 30 yrs
- —
Air-quality risk 2/10 · Minimal
- Unhealthy air days now
- 1 days/yr
- Unhealthy air days in 30 yrs
- 2 days/yr
Risk factors via First Street. Map © Google.
Why this score? — see what drove the D- grade
The composite is a weighted blend of 9 inputs, each scored 0–100. Each bar is that input's sub-score; the figure is the points it added to the 100-point composite (weight × sub-score).
- Cash flow +9.7/30.0
- ARV discount +7.8/15.0
- Schools +4.2/10.0
- Livability +4.0/5.0
- Rent growth +3.1/5.0
- 1% rule +2.7/10.0
- DSCR +2.7/10.0
- Condition / age +2.5/5.0
- Appreciation +0.0/10.0
$359,999
🖨 Deal sheet 📄 Offer letter ✓ Due diligence
Listing remarks MLS
Move-in ready! Spacious one story w/over 3000 FSF! Cherry cabinetry & hg built-in pantry in Kit. 2 Fam Rms plus Rec Rm. Great Sunroom! Master Ste w/his and her closets. LL workshop/storage area. Private fenced-in bkyd w/hg patio plus shed. See pics!
Key facts
- Fresh paint
- New flooring
- Updated countertops
Tags
Property features AI
Finance
- Other: Lot approximately 0.27 acres (dimensions 90 x 129 x 90 x 129)
Exterior
- Parking: Attached 2-car garage
- Utilities: City water; City sewer; Natural gas
- Home design: Residential property; One level (with lower level/basement); Corner lot
- Construction: Block foundation
- Exterior features: Metal and vinyl exterior
Interior
- Kitchen: Kitchen on main level
- Bedrooms: 5 bedrooms (including bedrooms on main and lower levels)
- Bathrooms: 2 full bathrooms
- Heating & cooling: Forced air heating; Central air conditioning
- Interior features: Finished basement; Dining room; Family room; Living room; Sun room; Recreation room; Patio
- Laundry & utility: Lower-level laundry room
Neighborhood map
What this means for you Summary
Snapshot
- This is a 5-bed/2.0-bath single-family listed at $360k.
Deal economics
- At list price, monthly cash flow is $-236 ($-3k/yr) — negative.
- To cash-flow at today's rent, offer at most $318k (11.6% below list).
- To meet the 1% rule (rent ≥ 1% of price), the offer needs to be $276k (23.3% below list).
- Recommended offer: $276k (23.3% below list) — sets the bar for 1% rule.
- Cap rate 5.5% vs local median 3.3% in Brooklyn Park — top-decile yield for the area; either an underpriced asset or a hidden risk that comps aren't pricing in. Stress-test before assuming the spread holds.
Location & tenants
- Location reads 81/100 on livability (#50 in MN, #1,308 nationally) — a professional / high-income tenant draw. Strengths: commute A+, employment A+, housing A+; Watch: crime C-, schools D, amenities F.
- Osseo Public School District (suburban): math 42% / reading 51% proficiency, ranked #129 of 301 in MN (top 43%) — families likely to look elsewhere, expect single-tenant / working-renter base with shorter leases.
- Market conditions: Rents rising (+2.5%/yr); 109 active listings in the ZIP; 3 comparable units currently listed for rent nearby; rentals at typical pace (median 20d on market — plan ~3-4 weeks tenant-placement turnaround); 4,651 units permitted in Hennepin County in 2024 (2,443 in 5+ unit buildings).
- This rent runs 44% of the median local income ($75k/yr) — at the standard rent-burdened threshold; future hikes will face affordability resistance.
Forward outlook
- Local home prices are declining (-3.0%/yr); year-one equity from $2k of loan paydown is wiped out by about $11k of value loss. Plan a longer hold.
- Hennepin County population projected at +30% by 2050 — long-run rental-demand tailwind backs the buy-and-hold thesis.
Negotiation context
- Only 11 days on market — expect competitive offers; lowballing is unlikely to land.
- 6 sale attempts since 33y ago with the ask held roughly flat each time — persistent listings suggest the price (not the market) is what's stuck; bring a comps-based counter.
- Current owner paid $155k; list at $360k implies a 132% gain — meaningful room to come down on a strong offer.
Questions for the listing agent
- What do current leases actually rent for vs. the listed asking? Can we see a recent rent roll and the last 12 months of T-12 income?
- Built in 1969 — when were the roof, HVAC, electrical panel, plumbing, and water heater last replaced?
- Is there a deadline driving the sale (1031 exchange, divorce, estate, relocation)? That informs how much negotiation room exists.
- Schools are D-rated, which usually means shorter tenancies and higher turnover. Who's the typical renter profile here, and what's been the actual vacancy rate?
- The area grade is low — what's the realistic commute time and amenity access for the typical tenant pool here? Any planned neighborhood developments (good or bad) we should know about?
- What's the average days-on-market for RENTAL listings here right now (not sales)? A rising rental-DOM trend means longer vacancies and softer asking-rent achievability than the comps imply.
- What's the recent tenant-quality profile in this submarket — average credit score on applications, eviction rate, late-payment / NSF rate, and stable-employment percentage? A property-management company in the area should have these aggregated.
- How much new for-sale + rental construction is in the pipeline within 1–3 miles? Heavy new supply typically softens prices + rents 12–24 months out; constrained supply supports both.
Investment metrics
- 1% rule
- 0.77% ✗
- Cap rate
- 5.51%
- Cash-on-cash
- -2.81%
- DSCR
- 0.87
- GRM
- 10.9
CMA / ARV
- ARV (median comp)
- $362,708
- List price
- $359,999
- Delta
- -0.75%
- Verdict
- FAIR
- Comps
- 4 within 2.0 mi
Projected returns pro-forma
-3.0% appreciation · 2.52% rent growth · sell at horizon
- IRR
- -21.5%
- Equity multiple
- 0.26×
- Total profit
- $-74,697
- Equity at exit
- $53,677
- IRR
- -16.3%
- Equity multiple
- 0.11×
- Total profit
- $-89,802
- Equity at exit
- $31,126
Cash invested: $100,800 (down + closing). Projections, not guarantees.
Landlord ↔ Tenant lean methodology
- Overall (STATE)
- 46 Balanced
- State Minnesota
- 46 Balanced · D+2
- County
- — inherits STATE
- City
- — inherits STATE
ZIP-level market 55428
- Rents YoY
- 2.5%
- Active inventory
- 109
- Price-to-rent
- 10.9×
Monthly cashflow live
- Estimated rent
- $2,760 medium interval (Pro) →
- Mortgage (P&I)
- −$1,888
- Tax from tax record
- −$378 /mo · $4,541/yr
- Insurance
- −$150
- HOA
- −$0
- Vacancy / Maint / Mgmt
- −$580
- Net cashflow
- $-236
Break-even live
UW: 25.0% down · 7.5% · 30yr · 1.5% tax · 5.0% vac · 8.0% maint · 8.0% mgmt
Financing live
Cash to close
- Down payment
- $90,000
- Closing costs
- $10,800
- Reserves months
- —
- Total cash needed
- —
Loan-product check · same deal, 3 products live
Conventional
25% down · 7.5% · 30yr
- Down + closing
- —
- Monthly P&I
- —
- Monthly cashflow
- —
- DSCR
- —
- Eligible?
- —
Personal DTI + credit; lowest rate.
DSCR
20% down · 8.5% · 30yr
- Down + closing
- —
- Monthly P&I
- —
- Monthly cashflow
- —
- DSCR
- —
- Eligible?
- —
No personal income docs; deal must DSCR.
Hard money
10% down · 12.0% · 12mo
- Down + closing
- —
- Monthly P&I
- —
- Monthly cashflow
- —
- DSCR
- —
- Eligible?
- —
Short-term bridge; refi at stabilization.
Rent comps 3 comps
| Address | Beds | Baths | Sqft | Rent | $/sqft | DOM | Units | Dist |
|---|---|---|---|---|---|---|---|---|
| 6200 74th Ave N Minneapolis, MN | 5.0 | 3.0 | 2162 | $3,109 | $1.44 | 1d | 1 | 0.47mi |
| 8007 Colorado Ave N Brooklyn Park, MN | 4.0 | 2.0 | 2124 | $1,500 | $0.71 | 20d | 1 | 0.78mi |
| 8233 Douglas Ln N Minneapolis, MN | 5.0 | 2.0 | 1834 | $4,145 | $2.26 | 24d | 1 | 1.02mi |
Listing history 15 events
-
2026-05-14$359,999 Active 217-char remark
-
2012-06-05soldstatus $154,900
-
2012-05-30soldstatus $154,900 253-char remark
Show marketing remark (253 chars)
Move-in ready! Spacious one story w/over 3000 FSF! Cherry cabinetry & hg built-in pantry in Kit. 2 Fam Rms plus Rec Rm. Great Sunroom! Master Ste w/his and her closets. LL workshop/storage area. Private fenced-in bkyd w/hg patio plus shed. See pics!
-
2012-04-24historical 253-char remark
Show marketing remark (253 chars)
Move-in ready! Spacious one story w/over 3000 FSF! Cherry cabinetry & hg built-in pantry in Kit. 2 Fam Rms plus Rec Rm. Great Sunroom! Master Ste w/his and her closets. LL workshop/storage area. Private fenced-in bkyd w/hg patio plus shed. See pics!
-
2012-04-10$154,900 253-char remark
Show marketing remark (253 chars)
Move-in ready! Spacious one story w/over 3000 FSF! Cherry cabinetry & hg built-in pantry in Kit. 2 Fam Rms plus Rec Rm. Great Sunroom! Master Ste w/his and her closets. LL workshop/storage area. Private fenced-in bkyd w/hg patio plus shed. See pics!
-
2007-11-11historical
-
2007-07-31$247,000
-
2007-07-29historical
-
2007-05-12$248,500
-
1994-01-26soldstatus $92,000
-
1993-12-17soldstatus $92,000
-
1993-12-14historical
-
1993-10-11$94,900
-
1993-08-02historical
-
1993-06-28$104,900
ⓘ Source: listings_history table (triggers on properties + properties_extension) + one-shot
backfill from property_details.listing_events for pre-trigger history.
Tax reassessment forecast MN · Partial reset (capped growth)
- Current annual tax
- $4,541 · $378/mo
- Projected year-2 tax
- $4,541 · $378/mo
- Expected delta
- $0/yr ($0/mo · 0.0%)
ⓘ Screening estimate from a state-policy table — verify with the county assessor before closing.
Climate risk First Street
- Flood 1/10 Low FEMA zone X (unshaded) · 0% chance over 30 yrs
- Wildfire 1/10 Low
- Heat 2/10 Low 7 d/yr ≥99°F today · 14 d/yr by 30 yrs out
- Wind 2/10 Low
- Air quality 2/10 Low 1 unhealthy d/yr today · 2 by 30 yrs out
Nearby sold comps map
Loading sold comps map…
Walkable amenities ~0.75 mi
Loading nearby amenities…
Taxation est. · year 1
- Rental income
- $33,118
- − Mortgage interest
- −$20,166
- − Property taxes
- −$4,541
- − Insurance
- −$1,800
- − Repairs & maintenance
- −$2,649
- − Management
- −$2,649
- − Depreciation
- −$10,473
- Taxable loss
- −$9,160
- Est. tax savings @ 24.0%
- +$2,198
- After-tax cash flow
- $-634/yr
For passive investors: Depreciation is non-cash, so a rental often shows a tax loss while cash-flowing — sheltering income. Rental losses are passive: they offset passive income freely, and up to $25,000/yr can offset ordinary (W-2) income if you actively participate and your MAGI is under $100k (phasing out to $0 by $150k); unused losses carry forward. On sale, claimed depreciation is recaptured at up to 25%, and gains may owe capital-gains tax (a 1031 exchange can defer both). Figures are a year-1 estimate at your 24.0% rate — not tax advice; consult a CPA.
Schools (NCES district)
- District
- Osseo Public School District
- NCES district ID
- 2725200
- Math proficiency
- 42% ▼ -7.00%
- Reading proficiency
- 51% ▼ -4.00%
- Median HH income
- $76,168
- Composite
- 42.35/100
- National rank
- #3250
- State rank
- #129 of 301 in MN
Livability — Brooklyn Park
- Score
- 81/100
- State rank
- #50
- US rank
- #1308
Category grades
Schools grade is shown separately in the Schools card above.
Census & demographics
- Census place
- Brooklyn Park, MN
- County
- Hennepin County · 1,150,272 people
- City population
- 33,660
- Metro
- Minneapolis-St. Paul-Bloomington, MN-WI
- Population (ZIP)
- 32,499
- Household income
- $74,860
- Rent vs Own
- Severe rent burden
- 1939.0
Population outlook (Hennepin County) Hauer SSP2
- Today (2025)
- 1,405,227 people
- By 2030
- 1,492,650 · +6.2%
- By 2040
- 1,660,157 · +18.1%
- By 2050
- 1,823,498 · +29.8%
- By 2075
- 2,221,283 · +58.1%
- By 2100
- 2,509,976 · +78.6%
Race, ethnicity, and origin ACS 2023
- Neighborhood character
- Diverse neighborhood (Simpson 0.65)
- Race & ethnicity
- White 49% Black 30% Hispanic / Latino 8% Asian 7% Two or more races 7%
- Hispanic origin (detail)
- Mexican 5%
- Common ancestry
- Swiss 8% Portuguese 6% Romanian 2%
- Foreign-born
- 20% · Canada
- Languages at home
- 80% English-only · Spanish 6% Other Asian/Pacific 5% French/Haitian/Cajun 1%
Political lean MEDSL · Hennepin
- 2024 margin
- Solid D (+42.6) · D 70.2% · R 27.5% · Other 2.3%
- 2008→2024 swing
- +14.0pp toward D · 2008: 28.6pp · 2024: 42.6pp
- All cycles
- 2024: D+42.6 2020: D+43.2 2016: D+35.3 2012: D+27.1 2008: D+28.6
Not yet ingested
- Civics
- —
Market trends
- HPI YoY
- ▼ -276.37%
- Current HPI
- 239.4693
- Rent YoY
- ▲ 2.52%
- Metro
- Minneapolis-St. Paul-Bloomington, MN-WI
- State GDP YoY
- ▲ 2.41%
- F500 in state
- 34
Industry mix (Fortune 500 HQ in MN)
| Industry | F500 HQs | Revenue |
|---|---|---|
| Healthcare | 2 | $407B |
|
||
| Retail | 2 | $150B |
|
||
| Consumer Goods | 2 | $32B |
|
||
| Industrial Machinery | 2 | $6B |
|
||
| Agriculture | 1 | $40B |
|
||
| Healthcare / Medical Devices | 1 | $32B |
|
||
Price history
+243.2% since first listed16 events — show timeline
- 2026-05-26 Pending — NORTHSTARMLS as Distributed by MLS Grid
- 2026-05-14 Listed $359,999 NORTHSTARMLS as Distributed by MLS Grid
- 2012-06-05 Sold (Public Records) $154,900 Public Records
- 2012-05-30 Sold (MLS) $154,900 NORTHSTARMLS as Distributed by MLS Grid
- 2012-04-24 Listing Removed — NORTHSTARMLS as Distributed by MLS Grid
- 2012-04-10 Listed $154,900 NORTHSTARMLS as Distributed by MLS Grid
- 2007-11-11 Listing Removed — NORTHSTARMLS as Distributed by MLS Grid
- 2007-07-31 Listed $247,000 NORTHSTARMLS as Distributed by MLS Grid
- 2007-07-29 Listing Removed — NORTHSTARMLS as Distributed by MLS Grid
- 2007-05-12 Listed $248,500 NORTHSTARMLS as Distributed by MLS Grid
- 1994-01-26 Sold (Public Records) $92,000 Public Records
- 1993-12-17 Sold (MLS) $92,000 NORTHSTARMLS as Distributed by MLS Grid
- 1993-12-14 Listing Removed — NORTHSTARMLS as Distributed by MLS Grid
- 1993-10-11 Listed $94,900 NORTHSTARMLS as Distributed by MLS Grid
- 1993-08-02 Listing Removed — NORTHSTARMLS as Distributed by MLS Grid
- 1993-06-28 Listed $104,900 NORTHSTARMLS as Distributed by MLS Grid
Property tax history
+5.0%/yrLatest (2025): $4,541 · +5.2% YoY. Source: county tax records.
Cash-flow waterfall
monthlySold comps — $/sqft
last 12 mo · ≤1 miLoading sold comps…