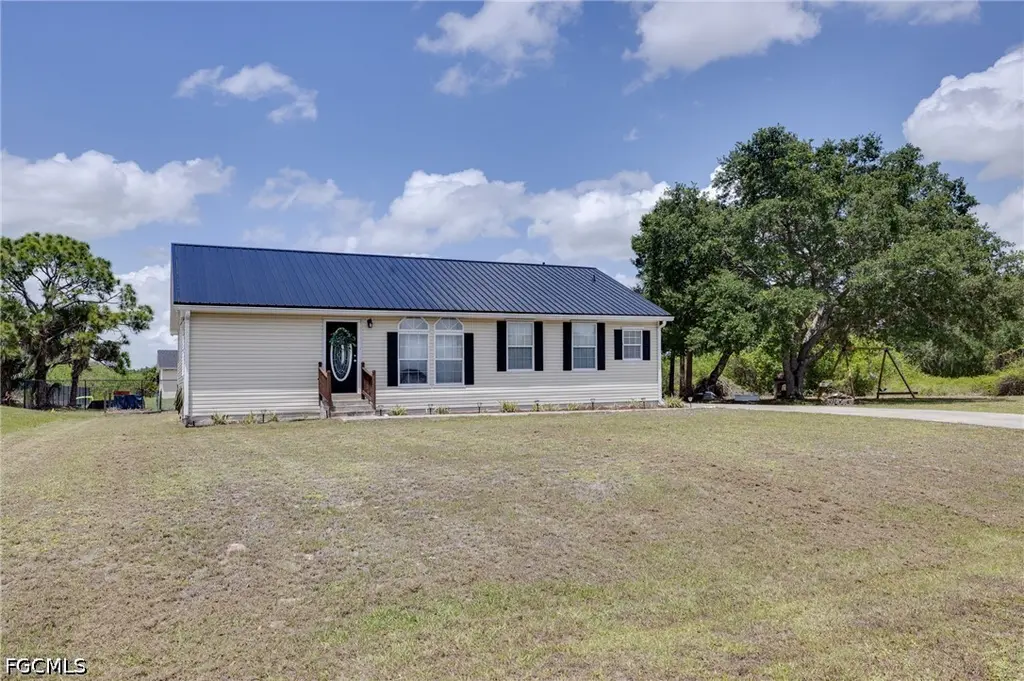
2040 S Montana Cir · Port LaBelle, FL
Flood risk 4/10 · Minor
- FEMA flood zone
- X (unshaded)
- Chance of flooding over 30 yrs
- 0.22%
- Est. flood insurance / yr
- $507 – $1,088
Fire risk 3/10 · Minor
- Est. fire insurance / yr
- $947 – $1,759
Heat risk 9/10 · Severe
- Hot days now (above 108°F)
- 7 days/yr
- Hot days in 30 yrs
- 26 days/yr
Wind risk 10/10 · Severe
- Chance of severe wind over 30 yrs
- 99.0%
Air-quality risk 2/10 · Minimal
- Unhealthy air days now
- 0 days/yr
- Unhealthy air days in 30 yrs
- 1 days/yr
Risk factors via First Street. Map © Google.
Why this score? — see what drove the B- grade
The composite is a weighted blend of 9 inputs, each scored 0–100. Each bar is that input's sub-score; the figure is the points it added to the 100-point composite (weight × sub-score).
- Cash flow +20.8/30.0
- ARV discount +15.0/15.0
- Appreciation +10.0/10.0
- DSCR +6.6/10.0
- 1% rule +5.4/10.0
- Schools +3.1/10.0
- Livability +3.1/5.0
- Rent growth +2.5/5.0
- Condition / age +2.5/5.0
$219,000
🖨 Deal sheet (PDF) 📄 Offer letter ✓ Due diligence
Listing remarks MLS
Bright 3 Bedroom 2 Bathroom home in Labelle. Family Room features Vaulted Ceilings and Pretty Arched Windows. Kitchen has Microwave, Dishwasher and Eat In Kitchen Area. Inside Laundry Room next to Kitchen with Washer and Dryer Hookup. Master Bedroom features Closet With Built In Shelving, and Great Master Bathroom with Dual Sinks, Garden Tub and Separate Stand In Shower with Sliding Doors! Guest Bathroom has Tub and Shower Combination. Large Backyard with Trees! Nice rural location in LaBelle. Don't miss out, schedule your showing for this Lovely Home today!
Key facts
- Bright kitchen
- Large backyard
- Large ensuite bath
Tags
Property features AI
Finance
- Financial info: Pets allowed
- HOA & community: No association fee
Exterior
- Security: Smoke detectors
- Utilities: Public water; Septic tank; Cable available
- Home design: Manufactured home; Single-story; Entry level: 1; Faces southwest; Resale property
- Construction: Vinyl siding; Metal roof
- Exterior features: Outbuilding; Manual shutters; Rectangular lot; Paved road access; Lot exposures to the northeast
Interior
- Kitchen: Dishwasher; Freezer; Microwave; Range; Refrigerator
- Bedrooms: Includes a workshop (listed among room types)
- Bathrooms: 2 full bathrooms
- Interior features: Bathtub; Separate shower; Tub/shower combination; Living/dining room; Window treatments; Single-hung windows; Shutters; Unfurnished; Workshop
- Laundry & utility: Washer hookup inside; Dryer hookup inside
Neighborhood map
What this means for you Summary
Snapshot
- This is a 3-bed/2.0-bath single-family listed at $219k.
Deal economics
- At list price, monthly cash flow is $300 ($4k/yr) — positive.
- The deal already cash-flows at list — no discount required.
- Meets the 1% rule at list price ($2k rent vs $219k).
- Cap rate 7.9% vs local median 5.1% in Port LaBelle — top-decile yield for the area; either an underpriced asset or a hidden risk that comps aren't pricing in. Stress-test before assuming the spread holds.
Location & tenants
- Location reads 62/100 on livability (#750 in FL) — a middle-class / working-renter tenant base. Strengths: cost of living A+, housing A+; Watch: amenities F, commute F, employment F.
- Hendry (town): math 35% / reading 40% proficiency, ranked #65 of 73 in FL (top 89%) — families likely to look elsewhere, expect single-tenant / working-renter base with shorter leases; 75% free/reduced lunch — lower-income household profile, screen leases tightly.
- Zoned schools: Country Oaks Elementary School (math 48% / reading 45%, grade D-, #1,223 of 2,144 statewide, top 57%, 893 students, 75% FRL); Labelle Middle School (math 37% / reading 38%, grade F, #395 of 571 statewide, top 70%, 817 students, 72% FRL); Labelle High School (math 42% / reading 41%, grade F, #284 of 667 statewide, top 43%, 1,451 students, 62% FRL).
- Market conditions: 950 active listings in the ZIP; 5 comparable units currently listed for rent nearby; rentals at typical pace (median 25d on market — plan ~3-4 weeks tenant-placement turnaround); 557 units permitted in Hendry County in 2024 (45 in 5+ unit buildings).
- At $2,268/mo this rent would consume 48% of the median local household income ($57k/yr) (locally 498% of renters already pay >50% of income on rent) — very limited rent-growth headroom before tenants either downsize or default.
Forward outlook
- In year one you build about $23k of equity ($2k loan paydown + $22k appreciation (10.0% local appreciation)).
- Hendry County population projected to shrink 7% by 2050 — rents likely to lag national; underwrite the cash flow, not the appreciation.
- At projected returns (10.0% appreciation + 3.0% rent growth), your $61k cash investment doubles in ~3 years — after that, you're playing with house money.
- By year 2, paydown + projected appreciation supports a ~$38k cash-out refi (75% LTV) — recoverable capital for the next deal without selling this one.
Negotiation context
- Only 4 days on market — expect competitive offers; lowballing is unlikely to land.
- 3 sale attempts since 23y ago with the ask held roughly flat each time — persistent listings suggest the price (not the market) is what's stuck; bring a comps-based counter.
- Current owner paid $130k; list at $219k implies a 69% gain — meaningful room to come down on a strong offer.
Risks & watch-outs
- Climate carrying-cost: severe wind risk, 99% chance of damaging wind over 30y; extreme-heat days projected 7→26/yr by 2055 (HVAC capex compounding) — expect insurance premiums to compound above CPI over the hold.
Questions for the listing agent
- Is there a deadline driving the sale (1031 exchange, divorce, estate, relocation)? That informs how much negotiation room exists.
- Schools are F-rated, which usually means shorter tenancies and higher turnover. Who's the typical renter profile here, and what's been the actual vacancy rate?
- What's the average days-on-market for RENTAL listings here right now (not sales)? A rising rental-DOM trend means longer vacancies and softer asking-rent achievability than the comps imply.
- What's the recent tenant-quality profile in this submarket — average credit score on applications, eviction rate, late-payment / NSF rate, and stable-employment percentage? A property-management company in the area should have these aggregated.
- How much new for-sale + rental construction is in the pipeline within 1–3 miles? Heavy new supply typically softens prices + rents 12–24 months out; constrained supply supports both.
Investment metrics
- 1% rule
- 1.04% ✓
- Cap rate
- 7.94%
- Cash-on-cash
- 5.87%
- DSCR
- 1.26
- GRM
- 8.0
CMA / ARV
- ARV (on-the-fly)
- $271,440
- Comps found
- 12
Show comp detail 12 sales within ~0.75 mi
| Address | Dist | Beds/Ba | Sqft | Sold | Price | $/sf | Match |
|---|---|---|---|---|---|---|---|
| 2040 S Montana Cir | 0.00mi | 3/2.0 | 1,392 (0%) | 0mo | $230,000 | $165 | 100 |
| 4018 Caloosa Loop | 0.41mi | 3/2.0 | 1,404 (+1%) | 2mo | $214,000 | $152 | 78 |
| 3019 N Tulip Rd | 0.29mi | 4/2.0 (+1) | 1,499 (+8%) | 3mo | $285,000 | $190 | 66 |
| 4002 Cascade Ln | 0.55mi | 3/2.0 | 1,344 (-3%) | 3mo | $280,000 | $208 | 66 |
| 3012 Lady Ln | 0.53mi | 3/2.0 | 1,498 (+8%) | 7mo | $340,000 | $227 | 57 |
| 3011 Harvard Cir | 0.74mi | 3/2.0 | 1,364 (-2%) | 8mo | $266,000 | $195 | 56 |
| 3054 NE Beechwood Cir | 0.48mi | 3/2.0 | 1,564 (+12%) | 8mo | $281,000 | $180 | 50 |
| 3060 NE Beechwood Cir | 0.53mi | 3/2.0 | 1,592 (+14%) | 4mo | $245,000 | $154 | 48 |
| 3003 NW Beechwood Cir | 0.65mi | 3/2.0 | 1,585 (+14%) | 1mo | $505,000 | $319 | 46 |
| 2014 Odessa Cir | 0.69mi | 3/2.0 | 1,584 (+14%) | 1mo | $265,000 | $167 | 44 |
| 3014 Cherry Ln | 0.74mi | 4/2.0 (+1) | 1,499 (+8%) | 7mo | $299,999 | $200 | 41 |
| 3019 Lancer Rd | 0.69mi | 4/2.0 (+1) | 1,530 (+10%) | 7mo | $299,000 | $195 | 41 |
Match score weights: distance 35% · size 25% · config 20% · recency 20%. Top-matched comps best support the ARV.
Projected returns pro-forma
10.0% appreciation · 3.0% rent growth · sell at horizon
- IRR
- 28.5%
- Equity multiple
- 3.26×
- Total profit
- $138,404
- Equity at exit
- $197,293
- IRR
- 24.8%
- Equity multiple
- 7.40×
- Total profit
- $392,590
- Equity at exit
- $425,469
Cash invested: $61,320 (down + closing). Projections, not guarantees.
Landlord ↔ Tenant lean methodology
- Overall (STATE)
- 87 Strongly Landlord-Friendly
- State Florida
- 87 Strongly Landlord-Friendly · R+3
- County
- — inherits STATE
- City
- — inherits STATE
ZIP-level market 33935
- Home prices YoY
- 16.3%
- Active inventory
- 950
- Price-to-rent
- 8.0×
Monthly cashflow live
- Estimated rent
- $2,268 high interval (Pro) →
- Mortgage (P&I)
- −$1,148
- Tax from tax record
- −$252 /mo · $3,024/yr
- Insurance
- −$91
- HOA
- −$0
- Vacancy / Maint / Mgmt
- −$476
- Net cashflow
- $300
Break-even live
Sensitivity live
| Price | -10% $424 | -5% $362 | +0% $300 | +5% $238 | +10% $176 |
|---|---|---|---|---|---|
| Rent | -10% $121 | -5% $210 | +0% $300 | +5% $390 | +10% $479 |
| Rate | -1.0pp $410 | -0.5pp $356 | base $300 | +0.5pp $243 | +1.0pp $186 |
UW: 25.0% down · 7.5% · 30yr · 1.5% tax · 5.0% vac · 8.0% maint · 8.0% mgmt
Financing live
Cash to close
- Down payment
- $54,750
- Closing costs
- $6,570
- Reserves months
- —
- Total cash needed
- —
Loan-product check · same deal, 3 products live
Conventional
25% down · 7.5% · 30yr
- Down + closing
- —
- Monthly P&I
- —
- Monthly cashflow
- —
- DSCR
- —
- Eligible?
- —
Personal DTI + credit; lowest rate.
DSCR
20% down · 8.5% · 30yr
- Down + closing
- —
- Monthly P&I
- —
- Monthly cashflow
- —
- DSCR
- —
- Eligible?
- —
No personal income docs; deal must DSCR.
Hard money
10% down · 12.0% · 12mo
- Down + closing
- —
- Monthly P&I
- —
- Monthly cashflow
- —
- DSCR
- —
- Eligible?
- —
Short-term bridge; refi at stabilization.
Rent comps 5 comps
| Address | Beds | Baths | Sqft | Rent | $/sqft | DOM | Units | Dist |
|---|---|---|---|---|---|---|---|---|
| 3020 N Lakewood Rd Labelle, FL | 4.0 | 2.0 | 1499 | $1,950 | $1.30 | 25d | 1 | 0.61mi |
| 5029 S Rosebud Cir Labelle, FL | 3.0 | 2.0 | 1389 | $1,780 | $1.28 | 25d | 1 | 0.85mi |
| 3051 NW Beechwood Cir Labelle, FL | 4.0 | 2.0 | 1499 | $2,200 | $1.47 | 25d | 1 | 0.90mi |
| 5012 Gunn Pl Labelle, FL | 3.0 | 2.5 | 1783 | $2,500 | $1.40 | 4d | 1 | 1.03mi |
| 5029 W Hummingbird Dr Labelle, FL | 3.0 | 2.0 | 1212 | $2,450 | $2.02 | 4d | 1 | 1.08mi |
Listing history 9 events
-
2026-05-15status Pending
-
2026-05-11$219,000 Active
-
2021-05-14soldstatus $129,700
-
2016-03-01price $49,500 564-char remark
Show marketing remark (564 chars)
Bright 3 Bedroom 2 Bathroom home in Labelle. Family Room features Vaulted Ceilings and Pretty Arched Windows. Kitchen has Microwave, Dishwasher and Eat In Kitchen Area. Inside Laundry Room next to Kitchen with Washer and Dryer Hookup. Master Bedroom features Closet With Built In Shelving, and Great Master Bathroom with Dual Sinks, Garden Tub and Separate Stand In Shower with Sliding Doors! Guest Bathroom has Tub and Shower Combination. Large Backyard with Trees! Nice rural location in LaBelle. Don't miss out, schedule your showing for this Lovely Home today!
-
2014-06-06soldstatus $53,000 564-char remark
Show marketing remark (564 chars)
Bright 3 Bedroom 2 Bathroom home in Labelle. Family Room features Vaulted Ceilings and Pretty Arched Windows. Kitchen has Microwave, Dishwasher and Eat In Kitchen Area. Inside Laundry Room next to Kitchen with Washer and Dryer Hookup. Master Bedroom features Closet With Built In Shelving, and Great Master Bathroom with Dual Sinks, Garden Tub and Separate Stand In Shower with Sliding Doors! Guest Bathroom has Tub and Shower Combination. Large Backyard with Trees! Nice rural location in LaBelle. Don't miss out, schedule your showing for this Lovely Home today!
-
2013-09-04$84,900
-
2004-10-29soldstatus $95,000
-
2004-09-28price $99,000
-
2003-05-01$5,000
ⓘ Source: listings_history table (triggers on properties + properties_extension) + one-shot
backfill from property_details.listing_events for pre-trigger history.
Tax reassessment forecast FL · Resets to sale price
- Current annual tax
- $3,024 · $252/mo
- Projected year-2 tax
- $3,024 · $252/mo
- Expected delta
- $0/yr ($0/mo · 0.0%)
ⓘ Screening estimate from a state-policy table — verify with the county assessor before closing.
Climate risk First Street
- Flood 4/10 Moderate FEMA zone X (unshaded) · 22% chance over 30 yrs
- Wildfire 3/10 Moderate
- Heat 9/10 Extreme 7 d/yr ≥108°F today · 26 d/yr by 30 yrs out
- Wind 10/10 Extreme 99% chance of damaging wind over 30 yrs
- Air quality 2/10 Low 0 unhealthy d/yr today · 1 by 30 yrs out
Nearby sold comps map
Loading sold comps map…
Walkable amenities ~0.75 mi
Loading nearby amenities…
Taxation est. · year 1
- Rental income
- $27,216
- − Mortgage interest
- −$12,267
- − Property taxes
- −$3,024
- − Insurance
- −$1,095
- − Repairs & maintenance
- −$2,177
- − Management
- −$2,177
- − Depreciation
- −$6,371
- Taxable income
- $105
- Est. tax owed @ 24.0%
- −$25
- After-tax cash flow
- $3,575/yr
For passive investors: Depreciation is non-cash, so a rental often shows a tax loss while cash-flowing — sheltering income. Rental losses are passive: they offset passive income freely, and up to $25,000/yr can offset ordinary (W-2) income if you actively participate and your MAGI is under $100k (phasing out to $0 by $150k); unused losses carry forward. On sale, claimed depreciation is recaptured at up to 25%, and gains may owe capital-gains tax (a 1031 exchange can defer both). Figures are a year-1 estimate at your 24.0% rate — not tax advice; consult a CPA.
Schools (NCES district)
- District
- Hendry
- NCES district ID
- 1200780
- Math proficiency
- 35% ▼ -11.00%
- Reading proficiency
- 40% ▼ -4.00%
- Median HH income
- $37,043
- Composite
- 31.16/100
- National rank
- #6054
- State rank
- #65 of 73 in FL
Livability — Port LaBelle
- Score
- 62/100
- State rank
- #750
- US rank
- #16264
Category grades
Schools grade is shown separately in the Schools card above.
Census & demographics
- Census place
- Port LaBelle, FL
- County
- Hendry County · 23,186 people
- Metro
- Clewiston, FL
- Population (ZIP)
- 23,186
- Household income
- $57,009
- Rent vs Own
- Severe rent burden
- 498.0
Population outlook (Hendry County) Hauer SSP2
- Today (2025)
- 38,866 people
- By 2030
- 38,558 · -0.8%
- By 2040
- 37,743 · -2.9%
- By 2050
- 36,117 · -7.1%
- By 2075
- 30,070 · -22.6%
- By 2100
- 21,966 · -43.5%
Race, ethnicity, and origin ACS 2023
- Neighborhood character
- Majority Hispanic (56%)
- Race & ethnicity
- Hispanic / Latino 56% White 39% Two or more races 21% Black 2% Native American 2%
- Hispanic origin (detail)
- Mexican 40% Puerto Rican 3% Cuban 5%
- Common ancestry
- Lithuanian 2% Serbian 2% Slovak 1%
- Foreign-born
- 27% · Canada, Jamaica
- Languages at home
- 50% English-only · Spanish 50%
Political lean MEDSL · Hendry
- 2024 margin
- Solid R (+38.3) · D 30.4% · R 68.7%
- 2008→2024 swing
- -31.1pp toward R · 2008: -7.2pp · 2024: -38.3pp
- All cycles
- 2024: R+38.3 2020: R+23.0 2016: R+14.2 2012: R+5.9 2008: R+7.2
Not yet ingested
- Civics
- —
Market trends
- HPI YoY
- ▲ 75.20%
- Current HPI
- 537.4928
- Rent YoY
- —
- Metro
- Clewiston, FL
- State GDP YoY
- ▲ 3.28%
- F500 in state
- 36
Industry mix (Fortune 500 HQ in FL)
| Industry | F500 HQs | Revenue |
|---|---|---|
| Industrial Technology | 2 | $29B |
|
||
| Insurance | 2 | $17B |
|
||
| Retail | 1 | $60B |
|
||
| Technology Distribution | 1 | $58B |
|
||
| Homebuilding | 1 | $35B |
|
||
| Technology Manufacturing | 1 | $35B |
|
||
Price history
+4280.0% since first listed9 events — show timeline
- 2026-05-15 Pending — FORTMLS
- 2026-05-11 Listed $219,000 FORTMLS
- 2021-05-14 Sold (Public Records) $129,700 Public Records
- 2016-03-01 Price Changed $49,500 FORTMLS
- 2014-06-06 Sold (MLS) $53,000 FORTMLS
- 2013-09-04 Listed $84,900 FORTMLS
- 2004-10-29 Sold (MLS) $95,000 FORTMLS
- 2004-09-28 Price Changed $99,000 FORTMLS
- 2003-05-01 Listed $5,000 FORTMLS
Property tax history
+6.9%/yrLatest (2025): $3,024 · +4.5% YoY. Source: county tax records.
Cash-flow waterfall
monthlySold comps — $/sqft
last 12 mo · ≤1 miLoading sold comps…