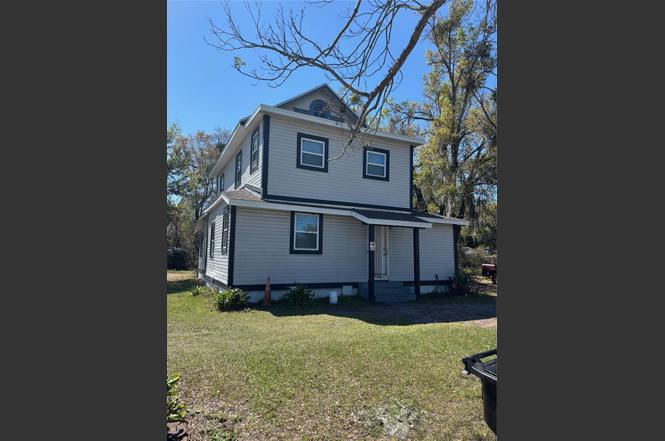
1012 W Jefferson St · Orlando, FL
Flood risk 1/10 · Minimal
- FEMA flood zone
- X (unshaded)
- Chance of flooding over 30 yrs
- 0.0%
- Est. flood insurance / yr
- $507 – $1,088
Fire risk 1/10 · Minimal
- Est. fire insurance / yr
- $947 – $1,759
Heat risk 9/10 · Severe
- Hot days now (above 108°F)
- 7 days/yr
- Hot days in 30 yrs
- 22 days/yr
Wind risk 9/10 · Severe
- Chance of severe wind over 30 yrs
- 99.0%
Air-quality risk 1/10 · Minimal
- Unhealthy air days now
- 0 days/yr
- Unhealthy air days in 30 yrs
- 0 days/yr
Risk factors via First Street. Map © Google.
Why this score? — see what drove the D+ grade
The composite is a weighted blend of 9 inputs, each scored 0–100. Each bar is that input's sub-score; the figure is the points it added to the 100-point composite (weight × sub-score).
- ARV discount +15.0/15.0
- Cash flow +13.4/30.0
- Livability +4.3/5.0
- Schools +4.1/10.0
- DSCR +4.0/10.0
- 1% rule +3.1/10.0
- Rent growth +2.9/5.0
- Condition / age +2.5/5.0
- Appreciation +0.0/10.0
$285,000
🖨 Deal sheet (PDF) 📄 Offer letter ✓ Due diligence
Listing remarks MLS
4 bedroom, 2 bath home in the heart of downtown. Located on a large corner lot close to everything. There are 2 bedrooms and 1 bathroom on each floor. The home needs a lot of TLC but could potentially be a great fix and flip investment property!
Key facts
- 5,424 sq ft lot
- Built 1920
- Listed 100 days
Property features AI
Finance
- Other: Zoned R-2B/T/PH; Lot approximately 0.12 acres (115 x 41), asphalt and concrete road access
- Financial info: No lease restrictions; Tax info available (not included per instructions)
- HOA & community: No HOA/association indicated; No association approval required
Exterior
- Utilities: Public water; Public sewer; Electricity connected
- Home design: Single family residence; Residential property; Two stories; Faces east; Entry level: 1
- Construction: Vinyl siding and frame construction; Shingle roof; Crawlspace foundation; Built with approximately 1,662 sq ft of living area
- Exterior features: Exterior lighting; Other exterior features
Interior
- Kitchen: Range; Refrigerator
- Bedrooms: 7 bedrooms
- Flooring: Ceramic tile; Laminate; Other
- Bathrooms: 2 full bathrooms
- Heating & cooling: Central heating (electric); Central air conditioning
- Interior features: Ceiling fans
- Laundry & utility: Indoor laundry
Neighborhood map
What this means for you Summary
Snapshot
- This is a 4-bed/2.0-bath single-family listed at $285k.
Deal economics
- At list price, monthly cash flow is $5 ($61/yr) — positive.
- The deal already cash-flows at list — no discount required.
- To meet the 1% rule (rent ≥ 1% of price), the offer needs to be $231k (19.0% below list).
- Recommended offer: $231k (19.0% below list) — sets the bar for 1% rule.
- Cap rate 6.3% vs local median 3.0% in Orlando — top-decile yield for the area; either an underpriced asset or a hidden risk that comps aren't pricing in. Stress-test before assuming the spread holds.
Location & tenants
- Location reads 86/100 on livability (#12 in FL, #360 nationally) — a professional / high-income tenant draw. Strengths: amenities A+, commute A+, housing A+.
- Orange (suburban): math 46% / reading 51% proficiency, ranked #43 of 73 in FL (top 59%) — families likely to look elsewhere, expect single-tenant / working-renter base with shorter leases.
- Market conditions: Rents rising (+1.4%/yr); 142 active listings in the ZIP; 30 comparable units currently listed for rent nearby; rentals at typical pace (median 19d on market — plan ~3-4 weeks tenant-placement turnaround); lower-income renter base — watch delinquency; 8,053 units permitted in Orange County in 2024 (3,133 in 5+ unit buildings).
- At $2,309/mo this rent would consume 68% of the median local household income ($41k/yr) (locally 1597% of renters already pay >50% of income on rent) — very limited rent-growth headroom before tenants either downsize or default.
Forward outlook
- Local home prices are declining (-3.0%/yr); year-one equity from $2k of loan paydown is wiped out by about $9k of value loss. Plan a longer hold.
- Orange County population projected at +52% by 2050 — long-run rental-demand tailwind backs the buy-and-hold thesis.
Negotiation context
- It's been on market 101 days — a 9% lower offer ($259k) is reasonable based on typical stale-listing flexibility.
- 10 sale attempts since 5y ago with the ask held roughly flat each time — persistent listings suggest the price (not the market) is what's stuck; bring a comps-based counter.
- Current owner paid $112k; list at $285k implies a 154% gain — meaningful room to come down on a strong offer.
Risks & watch-outs
- Watch-outs: built in 1920 — expect roof / HVAC / electrical / plumbing capex.
- Climate carrying-cost: severe wind risk, 99% chance of damaging wind over 30y; extreme-heat days projected 7→22/yr by 2055 (HVAC capex compounding) — expect insurance premiums to compound above CPI over the hold.
Questions for the listing agent
- It's been on market 101 days. Have you received any prior offers? Is the seller open to a 19% concession, seller financing, or rate buy-down credit?
- Built in 1920 — when were the roof, HVAC, electrical panel, plumbing, and water heater last replaced?
- Why hasn't it sold? Are there any deal-killer items the seller is aware of (foundation, flood, title, zoning, code violations)?
- Is there a deadline driving the sale (1031 exchange, divorce, estate, relocation)? That informs how much negotiation room exists.
- Schools are B-rated — typically a magnet for longer-tenancy family renters. What's the average tenant stay here, and is there a school-zone premium baked into asking?
- The area grade is low — what's the realistic commute time and amenity access for the typical tenant pool here? Any planned neighborhood developments (good or bad) we should know about?
- What's the average days-on-market for RENTAL listings here right now (not sales)? A rising rental-DOM trend means longer vacancies and softer asking-rent achievability than the comps imply.
- What's the recent tenant-quality profile in this submarket — average credit score on applications, eviction rate, late-payment / NSF rate, and stable-employment percentage? A property-management company in the area should have these aggregated.
- How much new for-sale + rental construction is in the pipeline within 1–3 miles? Heavy new supply typically softens prices + rents 12–24 months out; constrained supply supports both.
Investment metrics
- 1% rule
- 0.81% ✗
- Cap rate
- 6.31%
- Cash-on-cash
- 0.08%
- DSCR
- 1.00
- GRM
- 10.3
CMA / ARV
- ARV (on-the-fly)
- $465,360
- Comps found
- 4
Show comp detail 4 sales within ~0.75 mi
| Address | Dist | Beds/Ba | Sqft | Sold | Price | $/sf | Match |
|---|---|---|---|---|---|---|---|
| 1005 Randall St | 0.52mi | 3/2.5 (-1) | 1,720 (+4%) | 13mo | $460,000 | $267 | 52 |
| 919 Boardman St | 0.71mi | 3/2.0 (-1) | 1,611 (-3%) | 13mo | $589,000 | $366 | 46 |
| 1911 Rock Lake Dr | 0.73mi | 3/2.0 (-1) | 1,538 (-8%) | 6mo | $181,000 | $118 | 44 |
| 610 Kittredge Dr | 0.71mi | 3/2.0 (-1) | 1,456 (-12%) | 11mo | $407,000 | $280 | 32 |
Match score weights: distance 35% · size 25% · config 20% · recency 20%. Top-matched comps best support the ARV.
Projected returns pro-forma
-3.0% appreciation · 1.42% rent growth · sell at horizon
- IRR
- -17.9%
- Equity multiple
- 0.38×
- Total profit
- $-49,531
- Equity at exit
- $42,494
- IRR
- -13.2%
- Equity multiple
- 0.28×
- Total profit
- $-57,316
- Equity at exit
- $24,642
Cash invested: $79,800 (down + closing). Projections, not guarantees.
Landlord ↔ Tenant lean methodology
- Overall (STATE)
- 87 Strongly Landlord-Friendly
- State Florida
- 87 Strongly Landlord-Friendly · R+3
- County
- — inherits STATE
- City
- — inherits STATE
ZIP-level market 32805
- Home prices YoY
- -7.6%
- Rents YoY
- 1.4%
- Active inventory
- 142
- Price-to-rent
- 10.3×
Monthly cashflow live
- Estimated rent
- $2,309 high interval (Pro) →
- Mortgage (P&I)
- −$1,495
- Tax from tax record
- −$206 /mo · $2,470/yr
- Insurance
- −$119
- HOA
- −$0
- Vacancy / Maint / Mgmt
- −$485
- Net cashflow
- $5
Break-even live
Sensitivity live
| Price | -10% $166 | -5% $86 | +0% $5 | +5% $-76 | +10% $-156 |
|---|---|---|---|---|---|
| Rent | -10% $-177 | -5% $-86 | +0% $5 | +5% $96 | +10% $187 |
| Rate | -1.0pp $149 | -0.5pp $78 | base $5 | +0.5pp $-69 | +1.0pp $-144 |
UW: 25.0% down · 7.5% · 30yr · 1.5% tax · 5.0% vac · 8.0% maint · 8.0% mgmt
Financing live
Cash to close
- Down payment
- $71,250
- Closing costs
- $8,550
- Reserves months
- —
- Total cash needed
- —
Loan-product check · same deal, 3 products live
Conventional
25% down · 7.5% · 30yr
- Down + closing
- —
- Monthly P&I
- —
- Monthly cashflow
- —
- DSCR
- —
- Eligible?
- —
Personal DTI + credit; lowest rate.
DSCR
20% down · 8.5% · 30yr
- Down + closing
- —
- Monthly P&I
- —
- Monthly cashflow
- —
- DSCR
- —
- Eligible?
- —
No personal income docs; deal must DSCR.
Hard money
10% down · 12.0% · 12mo
- Down + closing
- —
- Monthly P&I
- —
- Monthly cashflow
- —
- DSCR
- —
- Eligible?
- —
Short-term bridge; refi at stabilization.
Rent comps 30 comps
| Address | Beds | Baths | Sqft | Rent | $/sqft | DOM | Units | Dist |
|---|---|---|---|---|---|---|---|---|
| 1045 Polk St Unit 1049B Orlando, FL | 3.0 | 1.0 | 1062 | $1,650 | $1.55 | 24d | 1 | 0.08mi |
| 812 W Livingston St Unit A Orlando, FL | 3.0 | 2.0 | 1299 | $1,595 | $1.23 | 24d | 1 | 0.21mi |
| 659 W Amelia St Orlando, FL | 1.0–3.0 | 1.0–2.0 | 849 | $2,282 | $2.69 | 2d | 27 | 0.47mi |
| 480 N Terry Ave Orlando, FL | 3.0 | 1.0–2.0 | 841 | $2,709 | $3.22 | 3d | 29 | 0.51mi |
| 505 Chatham Ave Orlando, FL | 3.0 | 1.0–2.0 | 1022 | $3,144 | $3.08 | 4d | 27 | 0.56mi |
| 711 Arlington St Orlando, FL | 3.0 | 1.0 | 1194 | $1,995 | $1.67 | 13d | 1 | 0.57mi |
| 732 Edgewater Dr Orlando, FL | 4.0 | 2.5 | 2112 | $3,740 | $1.77 | 24d | 1 | 0.73mi |
| 816 Putnam Ave Orlando, FL | 3.0 | 2.0 | 1678 | $2,750 | $1.64 | 24d | 1 | 0.76mi |
| 732 S Lee Ave Orlando, FL | 3.0 | 2.5 | 1914 | $2,295 | $1.20 | 18d | 1 | 0.80mi |
| 637 N Tampa Ave Orlando, FL | 4.0 | 2.0 | 1378 | $2,300 | $1.67 | 5d | 1 | 0.86mi |
| 410 N Orange Ave Orlando, FL | 3.0 | 1.0–3.0 | 854 | $4,725 | $5.53 | 2d | 181 | 0.91mi |
| 414 Sunset Dr Orlando, FL | 3.0 | 1.0 | 1268 | $1,850 | $1.46 | 24d | 1 | 1.04mi |
| 335 N Magnolia Ave Orlando, FL | 3.0 | 1.0–3.0 | 1041 | $2,640 | $2.54 | 2d | 35 | 1.04mi |
| 151 E Robinson St Orlando, FL | 4.0 | 1.0–3.5 | 1815 | $10,000 | $5.51 | 15d | 2 | 1.07mi |
| 2314 W South St Orlando, FL | 3.0 | 2.0 | 1440 | $2,000 | $1.39 | 15d | 1 | 1.18mi |
| 728 Columbia St Unit A Orlando, FL | 3.0 | 1.0 | 1500 | $1,500 | $1.00 | 24d | 1 | 1.24mi |
| 728 Columbia St Orlando, FL | 3.0 | 1.0 | 1500 | $1,500 | $1.00 | 15d | 1 | 1.24mi |
| 638 Columbia St Orlando, FL | 4.0 | 1.0 | 1500 | $1,500 | $1.00 | 24d | 1 | 1.27mi |
| 413 E Pine St Orlando, FL | 3.0 | 2.0 | 1743 | $3,485 | $2.00 | 24d | 1 | 1.31mi |
| 101 Lake Ave Orlando, FL | 3.0 | 2.0 | 1706 | $4,000 | $2.34 | 24d | 1 | 1.33mi |
| 733 Main Ln Orlando, FL | 3.0 | 1.0–2.0 | 1044 | $3,014 | $2.89 | 2d | 25 | 1.34mi |
| 2419 Orange Center Blvd Orlando, FL | 3.0 | 2.0 | 1526 | $2,600 | $1.70 | 24d | 1 | 1.37mi |
| 266 Park Lake St Unit 19 Orlando, FL | 3.0 | 3.5 | 1785 | $4,600 | $2.58 | 24d | 1 | 1.37mi |
| 431 E Central Blvd Orlando, FL | 3.0 | 1.0–3.0 | 1228 | $3,420 | $2.79 | 2d | 24 | 1.37mi |
| 420 E Church St Orlando, FL | 1.0–3.0 | 1.0–2.0 | 1086 | $3,289 | $3.03 | 3d | 12 | 1.38mi |
| 644 Indiana St Orlando, FL | 3.0 | 2.0 | 1308 | $2,200 | $1.68 | 24d | 1 | 1.39mi |
| 520 E Church St Orlando, FL | 1.0–3.0 | 1.0–2.0 | 1108 | $3,829 | $3.45 | 4d | 14 | 1.45mi |
| 97 N Goldwyn Ave Orlando, FL | 3.0 | 2.0 | 1531 | $2,400 | $1.57 | 24d | 1 | 1.46mi |
| 1028 Yates St Orlando, FL | 3.0 | 2.0 | 1808 | $900 | $0.50 | 14d | 1 | 1.47mi |
| 1 S Eola Dr #11 Orlando, FL | 3.0 | 3.0 | 1978 | $3,795 | $1.92 | 24d | 1 | 1.49mi |
Listing history 36 events
-
2026-06-21days on market $285,000 Active 101 DOM
-
2026-06-18days on market $285,000 Active 98 DOM
-
2026-06-17days on market $285,000 Active 97 DOM
-
2026-06-16days on market $285,000 Active 96 DOM
-
2026-06-15days on market $285,000 Active 95 DOM
-
2026-06-13days on market $285,000 Active 93 DOM
-
2026-06-13days on market $285,000 Active 92 DOM
-
2026-06-09days on market $285,000 Active 89 DOM
-
2026-06-08days on market $285,000 Active 88 DOM
-
2026-06-07days on market $285,000 Active 87 DOM
-
2026-06-04days on market $285,000 Active 84 DOM
-
2026-06-03days on market $285,000 Active 83 DOM
-
2026-06-02days on market $285,000 Active 82 DOM
-
2026-06-02days on market $285,000 Active 81 DOM
-
2026-05-31days on market $285,000 Active 80 DOM
-
2026-03-12$285,000 Active
-
2024-05-22status Pending
-
2024-05-20status Active
-
2024-05-20status Pending
-
2024-05-20status Active
-
2024-05-15status Pending
-
2024-05-14historical
-
2024-03-07status Active
-
2024-02-20historical
-
2024-01-23$340,000 Active
-
2022-03-10soldstatus $112,000 Closed 245-char remark
Show marketing remark (245 chars)
4 bedroom, 2 bath home in the heart of downtown. Located on a large corner lot close to everything. There are 2 bedrooms and 1 bathroom on each floor. The home needs a lot of TLC but could potentially be a great fix and flip investment property!
-
2022-02-24status Pending 245-char remark
Show marketing remark (245 chars)
4 bedroom, 2 bath home in the heart of downtown. Located on a large corner lot close to everything. There are 2 bedrooms and 1 bathroom on each floor. The home needs a lot of TLC but could potentially be a great fix and flip investment property!
-
2022-02-22status Active 245-char remark
Show marketing remark (245 chars)
4 bedroom, 2 bath home in the heart of downtown. Located on a large corner lot close to everything. There are 2 bedrooms and 1 bathroom on each floor. The home needs a lot of TLC but could potentially be a great fix and flip investment property!
-
2022-01-13status Pending 245-char remark
Show marketing remark (245 chars)
4 bedroom, 2 bath home in the heart of downtown. Located on a large corner lot close to everything. There are 2 bedrooms and 1 bathroom on each floor. The home needs a lot of TLC but could potentially be a great fix and flip investment property!
-
2022-01-10status Active 245-char remark
Show marketing remark (245 chars)
4 bedroom, 2 bath home in the heart of downtown. Located on a large corner lot close to everything. There are 2 bedrooms and 1 bathroom on each floor. The home needs a lot of TLC but could potentially be a great fix and flip investment property!
-
2021-12-19status Pending 245-char remark
Show marketing remark (245 chars)
4 bedroom, 2 bath home in the heart of downtown. Located on a large corner lot close to everything. There are 2 bedrooms and 1 bathroom on each floor. The home needs a lot of TLC but could potentially be a great fix and flip investment property!
-
2021-12-06status Active 245-char remark
Show marketing remark (245 chars)
4 bedroom, 2 bath home in the heart of downtown. Located on a large corner lot close to everything. There are 2 bedrooms and 1 bathroom on each floor. The home needs a lot of TLC but could potentially be a great fix and flip investment property!
-
2021-11-30status Pending 245-char remark
Show marketing remark (245 chars)
4 bedroom, 2 bath home in the heart of downtown. Located on a large corner lot close to everything. There are 2 bedrooms and 1 bathroom on each floor. The home needs a lot of TLC but could potentially be a great fix and flip investment property!
-
2021-11-22status Active 245-char remark
Show marketing remark (245 chars)
4 bedroom, 2 bath home in the heart of downtown. Located on a large corner lot close to everything. There are 2 bedrooms and 1 bathroom on each floor. The home needs a lot of TLC but could potentially be a great fix and flip investment property!
-
2021-10-24status Pending 245-char remark
Show marketing remark (245 chars)
4 bedroom, 2 bath home in the heart of downtown. Located on a large corner lot close to everything. There are 2 bedrooms and 1 bathroom on each floor. The home needs a lot of TLC but could potentially be a great fix and flip investment property!
-
2021-10-09$200,000 Active 245-char remark
Show marketing remark (245 chars)
4 bedroom, 2 bath home in the heart of downtown. Located on a large corner lot close to everything. There are 2 bedrooms and 1 bathroom on each floor. The home needs a lot of TLC but could potentially be a great fix and flip investment property!
ⓘ Source: listings_history table (triggers on properties + properties_extension) + one-shot
backfill from property_details.listing_events for pre-trigger history.
Tax reassessment forecast FL · Resets to sale price
- Current annual tax
- $2,470 · $206/mo
- Projected year-2 tax
- $2,470 · $206/mo
- Expected delta
- $0/yr ($0/mo · 0.0%)
ⓘ Screening estimate from a state-policy table — verify with the county assessor before closing.
Climate risk First Street
- Flood 1/10 Low FEMA zone X (unshaded) · 0% chance over 30 yrs
- Wildfire 1/10 Low
- Heat 9/10 Extreme 7 d/yr ≥108°F today · 22 d/yr by 30 yrs out
- Wind 9/10 Extreme 99% chance of damaging wind over 30 yrs
- Air quality 1/10 Low 0 unhealthy d/yr today · 0 by 30 yrs out
Nearby sold comps map
Loading sold comps map…
Walkable amenities ~0.75 mi
Loading nearby amenities…
Taxation est. · year 1
- Rental income
- $27,710
- − Mortgage interest
- −$15,964
- − Property taxes
- −$2,470
- − Insurance
- −$1,425
- − Repairs & maintenance
- −$2,217
- − Management
- −$2,217
- − Depreciation
- −$8,291
- Taxable loss
- −$4,874
- Est. tax savings @ 24.0%
- +$1,170
- After-tax cash flow
- $1,231/yr
For passive investors: Depreciation is non-cash, so a rental often shows a tax loss while cash-flowing — sheltering income. Rental losses are passive: they offset passive income freely, and up to $25,000/yr can offset ordinary (W-2) income if you actively participate and your MAGI is under $100k (phasing out to $0 by $150k); unused losses carry forward. On sale, claimed depreciation is recaptured at up to 25%, and gains may owe capital-gains tax (a 1031 exchange can defer both). Figures are a year-1 estimate at your 24.0% rate — not tax advice; consult a CPA.
Schools (NCES district)
- District
- Orange
- NCES district ID
- 1201440
- Math proficiency
- 46% ▼ -9.00%
- Reading proficiency
- 51% ▼ -2.00%
- Median HH income
- $49,350
- Composite
- 41.47/100
- National rank
- #3461
- State rank
- #43 of 73 in FL
Livability — Orlando
- Score
- 86/100
- State rank
- #12
- US rank
- #360
Category grades
Schools grade is shown separately in the Schools card above.
Census & demographics
- Census place
- Orlando, FL
- County
- Orange County · 1,471,359 people
- City population
- 964,969
- Metro
- Orlando-Kissimmee-Sanford, FL
- Population (ZIP)
- 19,294
- Household income
- $40,515
- Rent vs Own
- Severe rent burden
- 1597.0
Population outlook (Orange County) Hauer SSP2
- Today (2025)
- 1,618,226 people
- By 2030
- 1,787,404 · +10.5%
- By 2040
- 2,125,621 · +31.4%
- By 2050
- 2,454,016 · +51.6%
- By 2075
- 3,173,711 · +96.1%
- By 2100
- 3,607,781 · +122.9%
Race, ethnicity, and origin ACS 2023
- Neighborhood character
- Predominantly Black (70%)
- Race & ethnicity
- Black 70% Hispanic / Latino 15% White 13% Two or more races 8%
- Hispanic origin (detail)
- Mexican 3% Puerto Rican 4% Cuban 1% Dominican 3%
- Common ancestry
- Hispanic 9% Russian 1%
- Foreign-born
- 16% · Canada, Jamaica
- Languages at home
- 80% English-only · Spanish 11% French/Haitian/Cajun 8%
Political lean MEDSL · Orange
- 2024 margin
- D (+13.6) · D 56.1% · R 42.5% · Other 1.3%
- 2008→2024 swing
- -5.0pp toward R · 2008: 18.6pp · 2024: 13.6pp
- All cycles
- 2024: D+13.6 2020: D+23.1 2016: D+24.6 2012: D+18.2 2008: D+18.6
Not yet ingested
- Civics
- —
Market trends
- HPI YoY
- ▼ -35.19%
- Current HPI
- 429.3242
- Rent YoY
- ▲ 1.42%
- Metro
- Orlando-Kissimmee-Sanford, FL
- State GDP YoY
- ▲ 3.28%
- F500 in state
- 36
Industry mix (Fortune 500 HQ in FL)
| Industry | F500 HQs | Revenue |
|---|---|---|
| Industrial Technology | 2 | $29B |
|
||
| Insurance | 2 | $17B |
|
||
| Retail | 1 | $60B |
|
||
| Technology Distribution | 1 | $58B |
|
||
| Homebuilding | 1 | $35B |
|
||
| Technology Manufacturing | 1 | $35B |
|
||
Price history
+42.5% since first listed21 events — show timeline
- 2026-03-12 Listed $285,000 Stellar MLS as Distributed by MLS Grid
- 2024-05-22 Pending — Stellar MLS as Distributed by MLS Grid
- 2024-05-20 Relisted — Stellar MLS as Distributed by MLS Grid
- 2024-05-20 Pending — Stellar MLS as Distributed by MLS Grid
- 2024-05-20 Relisted — Stellar MLS as Distributed by MLS Grid
- 2024-05-15 Pending — Stellar MLS as Distributed by MLS Grid
- 2024-05-14 Listing Removed — Stellar MLS as Distributed by MLS Grid
- 2024-03-07 Relisted — Stellar MLS as Distributed by MLS Grid
- 2024-02-20 Listing Removed — Stellar MLS as Distributed by MLS Grid
- 2024-01-23 Listed $340,000 Stellar MLS as Distributed by MLS Grid
- 2022-03-10 Sold (MLS) $112,000 Stellar MLS as Distributed by MLS Grid
- 2022-02-24 Pending — Stellar MLS as Distributed by MLS Grid
- 2022-02-22 Relisted — Stellar MLS as Distributed by MLS Grid
- 2022-01-13 Pending — Stellar MLS as Distributed by MLS Grid
- 2022-01-10 Relisted — Stellar MLS as Distributed by MLS Grid
- 2021-12-19 Pending — Stellar MLS as Distributed by MLS Grid
- 2021-12-06 Relisted — Stellar MLS as Distributed by MLS Grid
- 2021-11-30 Pending — Stellar MLS as Distributed by MLS Grid
- 2021-11-22 Relisted — Stellar MLS as Distributed by MLS Grid
- 2021-10-24 Pending — Stellar MLS as Distributed by MLS Grid
- 2021-10-09 Listed $200,000 Stellar MLS as Distributed by MLS Grid
Property tax history
+12.3%/yrLatest (2025): $2,470 · +8.2% YoY. Source: county tax records.
Cash-flow waterfall
monthlySold comps — $/sqft
last 12 mo · ≤1 miLoading sold comps…