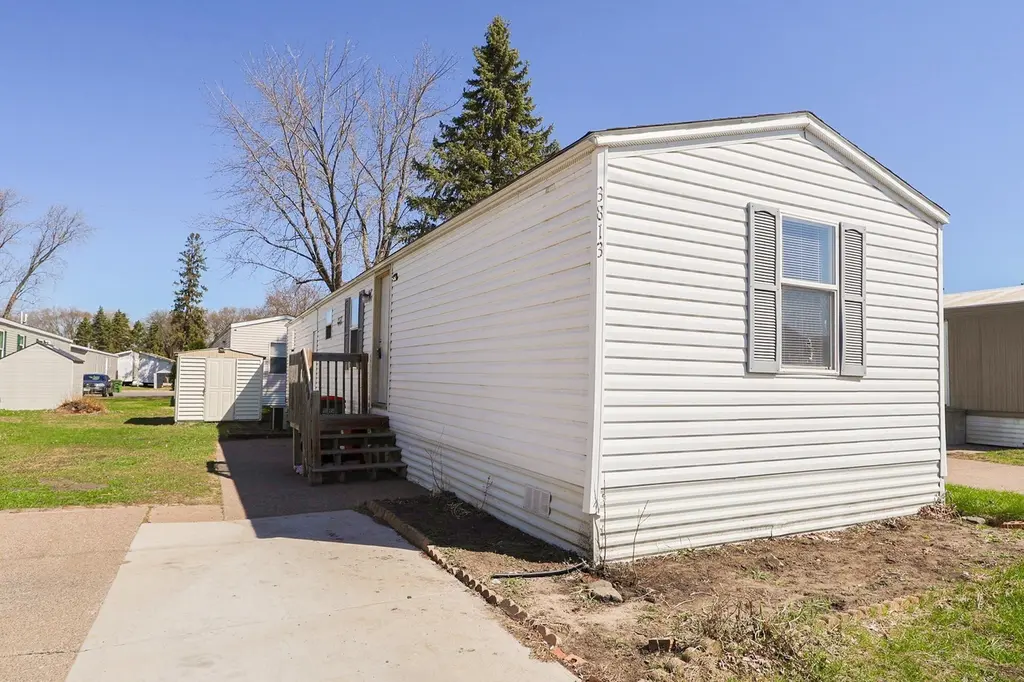
3813 Patriot Ln · Lexington, MN
Flood risk 1/10 · Minimal
- FEMA flood zone
- X (unshaded)
- Chance of flooding over 30 yrs
- 0.0%
- Est. flood insurance / yr
- $507 – $1,088
Fire risk 1/10 · Minimal
- Est. fire insurance / yr
- $888 – $1,650
Heat risk 2/10 · Minimal
- Hot days now (above 100°F)
- 7 days/yr
- Hot days in 30 yrs
- 14 days/yr
Wind risk 2/10 · Minimal
- Chance of severe wind over 30 yrs
- —
Air-quality risk 2/10 · Minimal
- Unhealthy air days now
- 1 days/yr
- Unhealthy air days in 30 yrs
- 1 days/yr
Risk factors via First Street. Map © Google.
Why this score? — see what drove the B grade
The composite is a weighted blend of 9 inputs, each scored 0–100. Each bar is that input's sub-score; the figure is the points it added to the 100-point composite (weight × sub-score).
- Cash flow +30.0/30.0
- 1% rule +10.0/10.0
- DSCR +10.0/10.0
- ARV discount +7.5/15.0
- Schools +5.5/10.0
- Livability +4.1/5.0
- Rent growth +2.5/5.0
- Condition / age +2.2/5.0
- Appreciation +0.0/10.0
$60,000
🖨 Deal sheet (PDF) 📄 Offer letter ✓ Due diligence
Listing remarks MLS
Welcome to this charming and well-maintained 3 bedroom mobile home offering comfortable living at an affordable price. Priced at $60,000, this home features a living area, a functional kitchen with plenty of storage, and a private primary suite with its own bathroom. The second bedroom is perfect for guests, kids, or a home office. Located in a friendly, well kept community with a lot rent of $750 per month, this home provides low-maintenance living and great value. Bright and open living space, Monthly lot rent includes water and garbage and sewer, $750. Move-in ready & affordable Schedule your showing today and see everything this cozy home has to offer!
Key facts
- Built 2004
- Listed 64 days
Neighborhood map
What this means for you Summary
Snapshot
- This is a 3-bed/1.0-bath manufactured listed at $60k. Condition is rated fair.
Deal economics
- At list price, monthly cash flow is $1k ($17k/yr) — positive.
- The deal already cash-flows at list — no discount required.
- Meets the 1% rule at list price ($2k rent vs $60k).
- Recommended offer: $56k (6.0% below list) — sets the bar for market timing.
Location & tenants
- Location reads 82/100 on livability (#38 in MN, #1,096 nationally) — a professional / high-income tenant draw. Strengths: crime A+, commute A+, housing A+; Watch: amenities F.
- Centennial Public School District (suburban): math 59% / reading 62% proficiency, ranked #26 of 301 in MN (top 9%) — acceptable for families but not a draw, mixed tenant base, ~2y average lease; only 13% free/reduced lunch — higher-income household profile.
- Market conditions: 144 active listings in the ZIP; 2 comparable units currently listed for rent nearby; solid renter incomes; 1,083 units permitted in Anoka County in 2024 (134 in 5+ unit buildings).
Forward outlook
- Local home prices are declining (-3.0%/yr); year-one equity from $415 of loan paydown is wiped out by about $2k of value loss. Plan a longer hold.
- Anoka County population projected at +11% by 2050 — modest demand growth; plan on rents tracking national, not racing it.
- At projected returns (-3.0% appreciation + 3.0% rent growth), your $17k cash investment doubles in ~2 years — after that, you're playing with house money.
Negotiation context
- It's been on market 65 days — a 6% lower offer ($56k) is reasonable based on typical stale-listing flexibility.
Questions for the listing agent
- It's been on market 65 days. Have you received any prior offers? Is the seller open to a 6% concession, seller financing, or rate buy-down credit?
- Have any recent inspections been done? Can we get a copy of the seller's disclosures and any deferred-maintenance estimates?
- Why hasn't it sold? Are there any deal-killer items the seller is aware of (foundation, flood, title, zoning, code violations)?
- Is there a deadline driving the sale (1031 exchange, divorce, estate, relocation)? That informs how much negotiation room exists.
- Schools are B-rated — typically a magnet for longer-tenancy family renters. What's the average tenant stay here, and is there a school-zone premium baked into asking?
- What's the average days-on-market for RENTAL listings here right now (not sales)? A rising rental-DOM trend means longer vacancies and softer asking-rent achievability than the comps imply.
- What's the recent tenant-quality profile in this submarket — average credit score on applications, eviction rate, late-payment / NSF rate, and stable-employment percentage? A property-management company in the area should have these aggregated.
- How much new for-sale + rental construction is in the pipeline within 1–3 miles? Heavy new supply typically softens prices + rents 12–24 months out; constrained supply supports both.
Investment metrics
- 1% rule
- 3.78% ✓
- Cap rate
- 34.77%
- Cash-on-cash
- 101.71%
- DSCR
- 5.53
- GRM
- 2.2
CMA / ARV
No comps found within radius.
Projected returns pro-forma
-3.0% appreciation · 3.0% rent growth · sell at horizon
- IRR
- —
- Equity multiple
- 5.82×
- Total profit
- $80,972
- Equity at exit
- $8,946
- IRR
- —
- Equity multiple
- 12.15×
- Total profit
- $187,309
- Equity at exit
- $5,188
Cash invested: $16,800 (down + closing). Projections, not guarantees.
Landlord ↔ Tenant lean methodology
- Overall (STATE)
- 46 Balanced
- State Minnesota
- 46 Balanced · D+2
- County
- — inherits STATE
- City
- — inherits STATE
ZIP-level market 55014
- Active inventory
- 144
- Price-to-rent
- 2.2×
Monthly cashflow live
- Estimated rent
- $2,269 medium interval (Pro) →
- Mortgage (P&I)
- −$315
- Tax from tax record
- −$29 /mo · $351/yr
- Insurance
- −$25
- HOA
- −$0
- Vacancy / Maint / Mgmt
- −$477
- Net cashflow
- $1,424
Break-even live
Sensitivity live
| Price | -10% $1,458 | -5% $1,441 | +0% $1,424 | +5% $1,407 | +10% $1,390 |
|---|---|---|---|---|---|
| Rent | -10% $1,245 | -5% $1,334 | +0% $1,424 | +5% $1,514 | +10% $1,603 |
| Rate | -1.0pp $1,454 | -0.5pp $1,439 | base $1,424 | +0.5pp $1,408 | +1.0pp $1,393 |
UW: 25.0% down · 7.5% · 30yr · 1.5% tax · 5.0% vac · 8.0% maint · 8.0% mgmt
Financing live
Cash to close
- Down payment
- $15,000
- Closing costs
- $1,800
- Reserves months
- —
- Total cash needed
- —
Loan-product check · same deal, 3 products live
Conventional
25% down · 7.5% · 30yr
- Down + closing
- —
- Monthly P&I
- —
- Monthly cashflow
- —
- DSCR
- —
- Eligible?
- —
Personal DTI + credit; lowest rate.
DSCR
20% down · 8.5% · 30yr
- Down + closing
- —
- Monthly P&I
- —
- Monthly cashflow
- —
- DSCR
- —
- Eligible?
- —
No personal income docs; deal must DSCR.
Hard money
10% down · 12.0% · 12mo
- Down + closing
- —
- Monthly P&I
- —
- Monthly cashflow
- —
- DSCR
- —
- Eligible?
- —
Short-term bridge; refi at stabilization.
Rent comps 2 comps
| Address | Beds | Baths | Sqft | Rent | $/sqft | DOM | Units | Dist |
|---|---|---|---|---|---|---|---|---|
| 9001 Griggs Ave Circle Pines, MN | 2.0 | 1.0–2.0 | 761 | $2,525 | $3.32 | 0d | 24 | 0.28mi |
| 10124 Lever St NE Circle Pines, MN | 1.0–2.0 | 1.0 | 750 | $1,325 | $1.77 | 0d | 1 | 1.45mi |
Listing history 16 events
-
2026-06-21days on market $60,000 Active 65 DOM
-
2026-06-18days on market $60,000 Active 62 DOM
-
2026-06-17days on market $60,000 Active 61 DOM
-
2026-06-16days on market $60,000 Active 60 DOM
-
2026-06-15days on market $60,000 Active 59 DOM
-
2026-06-13days on market $60,000 Active 57 DOM
-
2026-06-13days on market $60,000 Active 56 DOM
-
2026-06-09days on market $60,000 Active 53 DOM
-
2026-06-08days on market $60,000 Active 52 DOM
-
2026-06-07days on market $60,000 Active 51 DOM
-
2026-06-04days on market $60,000 Active 48 DOM
-
2026-06-03days on market $60,000 Active 47 DOM
-
2026-06-02days on market $60,000 Active 46 DOM
-
2026-06-01days on market $60,000 Active 45 DOM
-
2026-05-31days on market $60,000 Active 44 DOM
-
2026-04-17$60,000 Active 670-char remark
Show marketing remark (670 chars)
Welcome to this charming and well-maintained 3 bedroom mobile home offering comfortable living at an affordable price. Priced at $60,000, this home features a living area, a functional kitchen with plenty of storage, and a private primary suite with its own bathroom. The second bedroom is perfect for guests, kids, or a home office. Located in a friendly, well kept community with a lot rent of $750 per month, this home provides low-maintenance living and great value. Bright and open living space, Monthly lot rent includes water and garbage and sewer, $750. Move-in ready & affordable Schedule your showing today and see everything this cozy home has to offer!
ⓘ Source: listings_history table (triggers on properties + properties_extension) + one-shot
backfill from property_details.listing_events for pre-trigger history.
Tax reassessment forecast MN · Partial reset (capped growth)
- Current annual tax
- $351 · $29/mo
- Projected year-2 tax
- $511 · $43/mo
- Expected delta
- +$161/yr (+$13/mo · 45.8%)
ⓘ Screening estimate from a state-policy table — verify with the county assessor before closing.
Climate risk First Street
- Flood 1/10 Low FEMA zone X (unshaded) · 0% chance over 30 yrs
- Wildfire 1/10 Low
- Heat 2/10 Low 7 d/yr ≥100°F today · 14 d/yr by 30 yrs out
- Wind 2/10 Low
- Air quality 2/10 Low 1 unhealthy d/yr today · 1 by 30 yrs out
Nearby sold comps map
Loading sold comps map…
Walkable amenities ~0.75 mi
Loading nearby amenities…
Taxation est. · year 1
- Rental income
- $27,232
- − Mortgage interest
- −$3,361
- − Property taxes
- −$351
- − Insurance
- −$300
- − Repairs & maintenance
- −$2,179
- − Management
- −$2,179
- − Depreciation
- −$1,745
- Taxable income
- $17,118
- Est. tax owed @ 24.0%
- −$4,108
- After-tax cash flow
- $12,978/yr
For passive investors: Depreciation is non-cash, so a rental often shows a tax loss while cash-flowing — sheltering income. Rental losses are passive: they offset passive income freely, and up to $25,000/yr can offset ordinary (W-2) income if you actively participate and your MAGI is under $100k (phasing out to $0 by $150k); unused losses carry forward. On sale, claimed depreciation is recaptured at up to 25%, and gains may owe capital-gains tax (a 1031 exchange can defer both). Figures are a year-1 estimate at your 24.0% rate — not tax advice; consult a CPA.
Condition & rehab AI · 13 photos
This mobile home requires moderate repairs and updates to improve its condition and value. Painting, replacing cabinets, fixtures, and carpet can significantly enhance its appeal and marketability.
Repairs flagged
- Minor Kitchen cabinets — Cabinets show some wear and could benefit from a fresh coat of paint.
- Minor Bathroom fixtures — Fixtures appear dated and could be replaced for a fresh look.
- Minor Carpet — Carpet in living areas is worn and could be replaced for a more modern look.
Value-add opportunities
- Resale Paint interior walls — Fresh paint can make a significant difference in the home's appearance and value.
- Resale Replace kitchen cabinets — New cabinets can modernize the kitchen and add value.
- Resale Replace bathroom fixtures — Modern fixtures can enhance the bathroom's appeal and value.
- Resale Replace carpet — New carpet can make the living areas more inviting and add value.
Renovation cost estimate screening
| Repair item | Severity | Est. cost |
|---|---|---|
| Kitchen cabinets · Cabinets show some wear and could benefit from a fresh coat of paint. | Minor | $500–3,000 |
| Bathroom fixtures · Fixtures appear dated and could be replaced for a fresh look. | Minor | $500–3,000 |
| Carpet · Carpet in living areas is worn and could be replaced for a more modern look. | Minor | $500–3,000 |
| Total estimated repair cost · 3 items | $1,500–9,000 |
Value-add ROI direction
- Resale Paint interior walls — Fresh paint can make a significant difference in the home's appearance and value. ↑
- Resale Replace kitchen cabinets — New cabinets can modernize the kitchen and add value. ↑
- Resale Replace bathroom fixtures — Modern fixtures can enhance the bathroom's appeal and value. ↑
- Resale Replace carpet — New carpet can make the living areas more inviting and add value. ↑
ⓘ Cost ranges are severity-bucket heuristics (US national rule-of-thumb). Get contractor quotes + a written scope before underwriting a rehab budget.
Schools (NCES district)
- District
- Centennial Public School District
- NCES district ID
- 2708100
- Math proficiency
- 59% ▼ -12.00%
- Reading proficiency
- 62% ▼ -6.00%
- Median HH income
- $84,468
- Composite
- 54.78/100
- National rank
- #1316
- State rank
- #26 of 301 in MN
Livability — Lexington
- Score
- 82/100
- State rank
- #38
- US rank
- #1096
Category grades
Schools grade is shown separately in the Schools card above.
Census & demographics
- Census place
- Lexington, MN
- County
- Anoka County · 277,116 people
- Metro
- Minneapolis-St. Paul-Bloomington, MN-WI
- Population (ZIP)
- 29,047
- Household income
- $103,658
- Rent vs Own
- Severe rent burden
- 473.0
Population outlook (Anoka County) Hauer SSP2
- Today (2025)
- 375,223 people
- By 2030
- 387,850 · +3.4%
- By 2040
- 407,239 · +8.5%
- By 2050
- 417,541 · +11.3%
- By 2075
- 448,447 · +19.5%
- By 2100
- 464,954 · +23.9%
Race, ethnicity, and origin ACS 2023
- Neighborhood character
- Predominantly White (85%)
- Race & ethnicity
- White 85% Black 4% Asian 4% Two or more races 4% Hispanic / Latino 3%
- Common ancestry
- Portuguese 11% Romanian 6% Lithuanian 4%
- Foreign-born
- 6% · Canada, China, South Korea
- Languages at home
- 92% English-only · Spanish 3% Other Asian/Pacific 1% Arabic 1%
Political lean MEDSL · Anoka
- 2024 margin
- Toss-up / Even · D 46.6% · R 51.0% · Other 2.4%
- 2008→2024 swing
- -2.0pp toward R · 2008: -2.4pp · 2024: -4.4pp
- All cycles
- 2024: R+4.4 2020: R+1.9 2016: R+9.7 2012: R+2.6 2008: R+2.4
Not yet ingested
- Civics
- —
Market trends
- HPI YoY
- ▼ -206.50%
- Current HPI
- 242.8272
- Rent YoY
- —
- Metro
- Minneapolis-St. Paul-Bloomington, MN-WI
- State GDP YoY
- ▲ 2.41%
- F500 in state
- 34
Industry mix (Fortune 500 HQ in MN)
| Industry | F500 HQs | Revenue |
|---|---|---|
| Healthcare | 2 | $407B |
|
||
| Retail | 2 | $150B |
|
||
| Consumer Goods | 2 | $32B |
|
||
| Industrial Machinery | 2 | $6B |
|
||
| Agriculture | 1 | $40B |
|
||
| Healthcare / Medical Devices | 1 | $32B |
|
||
Price history
1 event — show timeline
- 2026-04-17 Listed $60,000 NORTHSTARMLS as Distributed by MLS Grid
Property tax history
+6.7%/yrLatest (2026): $351 · +17.2% YoY. Source: county tax records.
Cash-flow waterfall
monthlySold comps — $/sqft
last 12 mo · ≤1 miLoading sold comps…