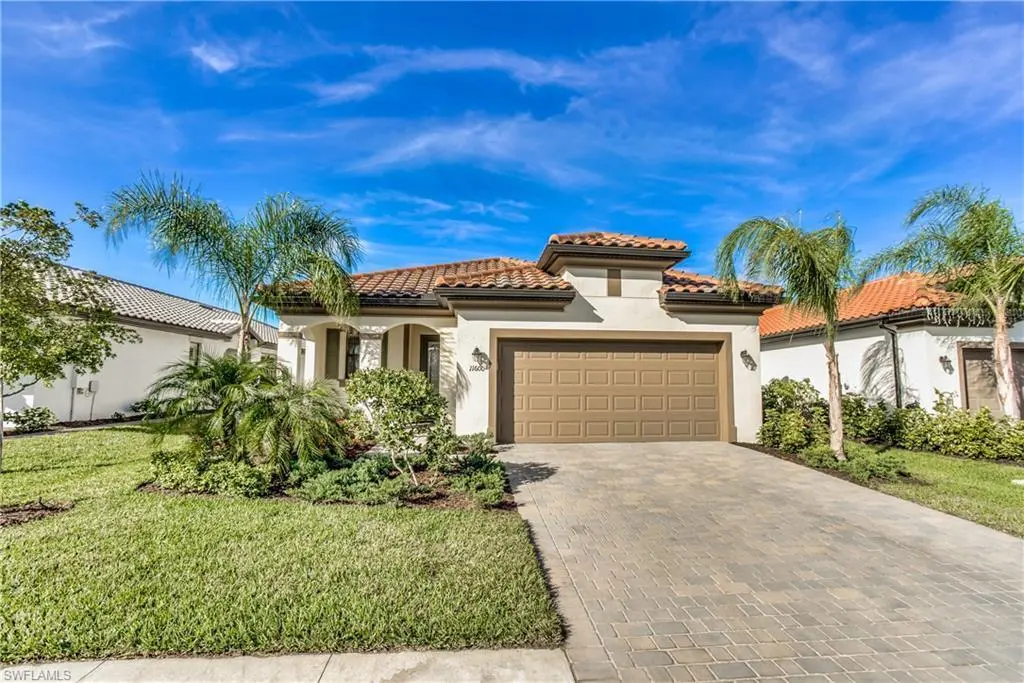
11600 Golden Oak Ter · Fort Myers, FL
Flood risk 1/10 · Minimal
- FEMA flood zone
- X (unshaded)
- Chance of flooding over 30 yrs
- 0.0%
- Est. flood insurance / yr
- $507 – $1,088
Fire risk 3/10 · Minor
- Est. fire insurance / yr
- $947 – $1,759
Heat risk 9/10 · Severe
- Hot days now (above 107°F)
- 7 days/yr
- Hot days in 30 yrs
- 27 days/yr
Wind risk 10/10 · Severe
- Chance of severe wind over 30 yrs
- 99.0%
Air-quality risk 2/10 · Minimal
- Unhealthy air days now
- 1 days/yr
- Unhealthy air days in 30 yrs
- 1 days/yr
Risk factors via First Street. Map © Google.
Why this score? — see what drove the C grade
The composite is a weighted blend of 9 inputs, each scored 0–100. Each bar is that input's sub-score; the figure is the points it added to the 100-point composite (weight × sub-score).
- Cash flow +16.4/30.0
- ARV discount +15.0/15.0
- 1% rule +6.6/10.0
- DSCR +5.1/10.0
- Livability +4.3/5.0
- Schools +4.1/10.0
- Rent growth +2.6/5.0
- Condition / age +2.5/5.0
- Appreciation +0.0/10.0
$419,000
🖨 Deal sheet 📄 Offer letter ✓ Due diligence
Listing remarks
Experience resort-style living every day in this furnished single-family home within a 5-star like community. Residents enjoy pool, clubhouse, pickleball and tennis courts, fitness center, numerous exercise classes and complimentary coffee room while the home itself features a spacious open floor plan with 2 bedrooms, 2 baths and a flex room. Large kitchen has granite countertops and walk-in pantry. Experience the outdoors on your own screened-in lanai or front porch. Conveniently located in this quiet community off the Treeline corridor with close access to RSW Airport, 2 Spring training ballparks and numerous shopping and dining. Wifi is included in maintenance fees.
Key facts
- Fitness center
- Clubhouse
- Pickleball
Tags
Property features AI
Finance
- Financial info: Pets allowed (conditional) — maximum 2
- HOA & community: Homeowners association (monthly fee); Association fee includes: association management, internet, irrigation water, legal/accounting, grounds maintenance, pest control, recreation facilities, reserve fund, street lights, security; Community amenities: clubhouse, fitness center, pool, tennis courts, pickleball, bocce court, library, media room, hobby room, restaurant, sidewalks; Community is gated with street lights; Community size: 837 units
Exterior
- Parking: Attached 2-car garage; Driveway; Paved parking; Garage door opener; Covered parking for 2 vehicles
- Security: Gated community with guard; Security gate; Security guard; Smoke detectors
- Utilities: Public water; Public sewer; Cable available; High speed internet available; Underground utilities; Municipal irrigation source
- Home design: Single-story; Entry level 1; East-facing; Has view; Resale property; Waterfront on a lake; Exposed to the west
- Construction: Built with block, concrete, and stucco; Tile roof
- Exterior features: Sprinkler/irrigation system (automatic); Patio; Room for pool; Shutters (manual); Lanai (open, screened); Porch; Open patio/porch; Community pool; Pond on lot; Rectangular lot; Private paved road frontage; Private maintained road
Interior
- Kitchen: Dishwasher; Freezer; Icemaker; Microwave; Range; Self-cleaning oven; Refrigerator; Refrigerator with ice maker; Disposal; Pantry; Breakfast bar
- Bedrooms: Main level primary bedroom
- Flooring: Carpet; Tile
- Bathrooms: 2 full bathrooms; Dual sinks; Separate shower (shower only)
- Heating & cooling: Central heating (electric); Central air conditioning (electric); Ceiling fan(s)
- Interior features: Breakfast bar; Built-in features; Separate/formal dining room; Entrance foyer; High ceilings; Main level primary bedroom; Pantry; Dual sinks; Separate shower (shower only); Cable TV; Walk-in closets; Window treatments; High speed internet; Split bedrooms; Single-hung windows; Window coverings; Furnished
- Laundry & utility: Washer; Dryer; Inside laundry; Laundry tub
Neighborhood map
What this means for you Summary
Snapshot
- This is a 2-bed/2.0-bath single-family listed at $419k.
Deal economics
- At list price, monthly cash flow is $235 ($3k/yr) — positive.
- The deal already cash-flows at list — no discount required.
- Meets the 1% rule at list price ($5k rent vs $419k).
- Recommended offer: $369k (12.0% below list) — sets the bar for market timing.
- Cap rate 7.0% vs local median 3.0% in Fort Myers — top-decile yield for the area; either an underpriced asset or a hidden risk that comps aren't pricing in. Stress-test before assuming the spread holds.
Location & tenants
- Location reads 86/100 on livability (#14 in FL, #383 nationally) — a professional / high-income tenant draw. Strengths: amenities A+, commute A+, housing A+.
- Lee (suburban): math 47% / reading 50% proficiency, ranked #42 of 73 in FL (top 58%) — families likely to look elsewhere, expect single-tenant / working-renter base with shorter leases.
- Market conditions: Rents flat; 811 active listings in the ZIP; 40 comparable units currently listed for rent nearby; rentals at typical pace (median 24d on market — plan ~3-4 weeks tenant-placement turnaround); high-income renter base; 15,411 units permitted in Lee County in 2024 (4,686 in 5+ unit buildings).
- At $4,879/mo this rent would consume 53% of the median local household income ($110k/yr) (locally 276% of renters already pay >50% of income on rent) — very limited rent-growth headroom before tenants either downsize or default.
Forward outlook
- Local home prices are declining (-3.0%/yr); year-one equity from $3k of loan paydown is wiped out by about $13k of value loss. Plan a longer hold.
- Lee County population projected at +44% by 2050 — long-run rental-demand tailwind backs the buy-and-hold thesis.
Negotiation context
- It's been on market 144 days — a 12% lower offer ($369k) is reasonable based on typical stale-listing flexibility.
- 7 sale attempts since 9y ago; this cycle's ask is 16331% above the opening price — seller raised mid-cycle; expect resistance to lowballs.
- Current owner paid $260k; list at $419k implies a 61% gain — meaningful room to come down on a strong offer.
Risks & watch-outs
- Climate carrying-cost: severe wind risk, 99% chance of damaging wind over 30y; extreme-heat days projected 7→27/yr by 2055 (HVAC capex compounding) — expect insurance premiums to compound above CPI over the hold.
Questions for the listing agent
- It's been on market 144 days. Have you received any prior offers? Is the seller open to a 12% concession, seller financing, or rate buy-down credit?
- What does the HOA fee cover, when was the last increase, and are there any pending special assessments or reserve-fund shortfalls?
- Why hasn't it sold? Are there any deal-killer items the seller is aware of (foundation, flood, title, zoning, code violations)?
- Is there a deadline driving the sale (1031 exchange, divorce, estate, relocation)? That informs how much negotiation room exists.
- What's the average days-on-market for RENTAL listings here right now (not sales)? A rising rental-DOM trend means longer vacancies and softer asking-rent achievability than the comps imply.
- What's the recent tenant-quality profile in this submarket — average credit score on applications, eviction rate, late-payment / NSF rate, and stable-employment percentage? A property-management company in the area should have these aggregated.
- How much new for-sale + rental construction is in the pipeline within 1–3 miles? Heavy new supply typically softens prices + rents 12–24 months out; constrained supply supports both.
Investment metrics
- 1% rule
- 1.16% ✓
- Cap rate
- 6.97%
- Cash-on-cash
- 2.41%
- DSCR
- 1.11
- GRM
- 7.2
CMA / ARV
- ARV (on-the-fly)
- $561,680
- Comps found
- 7
Show comp detail 7 sales within ~0.75 mi
| Address | Dist | Beds/Ba | Sqft | Sold | Price | $/sf | Match |
|---|---|---|---|---|---|---|---|
| 11543 Golden Oak Ter | 0.13mi | 2/2.0 | 1,917 (+1%) | 1mo | $400,000 | $209 | 92 |
| 11897 Clifton Ter | 0.41mi | 3/2.0 (+1) | 1,862 (-2%) | 4mo | $550,000 | $295 | 68 |
| 11331 Merriweather Ct | 0.72mi | 3/2.0 (+1) | 1,912 (+0%) | 0mo | $680,000 | $356 | 60 |
| 11884 Bourke Pl | 0.34mi | 3/2.0 (+1) | 2,107 (+11%) | 15mo | $615,000 | $292 | 49 |
| 11277 Callaway Greens Dr | 0.53mi | 3/2.0 (+1) | 1,660 (-13%) | 3mo | $490,000 | $295 | 47 |
| 11872 Bourke Pl | 0.32mi | 3/2.0 (+1) | 2,107 (+11%) | 22mo | $670,000 | $318 | 44 |
| 12232 Sussex St | 0.69mi | 3/2.0 (+1) | 2,107 (+11%) | 15mo | $575,000 | $273 | 32 |
Match score weights: distance 35% · size 25% · config 20% · recency 20%. Top-matched comps best support the ARV.
Projected returns pro-forma
-3.0% appreciation · 0.37% rent growth · sell at horizon
- IRR
- -16.1%
- Equity multiple
- 0.45×
- Total profit
- $-64,972
- Equity at exit
- $62,474
- IRR
- -14.7%
- Equity multiple
- 0.28×
- Total profit
- $-84,153
- Equity at exit
- $36,227
Cash invested: $117,320 (down + closing). Projections, not guarantees.
Landlord ↔ Tenant lean methodology
- Overall (STATE)
- 87 Strongly Landlord-Friendly
- State Florida
- 87 Strongly Landlord-Friendly · R+3
- County
- — inherits STATE
- City
- — inherits STATE
ZIP-level market 33913
- Home prices YoY
- -10.3%
- Rents YoY
- 0.4%
- Active inventory
- 811
- Price-to-rent
- 7.2×
Monthly cashflow live
- Estimated rent
- $4,879 high interval (Pro) →
- Mortgage (P&I)
- −$2,197
- Tax from tax record
- −$684 /mo · $8,202/yr
- Insurance
- −$175
- HOA
- −$564
- Vacancy / Maint / Mgmt
- −$1,025
- Net cashflow
- $235
Break-even live
UW: 25.0% down · 7.5% · 30yr · 1.5% tax · 5.0% vac · 8.0% maint · 8.0% mgmt
Financing live
Cash to close
- Down payment
- $104,750
- Closing costs
- $12,570
- Reserves months
- —
- Total cash needed
- —
Loan-product check · same deal, 3 products live
Conventional
25% down · 7.5% · 30yr
- Down + closing
- —
- Monthly P&I
- —
- Monthly cashflow
- —
- DSCR
- —
- Eligible?
- —
Personal DTI + credit; lowest rate.
DSCR
20% down · 8.5% · 30yr
- Down + closing
- —
- Monthly P&I
- —
- Monthly cashflow
- —
- DSCR
- —
- Eligible?
- —
No personal income docs; deal must DSCR.
Hard money
10% down · 12.0% · 12mo
- Down + closing
- —
- Monthly P&I
- —
- Monthly cashflow
- —
- DSCR
- —
- Eligible?
- —
Short-term bridge; refi at stabilization.
Rent comps 40 comps
| Address | Beds | Baths | Sqft | Rent | $/sqft | DOM | Units | Dist |
|---|---|---|---|---|---|---|---|---|
| 11442 Tiverton Trce Fort Myers, FL | 3.0 | 2.0 | 2010 | $9,500 | $4.73 | 23d | 1 | 0.58mi |
| 11701 Avingston Ter Fort Myers, FL | 2.0 | 2.0 | 1553 | $5,500 | $3.54 | 14d | 1 | 0.61mi |
| 11343 Tiverton Trce Fort Myers, FL | 2.0 | 2.0 | 1685 | $4,000 | $2.37 | 3d | 1 | 0.70mi |
| 11012 Castlereagh St Fort Myers, FL | 3.0 | 3.0 | 2517 | $12,000 | $4.77 | 23d | 1 | 0.71mi |
| 12090 Summergate Cir #101 Fort Myers, FL | 3.0 | 2.0 | 1231 | $1,825 | $1.48 | 23d | 1 | 0.75mi |
| 10879 Rutherford Rd Fort Myers, FL | 2.0 | 2.0 | 1566 | $3,500 | $2.23 | 23d | 1 | 0.77mi |
| 11230 Suffield St Fort Myers, FL | 2.0 | 2.0 | 1560 | $8,500 | $5.45 | 23d | 1 | 0.77mi |
| 10952 Clarendon St Fort Myers, FL | 2.0 | 2.0 | 1582 | $4,000 | $2.53 | 23d | 1 | 0.85mi |
| 10820 Palazzo Way #203 Fort Myers, FL | 2.0 | 2.0 | 1235 | $5,400 | $4.37 | 23d | 1 | 0.89mi |
| 10900 Glenhurst St Fort Myers, FL | 2.0 | 2.0 | 1355 | $2,200 | $1.62 | 3d | 1 | 0.90mi |
| 10791 Palazzo Way #301 Fort Myers, FL | 2.0 | 2.0 | 1390 | $5,300 | $3.81 | 23d | 1 | 0.93mi |
| 11225 Lithgow Ln Fort Myers, FL | 2.0 | 2.0 | 2153 | $8,000 | $3.72 | 23d | 1 | 0.93mi |
| 10908 Clarendon St Fort Myers, FL | 3.0 | 2.0 | 1433 | $8,000 | $5.58 | 23d | 1 | 0.94mi |
| 10908 Clarendon St Fort Myers, FL | 3.0 | 2.0 | 1433 | $8,000 | $5.58 | 14d | 1 | 0.94mi |
| 11530 Villa Grand Fort Myers, FL | 3.0 | 2.0 | 1336 | $1,750 | $1.31 | 3d | 1 | 0.96mi |
| 10529 Casella Way #102 Fort Myers, FL | 3.0 | 2.0 | 1722 | $4,500 | $2.61 | 23d | 1 | 0.96mi |
| 12062 Via Lighthouse Ln Fort Myers, FL | 3.0 | 2.5 | 1879 | $1,995 | $1.06 | 3d | 1 | 1.00mi |
| 10520 Casella Way #101 Fort Myers, FL | 3.0 | 2.0 | 1722 | $7,000 | $4.07 | 23d | 1 | 1.02mi |
| 11571 Villa Grand #617 Fort Myers, FL | 3.0 | 2.0 | 1336 | $2,200 | $1.65 | 16d | 1 | 1.02mi |
| 12021 Brassie Cir #201 Fort Myers, FL | 3.0 | 2.0 | 2343 | $2,700 | $1.15 | 3d | 1 | 1.03mi |
| 10535 Carolina Willow Dr Fort Myers, FL | 3.0 | 2.0 | 1290 | $2,300 | $1.78 | 21d | 1 | 1.04mi |
| 10751 Palazzo Way #103 Fort Myers, FL | 2.0 | 2.0 | 1235 | $5,000 | $4.05 | 23d | 1 | 1.04mi |
| 12096 Ledgewood Cir Fort Myers, FL | 3.0 | 2.0 | 1798 | $2,850 | $1.59 | 23d | 1 | 1.04mi |
| 10711 Palazzo Way Unit 203 Fort Myers, FL | 2.0 | 2.0 | 1257 | $5,300 | $4.22 | 21d | 1 | 1.09mi |
| 10711 Palazzo Way Fort Myers, FL | 2.0 | 2.0 | 1257 | $3,900 | $3.10 | 16d | 2 | 1.09mi |
| 11619 Meadowrun Cir Fort Myers, FL | 3.0 | 2.5 | 2242 | $2,495 | $1.11 | 23d | 1 | 1.10mi |
| 11801 Pine Timber Ln Fort Myers, FL | 3.0 | 2.5 | 2508 | $8,000 | $3.19 | 23d | 1 | 1.13mi |
| 10700 Palazzo Way #201 Fort Myers, FL | 2.0 | 2.0 | 1390 | $5,000 | $3.60 | 21d | 1 | 1.16mi |
| 10455 Casella Way #202 Fort Myers, FL | 3.0 | 2.0 | 2319 | $7,200 | $3.10 | 23d | 1 | 1.17mi |
| 12300 Professional Park Dr Fort Myers, FL | 1.0–3.0 | 1.0–2.0 | 1058 | $1,945 | $1.84 | 23d | 25 | 1.19mi |
| 10271 Glastonbury Cir #102 Fort Myers, FL | 2.0 | 2.0 | 1550 | $4,500 | $2.90 | 23d | 1 | 1.24mi |
| 12016 Five Waters Cir Fort Myers, FL | 3.0 | 2.0 | 1646 | $4,500 | $2.73 | 23d | 1 | 1.27mi |
| 12525 Astor Pl Unit 1049698P Fort Myers, FL | 3.0 | 2.0 | 2174 | $6,065 | $2.79 | 14d | 1 | 1.29mi |
| 12171 Treeline Ave Fort Myers, FL | 1.0–3.0 | 1.0–2.0 | 1321 | $2,606 | $1.97 | 3d | 23 | 1.35mi |
| 11900 Grosseto Ct Fort Myers, FL | 2.0 | 2.0 | 1713 | $5,500 | $3.21 | 23d | 1 | 1.36mi |
| 11900 Grosseto Ct Fort Myers, FL | 2.0 | 2.0 | 1713 | $6,000 | $3.50 | 19d | 1 | 1.36mi |
| 10284 Livorno Dr Fort Myers, FL | 3.0 | 3.0 | 2202 | $7,000 | $3.18 | 3d | 1 | 1.38mi |
| 12482 Kentwood Ave Fort Myers, FL | 3.0 | 2.5 | 2251 | $4,900 | $2.18 | 19d | 1 | 1.38mi |
| 11170 Lakeland Cir Fort Myers, FL | 3.0 | 2.0 | 1571 | $1,975 | $1.26 | 14d | 1 | 1.42mi |
| 11541 Stonecreek Cir Fort Myers, FL | 3.0 | 3.0 | 2147 | $3,300 | $1.54 | 23d | 1 | 1.42mi |
HOA detail
- Monthly dues
- $564 · $6,768/yr
- Likely covers
- internetpoolgym
Listing history 40 events
-
2026-06-17days on market $419,000 Active 144 DOM
-
2026-06-16days on market $419,000 Active 143 DOM
-
2026-06-15days on market $419,000 Active 142 DOM
-
2026-06-13days on market $419,000 Active 140 DOM
-
2026-06-10days on market $419,000 Active 137 DOM
-
2026-06-09days on market $419,000 Active 136 DOM
-
2026-06-07days on market $419,000 Active 134 DOM
-
2026-06-02days on market $419,000 Active 129 DOM
-
2026-06-01days on market $419,000 Active 128 DOM
-
2026-06-01days on market $419,000 Active 127 DOM
-
2026-05-24price $419,000
-
2026-04-30price $2,450
-
2026-04-16price $424,900
-
2026-04-08$2,550
-
2026-04-07price $429,000
-
2026-03-21price $434,000
-
2026-01-24$438,500 Active
-
2025-04-27historical
-
2025-04-06price $448,900
-
2025-03-27$457,900 Active
-
2025-03-21historical
-
2025-02-28price $457,900
-
2025-02-28price $458,000
-
2025-02-14price $469,000
-
2025-01-24price $474,500
-
2024-11-12price $479,000
-
2024-09-18$489,000 Active
-
2019-04-03soldstatus $260,000
-
2019-03-29soldstatus $260,000 Sold
-
2019-02-18status Pending
-
2019-02-09status Pending With Contingencies
-
2019-01-05price $269,900
-
2018-12-13price $279,900
-
2018-12-08$299,000 Active
-
2018-03-28soldstatus $270,000
-
2018-03-27soldstatus $270,000 Sold
-
2018-01-29status Pending With Contingencies
-
2018-01-04$284,000 Active
-
2017-10-20soldstatus $275,496 Sold
-
2017-08-21$260,497 Active
ⓘ Source: listings_history table (triggers on properties + properties_extension) + one-shot
backfill from property_details.listing_events for pre-trigger history.
Tax reassessment forecast FL · Resets to sale price
- Current annual tax
- $8,202 · $684/mo
- Projected year-2 tax
- $8,202 · $684/mo
- Expected delta
- $0/yr ($0/mo · 0.0%)
ⓘ Screening estimate from a state-policy table — verify with the county assessor before closing.
Climate risk First Street
- Flood 1/10 Low FEMA zone X (unshaded) · 0% chance over 30 yrs
- Wildfire 3/10 Moderate
- Heat 9/10 Extreme 7 d/yr ≥107°F today · 27 d/yr by 30 yrs out
- Wind 10/10 Extreme 99% chance of damaging wind over 30 yrs
- Air quality 2/10 Low 1 unhealthy d/yr today · 1 by 30 yrs out
Nearby sold comps map
Loading sold comps map…
Walkable amenities ~0.75 mi
Loading nearby amenities…
Taxation est. · year 1
- Rental income
- $58,552
- − Mortgage interest
- −$23,471
- − Property taxes
- −$8,202
- − Insurance
- −$2,095
- − Repairs & maintenance
- −$4,684
- − Management
- −$4,684
- − HOA
- −$6,768
- − Depreciation
- −$12,189
- Taxable loss
- −$3,541
- Est. tax savings @ 24.0%
- +$850
- After-tax cash flow
- $3,673/yr
For passive investors: Depreciation is non-cash, so a rental often shows a tax loss while cash-flowing — sheltering income. Rental losses are passive: they offset passive income freely, and up to $25,000/yr can offset ordinary (W-2) income if you actively participate and your MAGI is under $100k (phasing out to $0 by $150k); unused losses carry forward. On sale, claimed depreciation is recaptured at up to 25%, and gains may owe capital-gains tax (a 1031 exchange can defer both). Figures are a year-1 estimate at your 24.0% rate — not tax advice; consult a CPA.
Schools (NCES district)
- District
- Lee
- NCES district ID
- 1201080
- Math proficiency
- 47% ▼ -11.00%
- Reading proficiency
- 50% ▼ -4.00%
- Median HH income
- $49,518
- Composite
- 41.49/100
- National rank
- #3458
- State rank
- #42 of 73 in FL
Livability — Fort Myers
- Score
- 86/100
- State rank
- #14
- US rank
- #383
Category grades
Schools grade is shown separately in the Schools card above.
Census & demographics
- Census place
- Fort Myers, FL
- County
- Lee County · 788,662 people
- City population
- 278,598
- Metro
- Cape Coral-Fort Myers, FL
- Population (ZIP)
- 31,538
- Household income
- $110,373
- Rent vs Own
- Severe rent burden
- 276.0
Population outlook (Lee County) Hauer SSP2
- Today (2025)
- 871,946 people
- By 2030
- 955,468 · +9.6%
- By 2040
- 1,113,587 · +27.7%
- By 2050
- 1,256,891 · +44.1%
- By 2075
- 1,560,270 · +78.9%
- By 2100
- 1,726,848 · +98.0%
Race, ethnicity, and origin ACS 2023
- Neighborhood character
- Predominantly White (74%)
- Race & ethnicity
- White 74% Hispanic / Latino 13% Two or more races 11% Black 5% Asian 2%
- Hispanic origin (detail)
- Mexican 3% Puerto Rican 3% Cuban 2%
- Common ancestry
- Romanian 5% Lithuanian 3% Slovak 2%
- Foreign-born
- 14% · Canada, Vietnam, China
- Languages at home
- 84% English-only · Spanish 10% Other Indo-European 2% French/Haitian/Cajun 2%
Political lean MEDSL · Lee
- 2024 margin
- Strong R (+28.4) · D 35.5% · R 63.9%
- 2008→2024 swing
- -18.0pp toward R · 2008: -10.4pp · 2024: -28.4pp
- All cycles
- 2024: R+28.4 2020: R+19.2 2016: R+20.4 2012: R+16.6 2008: R+10.4
Not yet ingested
- Civics
- —
Market trends
- HPI YoY
- ▼ -25.45%
- Current HPI
- 221.7115
- Rent YoY
- ▲ 0.37%
- Metro
- Cape Coral-Fort Myers, FL
- State GDP YoY
- ▲ 3.28%
- F500 in state
- 36
Industry mix (Fortune 500 HQ in FL)
| Industry | F500 HQs | Revenue |
|---|---|---|
| Industrial Technology | 2 | $29B |
|
||
| Insurance | 2 | $17B |
|
||
| Retail | 1 | $60B |
|
||
| Technology Distribution | 1 | $58B |
|
||
| Homebuilding | 1 | $35B |
|
||
| Technology Manufacturing | 1 | $35B |
|
||
Price history
+60.8% since first listed30 events — show timeline
- 2026-05-24 Price Changed $419,000 FORTMLS
- 2026-04-30 Price Changed $2,450 NAPLESMLS
- 2026-04-16 Price Changed $424,900 FORTMLS
- 2026-04-08 Listed for Rent $2,550 NAPLESMLS
- 2026-04-07 Price Changed $429,000 FORTMLS
- 2026-03-21 Price Changed $434,000 FORTMLS
- 2026-01-24 Listed $438,500 FORTMLS
- 2025-04-27 Listing Removed — FORTMLS
- 2025-04-06 Price Changed $448,900 FORTMLS
- 2025-03-27 Listed $457,900 FORTMLS
- 2025-03-21 Listing Removed — FORTMLS
- 2025-02-28 Price Changed $457,900 FORTMLS
- 2025-02-28 Price Changed $458,000 FORTMLS
- 2025-02-14 Price Changed $469,000 FORTMLS
- 2025-01-24 Price Changed $474,500 FORTMLS
- 2024-11-12 Price Changed $479,000 FORTMLS
- 2024-09-18 Listed $489,000 FORTMLS
- 2019-04-03 Sold (Public Records) $260,000 Public Records
- 2019-03-29 Sold (MLS) $260,000 FORTMLS
- 2019-02-18 Pending — FORTMLS
- 2019-02-09 Pending — FORTMLS
- 2019-01-05 Price Changed $269,900 FORTMLS
- 2018-12-13 Price Changed $279,900 FORTMLS
- 2018-12-08 Listed $299,000 FORTMLS
- 2018-03-28 Sold (Public Records) $270,000 Public Records
- 2018-03-27 Sold (MLS) $270,000 NAPLESMLS
- 2018-01-29 Pending — NAPLESMLS
- 2018-01-04 Listed $284,000 NAPLESMLS
- 2017-10-20 Sold (MLS) $275,496 NAPLESMLS
- 2017-08-21 Listed $260,497 NAPLESMLS
Property tax history
+21.2%/yrLatest (2025): $8,202 · +54.3% YoY. Source: county tax records.
Cash-flow waterfall
monthlySold comps — $/sqft
last 12 mo · ≤1 miLoading sold comps…