490 N Patuxent Rd #50 · Odenton, MD
Flood risk No data
- FEMA flood zone
- —
- Chance of flooding over 30 yrs
- —
- Est. flood insurance / yr
- —
Fire risk No data
- Est. fire insurance / yr
- —
Heat risk No data
- Hot days now (above threshold)
- —
- Hot days in 30 yrs
- —
Wind risk No data
- Chance of severe wind over 30 yrs
- —
Air-quality risk No data
- Unhealthy air days now
- —
- Unhealthy air days in 30 yrs
- —
Risk factors via First Street. Map © Google.
Why this score? — see what drove the B grade
The composite is a weighted blend of 9 inputs, each scored 0–100. Each bar is that input's sub-score; the figure is the points it added to the 100-point composite (weight × sub-score).
- Cash flow +30.0/30.0
- 1% rule +10.0/10.0
- DSCR +10.0/10.0
- ARV discount +8.2/15.0
- Livability +3.5/5.0
- Rent growth +3.0/5.0
- Schools +2.9/10.0
- Condition / age +2.5/5.0
- Appreciation +0.0/10.0
$141,900
🖨 Deal sheet 📄 Offer letter ✓ Due diligence
Listing remarks MLS
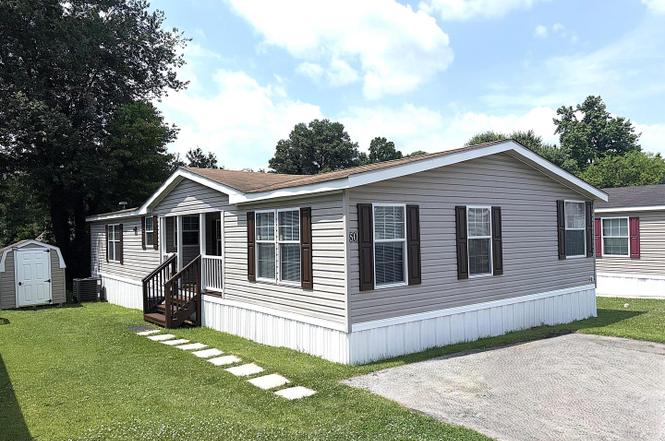
Welcome to this spacious, manufactured ranch-style home located in Odenton conveniently located to the Marc Train and Piney Orchard. This spacious residence offers three bedrooms and two full bathrooms, providing plenty of room to relax and entertain. The oversized kitchen features lots of cabinets for storage and an island for additional counter space. Enjoy the comfort of central air conditioning and a recently updated HVAC (2023), ensuring year-round comfort. The home features and an open floor plan that enhances the flow between the living, dining, and kitchen areas. The primary bedroom is located at the front of the property while the two additional bedrooms are tucked away at the rear of the home. The laundry room has access to the small rear deck for accessibility to rear yard space. The covered front deck is a great place to escape from the rain. Conveniently located near local amenities, parks, and major commuter routes, this home offers both comfort and convenience. Buyer(s) must be approved by Arundel Mobile Village in order to purchase a home in this community. Community has pet size/type restrictions. Ask the community for additional information. Buyers are encouraged to seek community approval prior to making an offer.
Key facts
- Bonus office nook
- Big kitchen
- Separate shower
Tags
Property features AI
Finance
- Other: Ownership interest: Land lease; Pets allowed with breed and size/weight restrictions; Property condition: Very good
- HOA & community: Land lease: $999 monthly; Land lease years remaining: 100; Park: Arundel Mobile Village
Exterior
- Parking: Driveway parking (2 spaces); Total 2 garage/parking spaces
- Utilities: Community water; Community septic tank; Electric service
- Home design: Manufactured double-wide (Fleetwood); Estimated year built; Above grade living area; Land lease community (land lease monthly)
- Construction: Vinyl siding; Shingle roof; Double pane, vinyl-clad windows; Above-grade structure
- Exterior features: Porch(es); Sidewalks; Backs to trees; Shed
Interior
- Kitchen: Refrigerator; Gas range / oven; Dishwasher; Built-in microwave
- Bedrooms: 3 bedrooms on the main level
- Flooring: Carpet; Vinyl
- Bathrooms: 2 full bathrooms (main level)
- Heating & cooling: Forced air heating; Propane (leased) heating fuel; Central air conditioning; Ceiling fans; Electric hot water
- Interior features: Open floor plan; Dining area; Kitchen island; Country-style kitchen; Crown moldings; Ceiling fans; Cathedral ceilings; Soaking tub; Stall shower; Tub/shower combo; Walk-in closet(s)
- Laundry & utility: Washer; Dryer
Neighborhood map
What this means for you Summary
Snapshot
- This is a 3-bed/2.0-bath single-family listed at $142k.
Deal economics
- At list price, monthly cash flow is $1k ($13k/yr) — positive.
- The deal already cash-flows at list — no discount required.
- Meets the 1% rule at list price ($3k rent vs $142k).
- Cap rate 15.3% vs local median 3.9% in Odenton — top-decile yield for the area; either an underpriced asset or a hidden risk that comps aren't pricing in. Stress-test before assuming the spread holds.
Location & tenants
- Location reads 70/100 on livability (#161 in MD) — a middle-class / working-renter tenant base. Strengths: employment A+, housing A+; Watch: crime C-, amenities F, commute F.
- Anne Arundel County Public Schools (suburban): math 20% / reading 37% proficiency, ranked #10 of 24 in MD (top 42%) — low school quality limits family demand, transient renter base, plan for 1-2y turnover.
- Market conditions: Rents rising (+2.0%/yr); 153 active listings in the ZIP; 32 comparable units currently listed for rent nearby; rentals at typical pace (median 18d on market — plan ~3-4 weeks tenant-placement turnaround); high-income renter base; 1,303 units permitted in Anne Arundel County in 2024 (299 in 5+ unit buildings).
Forward outlook
- Local home prices are declining (-3.0%/yr); year-one equity from $981 of loan paydown is wiped out by about $4k of value loss. Plan a longer hold.
- Anne Arundel County population projected at +17% by 2050 — long-run rental-demand tailwind backs the buy-and-hold thesis.
- At projected returns (-3.0% appreciation + 2.0% rent growth), your $40k cash investment doubles in ~4 years — after that, you're playing with house money.
Negotiation context
- Only 1 days on market — expect competitive offers; lowballing is unlikely to land.
- 4 sale attempts since 3y ago with the ask held roughly flat each time — persistent listings suggest the price (not the market) is what's stuck; bring a comps-based counter.
- Current owner paid $109k; 30% above their basis — modest negotiation headroom, anchor on the comps not their cost.
Questions for the listing agent
- Is there a deadline driving the sale (1031 exchange, divorce, estate, relocation)? That informs how much negotiation room exists.
- Schools are B-rated — typically a magnet for longer-tenancy family renters. What's the average tenant stay here, and is there a school-zone premium baked into asking?
- What's the average days-on-market for RENTAL listings here right now (not sales)? A rising rental-DOM trend means longer vacancies and softer asking-rent achievability than the comps imply.
- What's the recent tenant-quality profile in this submarket — average credit score on applications, eviction rate, late-payment / NSF rate, and stable-employment percentage? A property-management company in the area should have these aggregated.
- How much new for-sale + rental construction is in the pipeline within 1–3 miles? Heavy new supply typically softens prices + rents 12–24 months out; constrained supply supports both.
Investment metrics
- 1% rule
- 1.83% ✓
- Cap rate
- 15.34%
- Cash-on-cash
- 32.30%
- DSCR
- 2.44
- GRM
- 4.6
CMA / ARV
- ARV (on-the-fly)
- $144,000
- Comps found
- 12
Show comp detail 12 sales within ~0.75 mi
| Address | Dist | Beds/Ba | Sqft | Sold | Price | $/sf | Match |
|---|---|---|---|---|---|---|---|
| 488 N Patuxent Unit 19A | 0.05mi | 3/2.0 | 1,525 (+2%) | 3mo | $120,000 | $79 | 93 |
| 490 N Patuxent Rd #51 | 0.07mi | 3/2.0 | 1,560 (+4%) | 7mo | $144,900 | $93 | 84 |
| 490 Patuxent Rd N #50 | 0.00mi | 3/2.0 | 1,590 (+6%) | 9mo | $109,000 | $69 | 82 |
| 488 N Patuxent Rd #9 | 0.06mi | 4/2.0 (+1) | 1,440 (-4%) | 9mo | $134,900 | $94 | 78 |
| 490 N Patuxent Rd #29 | 0.00mi | 3/2.0 | 1,568 (+4%) | 22mo | $95,000 | $61 | 74 |
| 488 N Patuxent Rd #4 | 0.06mi | 3/2.0 | 1,700 (+13%) | 13mo | $147,900 | $87 | 64 |
| 529 Rita Dr | 0.44mi | 3/1.0 | 1,462 (-2%) | 10mo | $449,900 | $308 | 63 |
| 510 Rita Dr | 0.45mi | 4/1.5 (+1) | 1,462 (-2%) | 10mo | $365,000 | $250 | 59 |
| 490 N Patuxent Rd #4 | 0.05mi | 3/2.0 | 1,296 (-14%) | 19mo | $124,250 | $96 | 59 |
| 1245 Baliol Ln | 0.63mi | 3/2.0 | 1,458 (-3%) | 11mo | $455,000 | $312 | 57 |
| 495 Rita Dr | 0.53mi | 3/1.5 | 1,462 (-2%) | 23mo | $420,000 | $287 | 50 |
| 1309 Odenton Rd | 0.52mi | 4/2.0 (+1) | 1,547 (+3%) | 23mo | $425,000 | $275 | 47 |
Match score weights: distance 35% · size 25% · config 20% · recency 20%. Top-matched comps best support the ARV.
Projected returns pro-forma
-3.0% appreciation · 1.98% rent growth · sell at horizon
- IRR
- 26.2%
- Equity multiple
- 2.07×
- Total profit
- $42,515
- Equity at exit
- $21,158
- IRR
- 33.2%
- Equity multiple
- 3.88×
- Total profit
- $114,280
- Equity at exit
- $12,269
Cash invested: $39,732 (down + closing). Projections, not guarantees.
Landlord ↔ Tenant lean methodology
- Overall (STATE)
- 27 Tenant-Leaning
- State Maryland
- 27 Tenant-Leaning · D+14
- County
- — inherits STATE
- City
- — inherits STATE
ZIP-level market 21113
- Home prices YoY
- -24.3%
- Rents YoY
- 2.0%
- Active inventory
- 153
- Price-to-rent
- 4.6×
Monthly cashflow live
- Estimated rent
- $2,595 high interval (Pro) →
- Mortgage (P&I)
- −$744
- Tax est. 1.5%
- −$177 /mo · $2,128/yr
- Insurance
- −$59
- HOA
- −$0
- Vacancy / Maint / Mgmt
- −$545
- Net cashflow
- $1,069
Break-even live
UW: 25.0% down · 7.5% · 30yr · 1.5% tax · 5.0% vac · 8.0% maint · 8.0% mgmt
Financing live
Cash to close
- Down payment
- $35,475
- Closing costs
- $4,257
- Reserves months
- —
- Total cash needed
- —
Loan-product check · same deal, 3 products live
Conventional
25% down · 7.5% · 30yr
- Down + closing
- —
- Monthly P&I
- —
- Monthly cashflow
- —
- DSCR
- —
- Eligible?
- —
Personal DTI + credit; lowest rate.
DSCR
20% down · 8.5% · 30yr
- Down + closing
- —
- Monthly P&I
- —
- Monthly cashflow
- —
- DSCR
- —
- Eligible?
- —
No personal income docs; deal must DSCR.
Hard money
10% down · 12.0% · 12mo
- Down + closing
- —
- Monthly P&I
- —
- Monthly cashflow
- —
- DSCR
- —
- Eligible?
- —
Short-term bridge; refi at stabilization.
Rent comps 32 comps
| Address | Beds | Baths | Sqft | Rent | $/sqft | DOM | Units | Dist |
|---|---|---|---|---|---|---|---|---|
| 661 Realm Ct W Odenton, MD | 2.0 | 2.5 | 1490 | $2,250 | $1.51 | 23d | 1 | 0.09mi |
| 659 Realm Ct W Odenton, MD | 3.0 | 1.5 | 1600 | $2,400 | $1.50 | 23d | 1 | 0.09mi |
| 511 Kingdom Ct Odenton, MD | 3.0 | 2.5 | 1610 | $2,399 | $1.49 | 4d | 1 | 0.20mi |
| 1415 Duckens St Odenton, MD | 1.0–2.0 | 1.0–2.0 | 1021 | $2,490 | $2.44 | 3d | 10 | 0.61mi |
| 2419 Warm Spring Way Odenton, MD | 3.0 | 2.5 | 1613 | $2,650 | $1.64 | 21d | 1 | 0.64mi |
| 2448 Winding Ridge Rd Odenton, MD | 3.0 | 3.5 | 1996 | $2,900 | $1.45 | 17d | 1 | 0.83mi |
| 2406 Forest Edge Ct #102 Odenton, MD | 3.0 | 2.0 | 1263 | $2,500 | $1.98 | 23d | 1 | 0.89mi |
| 2408 Autumn Harvest Ct Odenton, MD | 2.0 | 2.0 | 1199 | $2,250 | $1.88 | 17d | 1 | 0.91mi |
| 8745 Bright Meadow Ct Odenton, MD | 3.0 | 2.5 | 1430 | $2,650 | $1.85 | 23d | 1 | 0.93mi |
| 701 Harvest Run Dr #101 Odenton, MD | 2.0 | 2.0 | 1107 | $2,200 | $1.99 | 43d | 1 | 0.94mi |
| 2404 Ash Grove Ln Odenton, MD | 1.0–2.0 | 1.0–2.0 | 902 | $2,430 | $2.69 | 1d | 17 | 0.97mi |
| 703 Horse Chestnut Ct Odenton, MD | 3.0 | 2.5 | 1720 | $2,800 | $1.63 | 43d | 1 | 1.11mi |
| 8313 Telegraph Rd Odenton, MD | 1.0–2.0 | 1.0–2.0 | 995 | $2,787 | $2.80 | 1d | 16 | 1.13mi |
| 812 Vacation Dr Odenton, MD | 4.0 | 2.0 | 1760 | $3,500 | $1.99 | 43d | 1 | 1.20mi |
| 8629 Willow Leaf Ln Odenton, MD | 2.0 | 2.0 | 1332 | $2,395 | $1.80 | 43d | 1 | 1.20mi |
| 2452 Apple Blossom Ln #103 Odenton, MD | 2.0 | 2.0 | 1197 | $2,400 | $2.01 | 17d | 1 | 1.21mi |
| 8617 Willow Leaf Ln Odenton, MD | 2.0 | 2.0 | 1422 | $2,300 | $1.62 | 3d | 1 | 1.21mi |
| 700 Orchard Overlook #203 Odenton, MD | 2.0 | 2.0 | 1178 | $2,400 | $2.04 | 2d | 1 | 1.27mi |
| 700 Orchard Overlook #203 Odenton, MD | 2.0 | 2.0 | 1178 | $2,400 | $2.04 | 4d | 1 | 1.27mi |
| 2441 Blue Spring Ct #103 Odenton, MD | 2.0 | 2.0 | 1195 | $2,200 | $1.84 | 17d | 1 | 1.29mi |
| 2027 Odens Station Ln Odenton, MD | 1.0–3.0 | 1.0–2.0 | 1035 | $3,015 | $2.91 | 1d | 49 | 1.29mi |
| 537 Tranquil Ct Odenton, MD | 1.0–3.0 | 1.0–2.0 | 892 | $2,415 | $2.71 | 1d | 18 | 1.30mi |
| 2640 Summer Breeze Ct Odenton, MD | 3.0 | 3.5 | 1890 | $3,000 | $1.59 | 43d | 1 | 1.30mi |
| 2005 Town Center Blvd Odenton, MD | 1.0–2.0 | 1.0–2.0 | 848 | $2,925 | $3.45 | 2d | 15 | 1.32mi |
| 300 Gatehouse Ln Odenton, MD | 1.0–3.0 | 1.0–3.0 | 1045 | $2,759 | $2.64 | 2d | 43 | 1.39mi |
| 308 Assembly Point Ct Odenton, MD | 3.0 | 2.0 | 1672 | $2,700 | $1.61 | 23d | 1 | 1.40mi |
| 2008 Thornbrook Way Odenton, MD | 3.0 | 2.5 | 2120 | $3,150 | $1.49 | 10d | 1 | 1.40mi |
| 2014 Crosbyside Ct Odenton, MD | 3.0 | 2.5 | 1609 | $2,700 | $1.68 | 43d | 1 | 1.41mi |
| 8727 Thornbrook Dr Odenton, MD | 4.0 | 3.5 | 2136 | $3,100 | $1.45 | 43d | 1 | 1.42mi |
| 315 Eagles Landing Ct Odenton, MD | 2.0 | 2.0 | 1156 | $2,250 | $1.95 | 43d | 1 | 1.44mi |
| 1806 Kellington Ct Odenton, MD | 3.0 | 2.5 | 2184 | $3,250 | $1.49 | 12d | 1 | 1.45mi |
| 1934 Hackberry Ct Odenton, MD | 3.0 | 2.5 | 1612 | $2,700 | $1.67 | 23d | 1 | 1.45mi |
Listing history 2 events
-
2026-06-19remarks 699-char remark
-
2026-06-19$141,900 Active 1 DOM
ⓘ Source: listings_history table (triggers on properties + properties_extension) + one-shot
backfill from property_details.listing_events for pre-trigger history.
Nearby sold comps map
Loading sold comps map…
Walkable amenities ~0.75 mi
Loading nearby amenities…
Taxation est. · year 1
- Rental income
- $31,139
- − Mortgage interest
- −$7,949
- − Property taxes
- −$2,128
- − Insurance
- −$710
- − Repairs & maintenance
- −$2,491
- − Management
- −$2,491
- − Depreciation
- −$4,128
- Taxable income
- $11,242
- Est. tax owed @ 24.0%
- −$2,698
- After-tax cash flow
- $10,134/yr
For passive investors: Depreciation is non-cash, so a rental often shows a tax loss while cash-flowing — sheltering income. Rental losses are passive: they offset passive income freely, and up to $25,000/yr can offset ordinary (W-2) income if you actively participate and your MAGI is under $100k (phasing out to $0 by $150k); unused losses carry forward. On sale, claimed depreciation is recaptured at up to 25%, and gains may owe capital-gains tax (a 1031 exchange can defer both). Figures are a year-1 estimate at your 24.0% rate — not tax advice; consult a CPA.
Schools (NCES district)
- District
- Anne Arundel County Public Schools
- NCES district ID
- 2400060
- Math proficiency
- 20% ▼ -21.00%
- Reading proficiency
- 37% ▼ -13.00%
- Median HH income
- $87,880
- Composite
- 28.52/100
- National rank
- #6733
- State rank
- #10 of 24 in MD
Livability — Odenton
- Score
- 70/100
- State rank
- #161
- US rank
- #7349
Category grades
Schools grade is shown separately in the Schools card above.
Census & demographics
- Census place
- Odenton, MD
- County
- Anne Arundel County · 535,653 people
- City population
- 36,705
- Metro
- Baltimore-Columbia-Towson, MD
- Population (ZIP)
- 36,705
- Household income
- $125,639
- Rent vs Own
- Severe rent burden
- 1190.0
Population outlook (Anne Arundel County) Hauer SSP2
- Today (2025)
- 617,384 people
- By 2030
- 642,094 · +4.0%
- By 2040
- 686,621 · +11.2%
- By 2050
- 723,031 · +17.1%
- By 2075
- 809,346 · +31.1%
- By 2100
- 837,658 · +35.7%
Race, ethnicity, and origin ACS 2023
- Neighborhood character
- Diverse neighborhood (Simpson 0.68)
- Race & ethnicity
- White 46% Black 29% Two or more races 11% Hispanic / Latino 11% Asian 5%
- Hispanic origin (detail)
- Mexican 2% Puerto Rican 4%
- Common ancestry
- Romanian 3% Lithuanian 2% Slovak 1%
- Foreign-born
- 11% · Canada, South Korea, China
- Languages at home
- 83% English-only · Spanish 7% Other Indo-European 2% Chinese 1%
Political lean MEDSL · Anne Arundel
- 2024 margin
- D (+13.9) · D 55.7% · R 41.7% · Other 2.6%
- 2008→2024 swing
- +15.7pp toward D · 2008: -1.8pp · 2024: 13.9pp
- All cycles
- 2024: D+13.9 2020: D+14.5 2016: D+0.7 2012: R+0.9 2008: R+1.8
Not yet ingested
- Civics
- —
Market trends
- HPI YoY
- ▼ -87.76%
- Current HPI
- 273.3267
- Rent YoY
- ▲ 1.98%
- Metro
- Baltimore-Columbia-Towson, MD
- State GDP YoY
- ▲ 2.97%
- F500 in state
- 12
Industry mix (Fortune 500 HQ in MD)
| Industry | F500 HQs | Revenue |
|---|---|---|
| Aerospace / Defense | 1 | $71B |
|
||
| Utilities | 1 | $25B |
|
||
| Hotels | 1 | $24B |
|
||
| Consumer Goods | 1 | $7B |
|
||
| Real Estate | 1 | $6B |
|
||
| Chemicals | 1 | $2B |
|
||
Price history
+57.7% since first listed12 events — show timeline
- 2026-06-18 Listed $141,900 BRIGHT MLS
- 2025-09-19 Sold (MLS) $109,000 BRIGHT MLS
- 2025-08-08 Contingent — BRIGHT MLS
- 2025-07-02 Price Changed $109,000 BRIGHT MLS
- 2025-06-18 Relisted — BRIGHT MLS
- 2025-05-19 Pending — BRIGHT MLS
- 2025-05-02 Listed $115,000 BRIGHT MLS
- 2025-04-25 Coming Soon $115,000 BRIGHT MLS
- 2023-04-29 Sold (MLS) $83,000 BRIGHT MLS
- 2023-04-10 Contingent — BRIGHT MLS
- 2023-03-10 Listing Removed — BRIGHT MLS
- 2023-03-10 Listed $90,000 BRIGHT MLS
Cash-flow waterfall
monthlySold comps — $/sqft
last 12 mo · ≤1 miLoading sold comps…