3725 Carol O'ferrell Ct · Greensboro, NC
Flood risk No data
- FEMA flood zone
- —
- Chance of flooding over 30 yrs
- —
- Est. flood insurance / yr
- —
Fire risk No data
- Est. fire insurance / yr
- —
Heat risk No data
- Hot days now (above threshold)
- —
- Hot days in 30 yrs
- —
Wind risk No data
- Chance of severe wind over 30 yrs
- —
Air-quality risk No data
- Unhealthy air days now
- —
- Unhealthy air days in 30 yrs
- —
Risk factors via First Street. Map © Google.
Why this score? — see what drove the D grade
The composite is a weighted blend of 9 inputs, each scored 0–100. Each bar is that input's sub-score; the figure is the points it added to the 100-point composite (weight × sub-score).
- Cash flow +10.7/30.0
- ARV discount +8.7/15.0
- Condition / age +5.0/5.0
- Livability +4.0/5.0
- Schools +3.6/10.0
- Rent growth +3.5/5.0
- 1% rule +3.2/10.0
- DSCR +3.1/10.0
- Appreciation +0.0/10.0
$274,900
🖨 Deal sheet (PDF) 📄 Offer letter ✓ Due diligence
Listing remarks
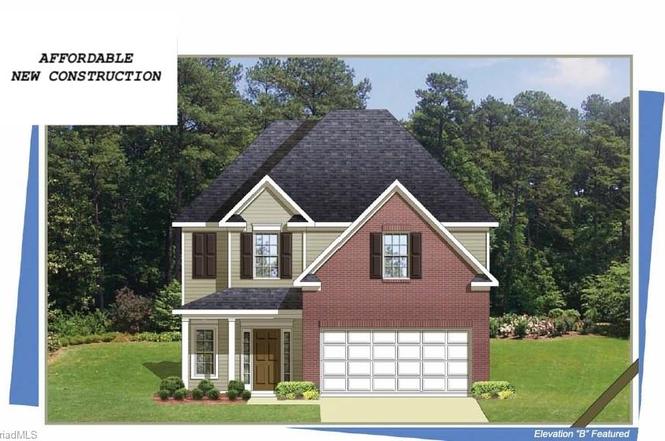
NEW PRICING! New Construction with an UPGRADE package including LVP FLOORING on the main level and GRANITE COUNTERS in the kitchen! Affordably priced NEW CONSTRUCTION with four bedrooms, 2.5 baths and a 2 car garage. This model features 1767 +/- square feet with an open floor plan on the main level. The great room opens to a spacious eat-in kitchen with solid wood cabinets, granite counters and black Whirlpool appliances featuring a smooth top range, microwave and dishwasher. All four bedrooms are located upstairs in this plan and the primary suite has a large walk-in closet and bath with double vanities. Low maintenance vinyl siding and an HOA of just $20/month. (LOT 14: image may reflect
Key facts
- Open floor plan
- Solid wood cabinets
- New construction
Tags
Property features AI
Finance
- Other: Lot number 14; No pool; New construction / listed as new
- HOA & community: Community: Murraylane North; Association fee $20 monthly; Association affiliation: Greensboro
Exterior
- Parking: Attached 2-car garage; Driveway
- Utilities: Public sewer; Electric water heater
- Home design: Residential stick/site-built house; Two stories; New construction (2026)
- Construction: Vinyl siding; Slab foundation; Built in 2026
- Exterior features: City lot; Cleared lot; Public water
Interior
- Kitchen: Dishwasher; Free-standing range; Range hood; Electric water heater
- Bedrooms: Multiple bedrooms on second floor (three rooms listed on second level)
- Flooring: Carpet; Vinyl
- Bathrooms: Two full bathrooms; One half bathroom
- Heating & cooling: Heat pump for heating and cooling; Electric heating
- Interior features: Great room; Attic access only
- Laundry & utility: Dryer connection
Neighborhood map
What this means for you Summary
Snapshot
- This is a 4-bed/2.5-bath single-family listed at $275k. Condition is rated excellent.
Deal economics
- At list price, monthly cash flow is $-131 ($-2k/yr) — negative.
- To cash-flow at today's rent, offer at most $256k (6.9% below list).
- To meet the 1% rule (rent ≥ 1% of price), the offer needs to be $226k (17.6% below list).
- Recommended offer: $226k (17.6% below list) — sets the bar for 1% rule.
- Cap rate 5.7% vs local median 3.7% in Greensboro — top-decile yield for the area; either an underpriced asset or a hidden risk that comps aren't pricing in. Stress-test before assuming the spread holds.
Location & tenants
- Location reads 81/100 on livability (#12 in NC, #1,335 nationally) — a professional / high-income tenant draw. Strengths: amenities A+, commute A+, cost of living A+; Watch: employment D, crime F.
- Guilford County Schools (urban): math 39% / reading 45% proficiency, ranked #99 of 178 in NC (top 56%) — families likely to look elsewhere, expect single-tenant / working-renter base with shorter leases.
- Zoned schools: Waldo C Falkener Sr Elementary (math 14% / reading 15%, grade F, #1,331 of 1,410 statewide, top 96%, 511 students, 99% FRL); Otis L Hairston Sr Middle (math 13% / reading 22%, grade F, #445 of 475 statewide, top 94%, 631 students, 100% FRL); James B Dudley High (math 34% / reading 40%, grade F, #414 of 535 statewide, top 79%, 1,491 students, 100% FRL) — zoned schools average 100% FRL vs 52% district-wide (47 pts higher); higher-poverty schools than district average — tighter screening recommended.
- Zoned-school proficiency averages 23% at this address vs 42% district-wide (-19 pts) — the specific schools serving this property underperform the Guilford County Schools average; the district grade overstates school quality for this exact location.
- Market conditions: Rents rising (+3.8%/yr); 386 active listings in the ZIP; 9 comparable units currently listed for rent nearby; rentals at typical pace (median 23d on market — plan ~3-4 weeks tenant-placement turnaround); 3,843 units permitted in Guilford County in 2024 (2,397 in 5+ unit buildings).
- At $2,264/mo this rent would consume 57% of the median local household income ($47k/yr) (locally 2517% of renters already pay >50% of income on rent) — very limited rent-growth headroom before tenants either downsize or default.
Forward outlook
- Local home prices are declining (-3.0%/yr); year-one equity from $2k of loan paydown is wiped out by about $8k of value loss. Plan a longer hold.
- Guilford County population projected at +26% by 2050 — long-run rental-demand tailwind backs the buy-and-hold thesis.
Negotiation context
- It's been on market 220 days — a 12% lower offer ($242k) is reasonable based on typical stale-listing flexibility.
Questions for the listing agent
- What do current leases actually rent for vs. the listed asking? Can we see a recent rent roll and the last 12 months of T-12 income?
- It's been on market 220 days. Have you received any prior offers? Is the seller open to a 18% concession, seller financing, or rate buy-down credit?
- What does the HOA fee cover, when was the last increase, and are there any pending special assessments or reserve-fund shortfalls?
- Why hasn't it sold? Are there any deal-killer items the seller is aware of (foundation, flood, title, zoning, code violations)?
- Is there a deadline driving the sale (1031 exchange, divorce, estate, relocation)? That informs how much negotiation room exists.
- Crime grade is F in this area — have there been break-ins, vandalism, or insurance claims at this property in the last 3 years? What carrier currently insures it and at what premium?
- The area grade is low — what's the realistic commute time and amenity access for the typical tenant pool here? Any planned neighborhood developments (good or bad) we should know about?
- What's the average days-on-market for RENTAL listings here right now (not sales)? A rising rental-DOM trend means longer vacancies and softer asking-rent achievability than the comps imply.
- What's the recent tenant-quality profile in this submarket — average credit score on applications, eviction rate, late-payment / NSF rate, and stable-employment percentage? A property-management company in the area should have these aggregated.
- How much new for-sale + rental construction is in the pipeline within 1–3 miles? Heavy new supply typically softens prices + rents 12–24 months out; constrained supply supports both.
Investment metrics
- 1% rule
- 0.82% ✗
- Cap rate
- 5.72%
- Cash-on-cash
- -2.05%
- DSCR
- 0.91
- GRM
- 10.1
CMA / ARV
- ARV (on-the-fly)
- $282,720
- Comps found
- 12
Show comp detail 12 sales within ~0.75 mi
| Address | Dist | Beds/Ba | Sqft | Sold | Price | $/sf | Match |
|---|---|---|---|---|---|---|---|
| 3721 Carol O'ferrell Ct | 0.02mi | 4/2.5 | 1,762 (-0%) | 2mo | $277,000 | $157 | 97 |
| 2012 Peggy Joe Way | 0.04mi | 4/2.5 | 1,760 (-0%) | 1mo | $282,500 | $161 | 97 |
| 2009 Peggy Joe Way | 0.04mi | 4/2.5 | 1,760 (-0%) | 2mo | $284,500 | $162 | 96 |
| 2008 Peggy Joe Way | 0.06mi | 4/2.5 | 1,760 (-0%) | 2mo | $279,900 | $159 | 95 |
| 3724 Carol O'ferrell Ct | 0.03mi | 4/2.5 | 1,804 (+2%) | 1mo | $277,950 | $154 | 94 |
| 3706 Carol O'ferrell Ct | 0.09mi | 4/2.5 | 1,767 (0%) | 2mo | $262,900 | $149 | 94 |
| 3719 Carol O'ferrell Ct | 0.03mi | 4/2.5 | 1,715 (-3%) | 2mo | $282,500 | $165 | 92 |
| 2006 Peggy Joe Way | 0.06mi | 4/2.5 | 1,804 (+2%) | 2mo | $279,900 | $155 | 92 |
| 2004 Peggy Joe Way | 0.04mi | 4/2.5 | 1,762 (-0%) | 8mo | $282,500 | $160 | 91 |
| 2000 Peggy Joe Way | 0.07mi | 4/2.5 | 1,715 (-3%) | 8mo | $282,500 | $165 | 86 |
| 3723 Carol O'ferrell Ct | 0.27mi | 4/2.5 | 1,760 (-0%) | 3mo | $279,900 | $159 | 84 |
| 510 Menlo Park Rd | 0.50mi | 4/2.5 | 1,703 (-4%) | 2mo | $275,000 | $161 | 69 |
Match score weights: distance 35% · size 25% · config 20% · recency 20%. Top-matched comps best support the ARV.
Projected returns pro-forma
-3.0% appreciation · 3.83% rent growth · sell at horizon
- IRR
- -18.7%
- Equity multiple
- 0.34×
- Total profit
- $-50,949
- Equity at exit
- $40,988
- IRR
- -9.6%
- Equity multiple
- 0.39×
- Total profit
- $-46,982
- Equity at exit
- $23,768
Cash invested: $76,972 (down + closing). Projections, not guarantees.
Landlord ↔ Tenant lean methodology
- Overall (STATE)
- 85 Strongly Landlord-Friendly
- State North Carolina
- 85 Strongly Landlord-Friendly · R+3
- County
- — inherits STATE
- City
- — inherits STATE
ZIP-level market 27405
- Home prices YoY
- -20.6%
- Rents YoY
- 3.8%
- Active inventory
- 386
- Price-to-rent
- 10.1×
Monthly cashflow live
- Estimated rent
- $2,264 high interval (Pro) →
- Mortgage (P&I)
- −$1,442
- Tax est. 1.5%
- −$344 /mo · $4,124/yr
- Insurance
- −$115
- HOA
- −$20
- Vacancy / Maint / Mgmt
- −$475
- Net cashflow
- $-131
Break-even live
Sensitivity live
| Price | -10% $59 | -5% $-36 | +0% $-131 | +5% $-226 | +10% $-321 |
|---|---|---|---|---|---|
| Rent | -10% $-310 | -5% $-221 | +0% $-131 | +5% $-42 | +10% $48 |
| Rate | -1.0pp $7 | -0.5pp $-61 | base $-131 | +0.5pp $-202 | +1.0pp $-275 |
UW: 25.0% down · 7.5% · 30yr · 1.5% tax · 5.0% vac · 8.0% maint · 8.0% mgmt
Financing live
Cash to close
- Down payment
- $68,725
- Closing costs
- $8,247
- Reserves months
- —
- Total cash needed
- —
Loan-product check · same deal, 3 products live
Conventional
25% down · 7.5% · 30yr
- Down + closing
- —
- Monthly P&I
- —
- Monthly cashflow
- —
- DSCR
- —
- Eligible?
- —
Personal DTI + credit; lowest rate.
DSCR
20% down · 8.5% · 30yr
- Down + closing
- —
- Monthly P&I
- —
- Monthly cashflow
- —
- DSCR
- —
- Eligible?
- —
No personal income docs; deal must DSCR.
Hard money
10% down · 12.0% · 12mo
- Down + closing
- —
- Monthly P&I
- —
- Monthly cashflow
- —
- DSCR
- —
- Eligible?
- —
Short-term bridge; refi at stabilization.
Rent comps 9 comps
| Address | Beds | Baths | Sqft | Rent | $/sqft | DOM | Units | Dist |
|---|---|---|---|---|---|---|---|---|
| 2017 Peggy Joe Way Unit 1391420P Greensboro, NC | 4.0 | 2.5 | 1894 | $3,344 | $1.77 | 16d | 1 | 0.09mi |
| 306 Murraylane Rd Greensboro, NC | 3.0 | 2.0 | 1330 | $1,815 | $1.36 | 16d | 1 | 0.15mi |
| 308 Oferrell St Greensboro, NC | 4.0 | 2.5 | 1762 | $1,895 | $1.08 | 25d | 1 | 0.22mi |
| 507 Menlo Park Rd Greensboro, NC | 4.0 | 2.5 | 1767 | $1,919 | $1.09 | 22d | 1 | 0.49mi |
| 4214 Kildare Dr Greensboro, NC | 3.0 | 1.5 | 1329 | $1,450 | $1.09 | 25d | 1 | 0.67mi |
| 4020 Mountainridge Dr Greensboro, NC | 4.0 | 2.5 | 1500 | $1,825 | $1.22 | 25d | 1 | 0.77mi |
| 4014 Mountainridge Dr Greensboro, NC | 4.0 | 2.5 | 1445 | $1,795 | $1.24 | 20d | 1 | 0.79mi |
| 810 Elwell Ave Greensboro, NC | 3.0 | 2.0 | 1280 | $1,500 | $1.17 | 16d | 1 | 0.94mi |
| 4302 Belfield Dr Greensboro, NC | 3.0 | 2.0 | 1300 | $1,755 | $1.35 | 25d | 1 | 1.03mi |
HOA detail
- Monthly dues
- $20 · $240/yr
- Likely covers
- pool
Listing history 18 events
-
2026-06-22days on market $274,900 Active 220 DOM
-
2026-06-18days on market $274,900 Active 217 DOM
-
2026-06-17days on market $274,900 Active 216 DOM
-
2026-06-16days on market $274,900 Active 215 DOM
-
2026-06-15days on market $274,900 Active 214 DOM
-
2026-06-14days on market $274,900 Active 212 DOM
-
2026-06-10pricedays on market $274,900 Active 209 DOM
-
2026-06-09days on market $277,900 Active 208 DOM
-
2026-06-08days on market $277,900 Active 207 DOM
-
2026-06-07days on market $277,900 Active 206 DOM
-
2026-06-03pricedays on market $277,900 Active 202 DOM
-
2026-06-02days on market $279,900 Active 201 DOM
-
2026-06-01days on market $279,900 Active 200 DOM
-
2026-05-31days on market $279,900 Active 199 DOM
-
2026-05-31days on market $279,900 Active 198 DOM
-
2026-05-21price $279,900
-
2026-03-01price $282,500
-
2025-11-13$284,900 Active
ⓘ Source: listings_history table (triggers on properties + properties_extension) + one-shot
backfill from property_details.listing_events for pre-trigger history.
Nearby sold comps map
Loading sold comps map…
Walkable amenities ~0.75 mi
Loading nearby amenities…
Taxation est. · year 1
- Rental income
- $27,168
- − Mortgage interest
- −$15,399
- − Property taxes
- −$4,124
- − Insurance
- −$1,374
- − Repairs & maintenance
- −$2,173
- − Management
- −$2,173
- − HOA
- −$240
- − Depreciation
- −$7,997
- Taxable loss
- −$6,313
- Est. tax savings @ 24.0%
- +$1,515
- After-tax cash flow
- $-59/yr
For passive investors: Depreciation is non-cash, so a rental often shows a tax loss while cash-flowing — sheltering income. Rental losses are passive: they offset passive income freely, and up to $25,000/yr can offset ordinary (W-2) income if you actively participate and your MAGI is under $100k (phasing out to $0 by $150k); unused losses carry forward. On sale, claimed depreciation is recaptured at up to 25%, and gains may owe capital-gains tax (a 1031 exchange can defer both). Figures are a year-1 estimate at your 24.0% rate — not tax advice; consult a CPA.
Condition & rehab AI · 3 photos
This new construction home is in excellent condition with no visible repairs or maintenance needed. Upgrades to smart home technology and a smart thermostat can further enhance its value.
Value-add opportunities
- Both Upgrade to smart home technology — Adding smart home technology can increase both the resale and rental value by enhancing convenience and energy efficiency.
- Both Add smart thermostat — A smart thermostat can improve energy efficiency and comfort, making the home more attractive to buyers and renters.
Renovation cost estimate screening
Value-add ROI direction
- Both Upgrade to smart home technology — Adding smart home technology can increase both the resale and rental value by enhancing convenience and energy efficiency. ↑
- Both Add smart thermostat — A smart thermostat can improve energy efficiency and comfort, making the home more attractive to buyers and renters. ↑
ⓘ Cost ranges are severity-bucket heuristics (US national rule-of-thumb). Get contractor quotes + a written scope before underwriting a rehab budget.
Schools (NCES district)
- District
- Guilford County Schools
- NCES district ID
- 3701920
- Math proficiency
- 39% ▲ 1.00%
- Reading proficiency
- 45% ▲ 1.00%
- Median HH income
- $46,315
- Composite
- 35.78/100
- National rank
- #4842
- State rank
- #99 of 178 in NC
Livability — Greensboro
- Score
- 81/100
- State rank
- #12
- US rank
- #1335
Category grades
Schools grade is shown separately in the Schools card above.
Census & demographics
- Census place
- Greensboro, NC
- County
- Guilford County · 487,190 people
- City population
- 329,421
- Metro
- Greensboro-High Point, NC
- Population (ZIP)
- 54,303
- Household income
- $47,431
- Rent vs Own
- Severe rent burden
- 2517.0
Population outlook (Guilford County) Hauer SSP2
- Today (2025)
- 584,596 people
- By 2030
- 616,851 · +5.5%
- By 2040
- 678,451 · +16.1%
- By 2050
- 734,788 · +25.7%
- By 2075
- 862,985 · +47.6%
- By 2100
- 948,704 · +62.3%
Race, ethnicity, and origin ACS 2023
- Neighborhood character
- Diverse neighborhood (Simpson 0.62)
- Race & ethnicity
- Black 57% White 20% Hispanic / Latino 14% Two or more races 7% Asian 4%
- Hispanic origin (detail)
- Mexican 9% Puerto Rican 2%
- Common ancestry
- Romanian 1% Ukrainian 1% Italian 1%
- Foreign-born
- 15% · Canada, Vietnam, China
- Languages at home
- 79% English-only · Spanish 11% Other Asian/Pacific 2% Other Indo-European 1%
Political lean MEDSL · Guilford
- 2024 margin
- Strong D (+21.8) · D 60.2% · R 38.4% · Other 1.4%
- 2008→2024 swing
- +3.5pp toward D · 2008: 18.4pp · 2024: 21.8pp
- All cycles
- 2024: D+21.8 2020: D+23.1 2016: D+20.0 2012: D+16.5 2008: D+18.4
Not yet ingested
- Civics
- —
Market trends
- HPI YoY
- ▼ -63.02%
- Current HPI
- 243.1261
- Rent YoY
- ▲ 3.83%
- Metro
- Greensboro-High Point, NC
- State GDP YoY
- ▲ 3.28%
- F500 in state
- 26
Industry mix (Fortune 500 HQ in NC)
| Industry | F500 HQs | Revenue |
|---|---|---|
| Financial Services | 2 | $213B |
|
||
| Retail | 2 | $95B |
|
||
| Industrial Conglomerate | 1 | $38B |
|
||
| Metals / Steel | 1 | $35B |
|
||
| Utilities | 1 | $30B |
|
||
| Industrial Machinery | 1 | $19B |
|
||
Price history
-1.8% since first listed3 events — show timeline
- 2026-05-21 Price Changed $279,900 Triad MLS
- 2026-03-01 Price Changed $282,500 Triad MLS
- 2025-11-13 Listed $284,900 Triad MLS
Cash-flow waterfall
monthlySold comps — $/sqft
last 12 mo · ≤1 miLoading sold comps…