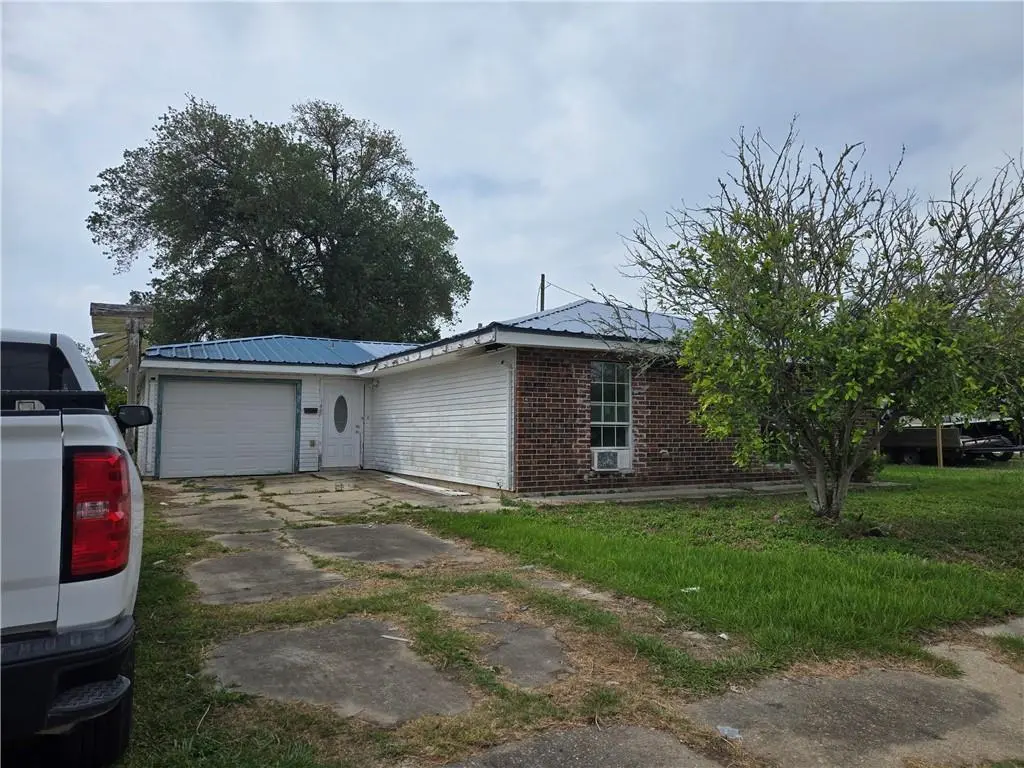
146 Satsuma Dr · Buras, LA
Flood risk 9/10 · Severe
- FEMA flood zone
- AE
- Chance of flooding over 30 yrs
- 0.79%
- Est. flood insurance / yr
- $1,737 – $8,500
Fire risk 1/10 · Minimal
- Est. fire insurance / yr
- $1,269 – $2,357
Heat risk 10/10 · Severe
- Hot days now (above 106°F)
- 7 days/yr
- Hot days in 30 yrs
- 25 days/yr
Wind risk 10/10 · Severe
- Chance of severe wind over 30 yrs
- 99.0%
Air-quality risk 2/10 · Minimal
- Unhealthy air days now
- 0 days/yr
- Unhealthy air days in 30 yrs
- 1 days/yr
Risk factors via First Street. Map © Google.
Why this score? — see what drove the A- grade
The composite is a weighted blend of 9 inputs, each scored 0–100. Each bar is that input's sub-score; the figure is the points it added to the 100-point composite (weight × sub-score).
- Cash flow +30.0/30.0
- ARV discount +15.0/15.0
- 1% rule +10.0/10.0
- DSCR +10.0/10.0
- Schools +5.0/10.0
- Appreciation +4.9/10.0
- Livability +2.6/5.0
- Rent growth +2.5/5.0
- Condition / age +2.5/5.0
$75,000
🖨 Deal sheet 📄 Offer letter ✓ Due diligence
Listing remarks MLS
INVESTOR OPPORTUNITY! HOUSE & VACANT LOT ON 119 E. COLLINS ST ARE SOLD AS A PACKAGE FOR $75K. House had termites and was treated more than year ago by Billiot's Pest Control. Still has power and water, but they are turned off; house's been vacant more than a year. Need TLC prior to moving in. CASH OR CONVENTIONAL LOANS WELCOME. Seller is motivated. Termite contract and results attached here are more than one year old.
Key facts
- 2 parking spots
- Built 1975
- Listed 358 days
Neighborhood map
What this means for you Summary
Snapshot
- This is a 3-bed/2.0-bath single-family listed at $75k.
Deal economics
- At list price, monthly cash flow is $450 ($5k/yr) — positive.
- The deal already cash-flows at list — no discount required.
- Meets the 1% rule at list price ($2k rent vs $75k).
- Recommended offer: $66k (12.0% below list) — sets the bar for market timing.
Location & tenants
- Location reads 52/100 on livability (#409 in LA) — a working-class tenant base; expect higher turnover. Strengths: cost of living A+; Watch: housing C-, schools D+, crime F.
- Market conditions: 52 active listings in the ZIP; 88 units permitted in Plaquemines Parish in 2024 (0 in 5+ unit buildings).
Forward outlook
- In year one you build about $302 of equity ($519 loan paydown + $-217 appreciation (-0.3% local appreciation)).
- Plaquemines County population projected at +6% by 2050 — modest demand growth; plan on rents tracking national, not racing it.
- At projected returns (-0.3% appreciation + 3.0% rent growth), your $21k cash investment doubles in ~4 years — after that, you're playing with house money.
Negotiation context
- It's been on market 358 days — a 12% lower offer ($66k) is reasonable based on typical stale-listing flexibility.
- 6 sale attempts since 6y ago with the ask held roughly flat each time — persistent listings suggest the price (not the market) is what's stuck; bring a comps-based counter.
Risks & watch-outs
- Watch-outs: flood insurance adds $427/mo.
- Climate carrying-cost: in FEMA flood zone AE (mandatory federal flood insurance); severe wind risk, 99% chance of damaging wind over 30y; extreme-heat days projected 7→25/yr by 2055 (HVAC capex compounding) — expect insurance premiums to compound above CPI over the hold.
Questions for the listing agent
- It's been on market 358 days. Have you received any prior offers? Is the seller open to a 12% concession, seller financing, or rate buy-down credit?
- Built in 1975 — when were the roof, HVAC, electrical panel, plumbing, and water heater last replaced?
- What's the actual annual flood-insurance premium (NFIP or private), and is the property in a SFHA with mandatory coverage?
- Why hasn't it sold? Are there any deal-killer items the seller is aware of (foundation, flood, title, zoning, code violations)?
- Is there a deadline driving the sale (1031 exchange, divorce, estate, relocation)? That informs how much negotiation room exists.
- Schools are D-rated, which usually means shorter tenancies and higher turnover. Who's the typical renter profile here, and what's been the actual vacancy rate?
- Crime grade is F in this area — have there been break-ins, vandalism, or insurance claims at this property in the last 3 years? What carrier currently insures it and at what premium?
- What's the average days-on-market for RENTAL listings here right now (not sales)? A rising rental-DOM trend means longer vacancies and softer asking-rent achievability than the comps imply.
- What's the recent tenant-quality profile in this submarket — average credit score on applications, eviction rate, late-payment / NSF rate, and stable-employment percentage? A property-management company in the area should have these aggregated.
- How much new for-sale + rental construction is in the pipeline within 1–3 miles? Heavy new supply typically softens prices + rents 12–24 months out; constrained supply supports both.
Investment metrics
- 1% rule
- 2.29% ✓
- Cap rate
- 20.31%
- Cash-on-cash
- 50.07%
- DSCR
- 3.23
- GRM
- 3.6
CMA / ARV
- ARV (median comp)
- $124,247
- List price
- $75,000
- Delta
- -39.64%
- Verdict
- UNDERPRICED
- Comps
- 3 within 2.0 mi
Projected returns pro-forma
-0.29% appreciation · 3.0% rent growth · sell at horizon
- IRR
- 25.5%
- Equity multiple
- 2.22×
- Total profit
- $25,700
- Equity at exit
- $20,698
- IRR
- 29.9%
- Equity multiple
- 4.29×
- Total profit
- $69,045
- Equity at exit
- $24,035
Cash invested: $21,000 (down + closing). Projections, not guarantees.
Landlord ↔ Tenant lean methodology
- Overall (STATE)
- 90 Strongly Landlord-Friendly
- State Louisiana
- 90 Strongly Landlord-Friendly · R+12
- County
- — inherits STATE
- City
- — inherits STATE
ZIP-level market 70041
- Home prices YoY
- -0.5%
- Active inventory
- 52
- Price-to-rent
- 3.6×
Monthly cashflow live
- Estimated rent
- $1,716 medium interval (Pro) →
- Mortgage (P&I)
- −$393
- Tax from tax record
- −$55 /mo · $662/yr
- Insurance
- −$31
- Flood insurance flood zone
- −$427 /mo · $5,118/yr
- HOA
- −$0
- Vacancy / Maint / Mgmt
- −$360
- Net cashflow
- $450
Break-even live
UW: 25.0% down · 7.5% · 30yr · 1.5% tax · 5.0% vac · 8.0% maint · 8.0% mgmt
Financing live
Cash to close
- Down payment
- $18,750
- Closing costs
- $2,250
- Reserves months
- —
- Total cash needed
- —
Loan-product check · same deal, 3 products live
Conventional
25% down · 7.5% · 30yr
- Down + closing
- —
- Monthly P&I
- —
- Monthly cashflow
- —
- DSCR
- —
- Eligible?
- —
Personal DTI + credit; lowest rate.
DSCR
20% down · 8.5% · 30yr
- Down + closing
- —
- Monthly P&I
- —
- Monthly cashflow
- —
- DSCR
- —
- Eligible?
- —
No personal income docs; deal must DSCR.
Hard money
10% down · 12.0% · 12mo
- Down + closing
- —
- Monthly P&I
- —
- Monthly cashflow
- —
- DSCR
- —
- Eligible?
- —
Short-term bridge; refi at stabilization.
Listing history 21 events
-
2026-06-18days on market $75,000 Active 358 DOM
-
2026-06-17days on market $75,000 Active 357 DOM
-
2026-06-16days on market $75,000 Active 356 DOM
-
2026-06-15days on market $75,000 Active 355 DOM
-
2026-06-13days on market $75,000 Active 353 DOM
-
2026-06-13days on market $75,000 Active 352 DOM
-
2026-06-10days on market $75,000 Active 350 DOM
-
2026-06-09days on market $75,000 Active 349 DOM
-
2026-06-08days on market $75,000 Active 348 DOM
-
2026-06-07days on market $75,000 Active 347 DOM
-
2026-06-03days on market $75,000 Active 343 DOM
-
2026-06-02days on market $75,000 Active 342 DOM
-
2026-06-01days on market $75,000 Active 341 DOM
-
2026-05-31days on market $75,000 Active 340 DOM
-
2025-06-25$75,000 Active 427-char remark
Show marketing remark (425 chars)
INVESTOR OPPORTUNITY! HOUSE & VACANT LOT ON 119 E. COLLINS ST ARE SOLD AS A PACKAGE FOR $75K. House had termites and was treated more than year ago by Billiot's Pest Control. Still has power and water, but they are turned off; house's been vacant more than a year. Need TLC prior to moving in. CASH OR CONVENTIONAL LOANS WELCOME. Seller is motivated. Termite contract and results attached here are more than one year old.
-
2025-06-25$75,000 Active 425-char remark
Show marketing remark (425 chars)
INVESTOR OPPORTUNITY! HOUSE & VACANT LOT ON 119 E. COLLINS ST ARE SOLD AS A PACKAGE FOR $75K. House had termites and was treated more than year ago by Billiot's Pest Control. Still has power and water, but they are turned off; house's been vacant more than a year. Need TLC prior to moving in. CASH OR CONVENTIONAL LOANS WELCOME. Seller is motivated. Termite contract and results attached here are more than one year old.
-
2024-08-21soldstatus $80,000 Closed
-
2023-11-13$85,000
-
2023-11-13$85,000 Active
-
2022-08-13$85,000
-
2020-10-25$130,000
ⓘ Source: listings_history table (triggers on properties + properties_extension) + one-shot
backfill from property_details.listing_events for pre-trigger history.
Tax reassessment forecast LA · Resets to sale price
- Current annual tax
- $662 · $55/mo
- Projected year-2 tax
- $662 · $55/mo
- Expected delta
- $0/yr ($0/mo · 0.0%)
ⓘ Screening estimate from a state-policy table — verify with the county assessor before closing.
Climate risk First Street
- Flood 9/10 Extreme FEMA zone AE · 79% chance over 30 yrs
- Wildfire 1/10 Low
- Heat 10/10 Extreme 7 d/yr ≥106°F today · 25 d/yr by 30 yrs out
- Wind 10/10 Extreme 99% chance of damaging wind over 30 yrs
- Air quality 2/10 Low 0 unhealthy d/yr today · 1 by 30 yrs out
Nearby sold comps map
Loading sold comps map…
Walkable amenities ~0.75 mi
Loading nearby amenities…
Taxation est. · year 1
- Rental income
- $20,597
- − Mortgage interest
- −$4,201
- − Property taxes
- −$662
- − Insurance
- −$5,494
- − Repairs & maintenance
- −$1,648
- − Management
- −$1,648
- − Depreciation
- −$2,182
- Taxable income
- $4,763
- Est. tax owed @ 24.0%
- −$1,143
- After-tax cash flow
- $4,254/yr
For passive investors: Depreciation is non-cash, so a rental often shows a tax loss while cash-flowing — sheltering income. Rental losses are passive: they offset passive income freely, and up to $25,000/yr can offset ordinary (W-2) income if you actively participate and your MAGI is under $100k (phasing out to $0 by $150k); unused losses carry forward. On sale, claimed depreciation is recaptured at up to 25%, and gains may owe capital-gains tax (a 1031 exchange can defer both). Figures are a year-1 estimate at your 24.0% rate — not tax advice; consult a CPA.
Schools (NCES district)
No district data.
Livability — Buras
- Score
- 52/100
- State rank
- #409
- US rank
- #24935
Category grades
Schools grade is shown separately in the Schools card above.
Census & demographics
- Census place
- Buras, LA
- Population (ZIP)
- 2,092
Population outlook (Plaquemines County) Hauer SSP2
- Today (2025)
- 24,526 people
- By 2030
- 24,843 · +1.3%
- By 2040
- 25,441 · +3.7%
- By 2050
- 26,074 · +6.3%
- By 2075
- 28,300 · +15.4%
- By 2100
- 30,195 · +23.1%
Race, ethnicity, and origin ACS 2023
- Neighborhood character
- Diverse neighborhood (Simpson 0.61)
- Race & ethnicity
- White 57% Asian 19% Black 15% Two or more races 6% Native American 1%
- Common ancestry
- Lithuanian 25% American 1%
- Foreign-born
- 16% · Vietnam, Canada
- Languages at home
- 82% English-only · Vietnamese 9% Other Asian/Pacific 8% French/Haitian/Cajun 1%
Political lean MEDSL · Plaquemines
- 2024 margin
- Solid R (+38.0) · D 30.4% · R 68.4% · Other 1.2%
- 2008→2024 swing
- -4.4pp toward R · 2008: -33.6pp · 2024: -38.0pp
- All cycles
- 2024: R+38.0 2020: R+36.3 2016: R+33.6 2012: R+28.1 2008: R+33.6
Not yet ingested
- Civics
- —
Market trends
- HPI YoY
- ▼ -0.29%
- Current HPI
- 58.8381
- Rent YoY
- —
- Metro
- —
- State GDP YoY
- ▲ 3.29%
- F500 in state
- 10
Industry mix (Fortune 500 HQ in LA)
| Industry | F500 HQs | Revenue |
|---|---|---|
| Telecommunications | 2 | $23B |
|
||
| Utilities | 1 | $12B |
|
||
| Wholesale / Distribution | 1 | $5B |
|
||
| Advertising | 1 | $2B |
|
||
Price history
-42.3% since first listed7 events — show timeline
- 2025-06-25 Listed $75,000 AcadianaMLS
- 2025-06-25 Listed $75,000 GSREIN
- 2024-08-21 Sold (MLS) $80,000 GSREIN
- 2023-11-13 Listed $85,000 GSREIN
- 2023-11-13 Listed $85,000 AcadianaMLS
- 2022-08-13 Listed $85,000 AcadianaMLS
- 2020-10-25 Listed $130,000 AcadianaMLS
Property tax history
+28.5%/yrLatest (2025): $662 · -3.6% YoY. Source: county tax records.
Cash-flow waterfall
monthlySold comps — $/sqft
last 12 mo · ≤1 miLoading sold comps…