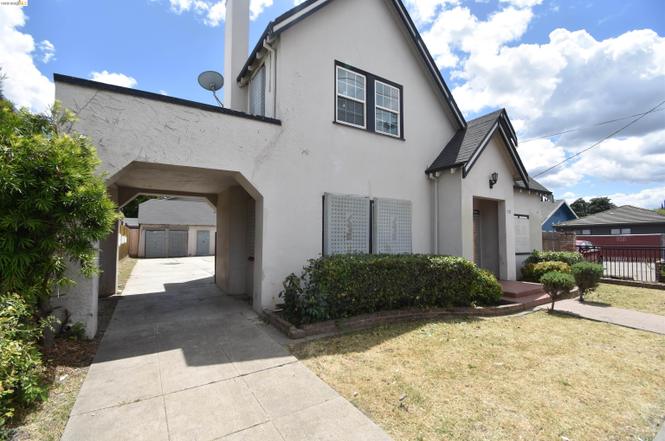
520 W Harding Way · Stockton, CA
Flood risk 5/10 · Moderate
- FEMA flood zone
- X
- Chance of flooding over 30 yrs
- 0.26%
- Est. flood insurance / yr
- $507 – $1,088
Fire risk 1/10 · Minimal
- Est. fire insurance / yr
- $659 – $1,223
Heat risk 7/10 · Major
- Hot days now (above 103°F)
- 7 days/yr
- Hot days in 30 yrs
- 15 days/yr
Wind risk 1/10 · Minimal
- Chance of severe wind over 30 yrs
- —
Air-quality risk 10/10 · Severe
- Unhealthy air days now
- 30 days/yr
- Unhealthy air days in 30 yrs
- 30 days/yr
Risk factors via First Street. Map © Google.
Why this score? — see what drove the C- grade
The composite is a weighted blend of 9 inputs, each scored 0–100. Each bar is that input's sub-score; the figure is the points it added to the 100-point composite (weight × sub-score).
- Cash flow +20.2/30.0
- ARV discount +7.5/15.0
- 1% rule +7.1/10.0
- DSCR +6.4/10.0
- Rent growth +3.1/5.0
- Schools +2.9/10.0
- Livability +2.9/5.0
- Condition / age +2.5/5.0
- Appreciation +0.0/10.0
$229,900
🖨 Deal sheet (PDF) 📄 Offer letter ✓ Due diligence
Listing remarks
Great opportunity to own this 4 bedroom 2 bath 1920s Victorian Home with original plaster walls and real hardwood floors. Full of charm, character, and solid craftsmanship, this home is anxious for someone to bring it back to its original luster. Make this HOME GREAT AGAIN!
Key facts
- 5,000 sq ft lot
- 2 garage spots
- Built 1924
Property features AI
Finance
- Other: Approximately 2,027 building area (square feet); Lot approximately 0.12 acres
Exterior
- Parking: Detached garage; 2 covered parking spaces; 2 garage spaces
- Utilities: Public water; Public sewer
- Home design: Single-family residence; Residential property; Built in 1924
- Construction: Stucco construction; Shingle roof; Concrete foundation
- Exterior features: Back yard; Level lot
Interior
- Kitchen: Other kitchen features
- Bedrooms: Street-level bedroom
- Flooring: Wood flooring
- Bathrooms: 2 full bathrooms
- Heating & cooling: Has heating
- Interior features: No additional rooms; Living room fireplace
- Laundry & utility: Dedicated laundry room
Neighborhood map
What this means for you Summary
Snapshot
- This is a 4-bed/2.0-bath single-family listed at $230k.
Deal economics
- At list price, monthly cash flow is $289 ($3k/yr) — positive.
- The deal already cash-flows at list — no discount required.
- Meets the 1% rule at list price ($3k rent vs $230k).
- Cap rate 7.8% vs local median 3.6% in Stockton — top-decile yield for the area; either an underpriced asset or a hidden risk that comps aren't pricing in. Stress-test before assuming the spread holds.
Location & tenants
- Location reads 57/100 on livability (#734 in CA) — a working-class tenant base; expect higher turnover. Strengths: housing A+, health & safety A, amenities A-; Watch: employment C-, crime F, commute F.
- Stockton Unified (urban): math 23% / reading 46% proficiency, ranked #295 of 517 in CA (top 57%) — families likely to look elsewhere, expect single-tenant / working-renter base with shorter leases; 78% free/reduced lunch — lower-income household profile, screen leases tightly.
- Zoned schools: Cleveland Elementary (652 students, 78% FRL); Stagg Senior High (math 12% / reading 32%, grade F, #950 of 1,170 statewide, top 82%, 1,773 students, 71% FRL) — zoned schools at 75% FRL track the district average.
- Zoned-school proficiency averages 22% at this address vs 34% district-wide (-12 pts) — the specific schools serving this property underperform the Stockton Unified average; the district grade overstates school quality for this exact location.
- Market conditions: Rents rising (+2.4%/yr); 141 active listings in the ZIP; 8 comparable units currently listed for rent nearby; rentals lingering (median 45d on market — plan ~5-8 weeks vacancy on turnover, expect pricing pressure); 62% of comp listings sitting > 30 days — soft ceiling on asking rent; solid renter incomes; 3,779 units permitted in San Joaquin County in 2024 (0 in 5+ unit buildings).
- This rent runs 44% of the median local income ($76k/yr) — at the standard rent-burdened threshold; future hikes will face affordability resistance.
Forward outlook
- Local home prices are declining (-3.0%/yr); year-one equity from $2k of loan paydown is wiped out by about $7k of value loss. Plan a longer hold.
- San Joaquin County population projected at +17% by 2050 — long-run rental-demand tailwind backs the buy-and-hold thesis.
Negotiation context
- Only 3 days on market — expect competitive offers; lowballing is unlikely to land.
- 3 sale attempts since 3y ago with the ask held roughly flat each time — persistent listings suggest the price (not the market) is what's stuck; bring a comps-based counter.
Risks & watch-outs
- Watch-outs: property tax is 3.2% of price; built in 1924 — expect roof / HVAC / electrical / plumbing capex.
- Climate carrying-cost: moderate flood risk; extreme-heat days projected 7→15/yr by 2055 (HVAC capex compounding) — expect insurance premiums to compound above CPI over the hold.
Questions for the listing agent
- Built in 1924 — when were the roof, HVAC, electrical panel, plumbing, and water heater last replaced?
- Property tax is high relative to price — has the assessment been appealed recently, and will the sale trigger a re-assessment?
- Is there a deadline driving the sale (1031 exchange, divorce, estate, relocation)? That informs how much negotiation room exists.
- Schools are D-rated, which usually means shorter tenancies and higher turnover. Who's the typical renter profile here, and what's been the actual vacancy rate?
- Crime grade is F in this area — have there been break-ins, vandalism, or insurance claims at this property in the last 3 years? What carrier currently insures it and at what premium?
- What's the average days-on-market for RENTAL listings here right now (not sales)? A rising rental-DOM trend means longer vacancies and softer asking-rent achievability than the comps imply.
- What's the recent tenant-quality profile in this submarket — average credit score on applications, eviction rate, late-payment / NSF rate, and stable-employment percentage? A property-management company in the area should have these aggregated.
- How much new for-sale + rental construction is in the pipeline within 1–3 miles? Heavy new supply typically softens prices + rents 12–24 months out; constrained supply supports both.
Investment metrics
- 1% rule
- 1.21% ✓
- Cap rate
- 7.80%
- Cash-on-cash
- 5.39%
- DSCR
- 1.24
- GRM
- 6.9
CMA / ARV
- ARV (on-the-fly)
- $492,561
- Comps found
- 12
Show comp detail 12 sales within ~0.75 mi
| Address | Dist | Beds/Ba | Sqft | Sold | Price | $/sf | Match |
|---|---|---|---|---|---|---|---|
| 52 W Adams St | 0.52mi | 4/1.5 | 2,041 (+1%) | 2mo | $416,000 | $204 | 71 |
| 844 W Elm St | 0.25mi | 4/2.0 | 2,235 (+10%) | 2mo | $510,000 | $228 | 70 |
| 2023 N Commerce St | 0.43mi | 3/2.0 (-1) | 2,130 (+5%) | 3mo | $575,000 | $270 | 64 |
| 1160 W Walnut St | 0.52mi | 3/2.5 (-1) | 1,972 (-3%) | 1mo | $480,000 | $243 | 64 |
| 1046 N Pershing Ave | 0.67mi | 4/2.0 | 2,076 (+2%) | 5mo | $400,000 | $193 | 61 |
| 928 N Stockton St | 0.44mi | 3/2.0 (-1) | 1,867 (-8%) | 1mo | $385,000 | $206 | 61 |
| 465 S Tuxedo Ave | 0.34mi | 3/2.0 (-1) | 1,801 (-11%) | 0mo | $450,000 | $250 | 60 |
| 33 E Pine | 0.58mi | 4/3.0 | 2,138 (+6%) | 0mo | $615,000 | $288 | 60 |
| 1061 W Willow St | 0.41mi | 3/2.0 (-1) | 1,836 (-9%) | 3mo | $315,000 | $172 | 57 |
| 1219 S Tuxedo Ave | 0.60mi | 4/3.0 | 2,152 (+6%) | 4mo | $475,000 | $221 | 54 |
| 2644 Crafton Way | 0.58mi | 3/2.5 (-1) | 1,873 (-8%) | 4mo | $510,000 | $272 | 50 |
| 1118 Oxford Way | 0.70mi | 3/3.0 (-1) | 2,293 (+13%) | 1mo | $599,900 | $262 | 36 |
Match score weights: distance 35% · size 25% · config 20% · recency 20%. Top-matched comps best support the ARV.
Projected returns pro-forma
-3.0% appreciation · 2.37% rent growth · sell at horizon
- IRR
- -8.7%
- Equity multiple
- 0.68×
- Total profit
- $-20,341
- Equity at exit
- $34,279
- IRR
- -0.0%
- Equity multiple
- 1.00×
- Total profit
- $-120
- Equity at exit
- $19,878
Cash invested: $64,372 (down + closing). Projections, not guarantees.
Landlord ↔ Tenant lean methodology
- Overall (STATE)
- 18 Strongly Tenant-Friendly
- State California
- 18 Strongly Tenant-Friendly · D+13
- County
- — inherits STATE
- City
- — inherits STATE
ZIP-level market 95204
- Rents YoY
- 2.4%
- Active inventory
- 141
- Price-to-rent
- 6.9×
Monthly cashflow live
- Estimated rent
- $2,787 medium interval (Pro) →
- Mortgage (P&I)
- −$1,206
- Tax from tax record
- −$611 /mo · $7,330/yr
- Insurance
- −$96
- HOA
- −$0
- Vacancy / Maint / Mgmt
- −$585
- Net cashflow
- $289
Break-even live
Sensitivity live
| Price | -10% $419 | -5% $354 | +0% $289 | +5% $224 | +10% $159 |
|---|---|---|---|---|---|
| Rent | -10% $69 | -5% $179 | +0% $289 | +5% $399 | +10% $509 |
| Rate | -1.0pp $405 | -0.5pp $348 | base $289 | +0.5pp $230 | +1.0pp $169 |
UW: 25.0% down · 7.5% · 30yr · 1.5% tax · 5.0% vac · 8.0% maint · 8.0% mgmt
Financing live
Cash to close
- Down payment
- $57,475
- Closing costs
- $6,897
- Reserves months
- —
- Total cash needed
- —
Loan-product check · same deal, 3 products live
Conventional
25% down · 7.5% · 30yr
- Down + closing
- —
- Monthly P&I
- —
- Monthly cashflow
- —
- DSCR
- —
- Eligible?
- —
Personal DTI + credit; lowest rate.
DSCR
20% down · 8.5% · 30yr
- Down + closing
- —
- Monthly P&I
- —
- Monthly cashflow
- —
- DSCR
- —
- Eligible?
- —
No personal income docs; deal must DSCR.
Hard money
10% down · 12.0% · 12mo
- Down + closing
- —
- Monthly P&I
- —
- Monthly cashflow
- —
- DSCR
- —
- Eligible?
- —
Short-term bridge; refi at stabilization.
Rent comps 8 comps
| Address | Beds | Baths | Sqft | Rent | $/sqft | DOM | Units | Dist |
|---|---|---|---|---|---|---|---|---|
| 322 Lexington Ave Stockton, CA | 3.0 | 1.0 | 1508 | $2,400 | $1.59 | 45d | 1 | 0.29mi |
| 1214 N Pershing Ave Stockton, CA | 5.0 | 3.0 | 2650 | $3,450 | $1.30 | 45d | 1 | 0.65mi |
| 1552 Middlefield Ave Stockton, CA | 4.0 | 2.0 | 1542 | $2,400 | $1.56 | 20d | 1 | 0.83mi |
| 1164 W Mendocino Ave Stockton, CA | 4.0 | 2.0 | 1577 | $740 | $0.47 | 45d | 1 | 0.91mi |
| 212 W Euclid Ave Stockton, CA | 3.0 | 2.5 | 1833 | $2,900 | $1.58 | 45d | 1 | 0.93mi |
| 1220 W Mendocino Ave Stockton, CA | 4.0 | 2.0 | 1587 | $700 | $0.44 | 45d | 1 | 0.93mi |
| 3630 Bonnie Ln Stockton, CA | 5.0 | 2.0 | 1961 | $700 | $0.36 | 25d | 1 | 1.09mi |
| 1106 W Churchill St Stockton, CA | 5.0 | 3.0 | 1628 | $720 | $0.44 | 4d | 1 | 1.42mi |
Listing history 3 events
-
2026-06-21days on market $229,900 Active 3 DOM
-
2026-06-19remarks 274-char remark
-
2026-06-19$229,900 Active 1 DOM
ⓘ Source: listings_history table (triggers on properties + properties_extension) + one-shot
backfill from property_details.listing_events for pre-trigger history.
Tax reassessment forecast CA · Resets to sale price
- Current annual tax
- $7,330 · $611/mo
- Projected year-2 tax
- $7,330 · $611/mo
- Expected delta
- $0/yr ($0/mo · 0.0%)
ⓘ Screening estimate from a state-policy table — verify with the county assessor before closing.
Climate risk First Street
- Flood 5/10 Major FEMA zone X · 26% chance over 30 yrs
- Wildfire 1/10 Low
- Heat 7/10 Severe 7 d/yr ≥103°F today · 15 d/yr by 30 yrs out
- Wind 1/10 Low
- Air quality 10/10 Extreme 30 unhealthy d/yr today · 30 by 30 yrs out
Nearby sold comps map
Loading sold comps map…
Walkable amenities ~0.75 mi
Loading nearby amenities…
Taxation est. · year 1
- Rental income
- $33,441
- − Mortgage interest
- −$12,878
- − Property taxes
- −$7,330
- − Insurance
- −$1,150
- − Repairs & maintenance
- −$2,675
- − Management
- −$2,675
- − Depreciation
- −$6,688
- Taxable income
- $45
- Est. tax owed @ 24.0%
- −$11
- After-tax cash flow
- $3,461/yr
For passive investors: Depreciation is non-cash, so a rental often shows a tax loss while cash-flowing — sheltering income. Rental losses are passive: they offset passive income freely, and up to $25,000/yr can offset ordinary (W-2) income if you actively participate and your MAGI is under $100k (phasing out to $0 by $150k); unused losses carry forward. On sale, claimed depreciation is recaptured at up to 25%, and gains may owe capital-gains tax (a 1031 exchange can defer both). Figures are a year-1 estimate at your 24.0% rate — not tax advice; consult a CPA.
Schools (NCES district)
- District
- Stockton Unified
- NCES district ID
- 0638010
- Math proficiency
- 23% ▲ 2.00%
- Reading proficiency
- 46% ▲ 16.00%
- Median HH income
- $37,563
- Composite
- 28.65/100
- National rank
- #6701
- State rank
- #295 of 517 in CA
Livability — Stockton
- Score
- 57/100
- State rank
- #734
- US rank
- #21638
Category grades
Schools grade is shown separately in the Schools card above.
Census & demographics
- Census place
- Stockton, CA
- County
- San Joaquin County · 729,570 people
- City population
- 332,006
- Metro
- Stockton, CA
- Population (ZIP)
- 31,035
- Household income
- $75,548
- Rent vs Own
- Severe rent burden
- 1434.0
Population outlook (San Joaquin County) Hauer SSP2
- Today (2025)
- 796,965 people
- By 2030
- 828,849 · +4.0%
- By 2040
- 885,611 · +11.1%
- By 2050
- 929,798 · +16.7%
- By 2075
- 994,578 · +24.8%
- By 2100
- 971,291 · +21.9%
Race, ethnicity, and origin ACS 2023
- Neighborhood character
- Diverse neighborhood (Simpson 0.66)
- Race & ethnicity
- Hispanic / Latino 48% White 31% Two or more races 18% Asian 9% Black 7% Native American 2%
- Hispanic origin (detail)
- Mexican 42%
- Common ancestry
- Slovak 2% Russian 1% Italian 1%
- Foreign-born
- 18% · Canada, Vietnam, China
- Languages at home
- 67% English-only · Spanish 27% Other Asian/Pacific 3% Tagalog/Filipino 2%
Political lean MEDSL · San Joaquin
- 2024 margin
- Toss-up / Even · D 48.0% · R 48.9% · Other 3.0%
- 2008→2024 swing
- -11.6pp toward R · 2008: 10.7pp · 2024: -0.9pp
- All cycles
- 2024: R+0.9 2020: D+13.9 2016: D+12.9 2012: D+8.9 2008: D+10.7
Not yet ingested
- Civics
- —
Market trends
- HPI YoY
- ▼ -386.16%
- Current HPI
- 333.3367
- Rent YoY
- ▲ 2.37%
- Metro
- Stockton, CA
- State GDP YoY
- ▲ 3.21%
- F500 in state
- 116
Industry mix (Fortune 500 HQ in CA)
| Industry | F500 HQs | Revenue |
|---|---|---|
| Technology | 27 | $1,492B |
|
||
| Financial Services | 3 | $174B |
|
||
| Retail | 3 | $44B |
|
||
| Insurance | 3 | $26B |
|
||
| Media / Entertainment | 2 | $115B |
|
||
| Pharmaceuticals / Biotech | 2 | $62B |
|
||
Price history
+177.0% since first listed8 events — show timeline
- 2026-06-18 Listed $229,900 bridgeMLS, Bay East AOR, or Contra Costa AOR
- 2024-03-18 Listing Removed — CRMLS
- 2024-01-26 Listed $422,650 CRMLS
- 2024-01-01 Listing Removed — CRMLS
- 2023-10-24 Listed $387,929 CRMLS
- 2020-11-24 Sold (Public Records) $363,000 Public Records
- 2014-01-09 Sold (Public Records) $199,500 Public Records
- 1996-12-16 Sold (Public Records) $83,000 Public Records
Property tax history
+10.9%/yrLatest (2025): $7,330 · -14.3% YoY. Source: county tax records.
Cash-flow waterfall
monthlySold comps — $/sqft
last 12 mo · ≤1 miLoading sold comps…