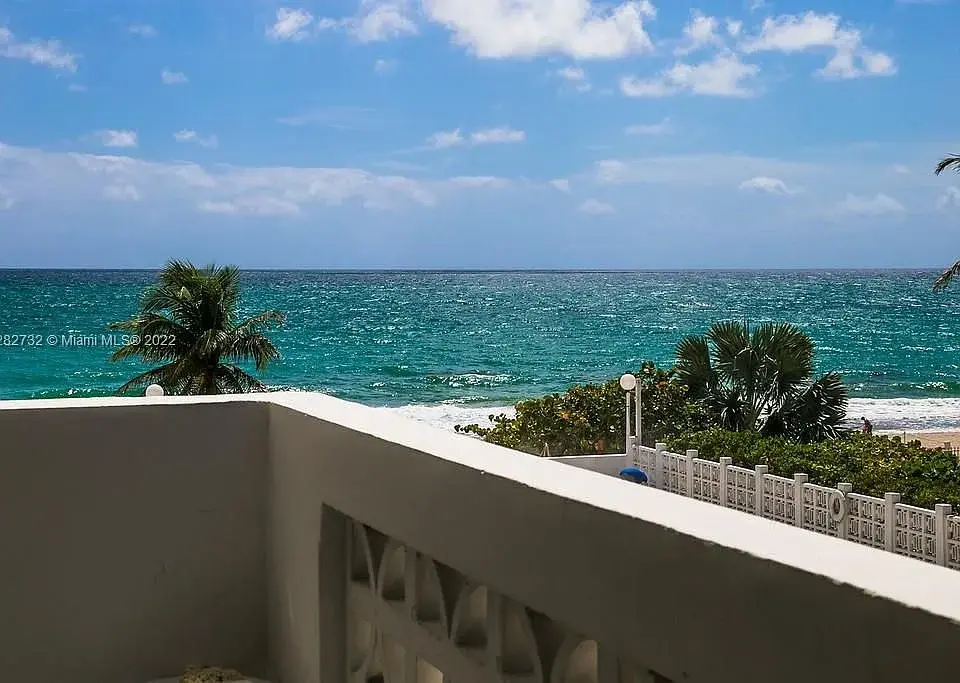
4250 Galt Ocean Dr Fl 33308 · Fort Lauderdale, FL
Flood risk 1/10 · Minimal
- FEMA flood zone
- X (unshaded)
- Chance of flooding over 30 yrs
- 0.0%
- Est. flood insurance / yr
- $507 – $1,088
Fire risk 1/10 · Minimal
- Est. fire insurance / yr
- $947 – $1,759
Heat risk 10/10 · Severe
- Hot days now (above 105°F)
- 6 days/yr
- Hot days in 30 yrs
- 23 days/yr
Wind risk 10/10 · Severe
- Chance of severe wind over 30 yrs
- 99.0%
Air-quality risk 2/10 · Minimal
- Unhealthy air days now
- 1 days/yr
- Unhealthy air days in 30 yrs
- 2 days/yr
Risk factors via First Street. Map © Google.
Why this score? — see what drove the F grade
The composite is a weighted blend of 9 inputs, each scored 0–100. Each bar is that input's sub-score; the figure is the points it added to the 100-point composite (weight × sub-score).
- ARV discount +7.5/15.0
- Schools +4.1/10.0
- Livability +4.1/5.0
- Cash flow +3.7/30.0
- 1% rule +3.6/10.0
- Rent growth +3.4/5.0
- Condition / age +2.5/5.0
- DSCR +0.0/10.0
- Appreciation +0.0/10.0
$389,988
🖨 Deal sheet 📄 Offer letter ✓ Due diligence
Listing remarks
Beautiful ocean-view condo for sale: dream home. For sale by owner. This 850-square-foot apartment home features one bedroom and one bathroom. This home is situated at 4250 Galt Ocean Dr APT 4K, Fort Lauderdale, FL 33308. The property features a large, heated pool situated directly on the beach, along with a double sun deck and a BBQ area. The building is a high-rise condominium complex built in 1967, offering residents amenities like a fitness center, underground parking, and secure access. The units in this building are typically one or two-bedroom condos, many of which offer direct ocean views. Realtor.com +4 5 sites 4250 Galt Ocean Dr Apt 8S, Fort Lauderdale, FL 33308 [Rental . .. 425
Key facts
- Garage
- Built 1972
- Listed 33 days
Property features AI
Exterior
- Parking: 1-car garage
- Security: Controlled access
- Home design: Located in Ft. Lauderdale Ocean View subdivision; Facing direction not specified; Entry level not specified; Property type not specified; Stories not specified
- Construction: Built in 1972
- Exterior features: Deck; Patio; Porch; Dock; Controlled access
Interior
- Kitchen: Dishwasher; Microwave; Pantry; Refrigerator
- Flooring: Tile; Carpet
- Interior features: Skylights; Sunroom; Deck; Patio; Porch; Dock; Controlled access
Neighborhood map
What this means for you Summary
Snapshot
- This is a 1-bed/1.0-bath condo listed at $390k.
Deal economics
- At list price, monthly cash flow is $-1k ($-14k/yr) — negative.
- To cash-flow at today's rent, offer at most $375k (3.8% below list).
- To meet the 1% rule (rent ≥ 1% of price), the offer needs to be $334k (14.3% below list).
- Recommended offer: $334k (14.3% below list) — sets the bar for 1% rule.
- Cap rate 2.8% vs local median 2.2% in Fort Lauderdale — meaningfully above typical; check what's discounted (condition, days-on-market, listing class) to confirm the premium yield is real.
Location & tenants
- Location reads 82/100 on livability (#78 in FL, #1,293 nationally) — a professional / high-income tenant draw. Strengths: crime A+, amenities A+, health & safety A+; Watch: cost of living D-.
- Broward (suburban): math 42% / reading 53% proficiency, ranked #46 of 73 in FL (top 63%) — families likely to look elsewhere, expect single-tenant / working-renter base with shorter leases.
- Market conditions: Rents rising (+3.6%/yr); 739 active listings in the ZIP; 31 comparable units currently listed for rent nearby; rentals at typical pace (median 18d on market — plan ~3-4 weeks tenant-placement turnaround); solid renter incomes; 2,111 units permitted in Broward County in 2024 (1,265 in 5+ unit buildings).
- This rent runs 43% of the median local income ($94k/yr) — at the standard rent-burdened threshold; future hikes will face affordability resistance.
Forward outlook
- Local home prices are declining (-3.0%/yr); year-one equity from $3k of loan paydown is wiped out by about $12k of value loss. Plan a longer hold.
- Broward County population projected at +34% by 2050 — long-run rental-demand tailwind backs the buy-and-hold thesis.
Negotiation context
- It's been on market 34 days — a 3% lower offer ($378k) is reasonable based on typical stale-listing flexibility.
- Current owner paid $175k; list at $390k implies a 123% gain — meaningful room to come down on a strong offer.
Risks & watch-outs
- Watch-outs: HOA is 32% of rent.
- Climate carrying-cost: severe wind risk, 99% chance of damaging wind over 30y; extreme-heat days projected 6→23/yr by 2055 (HVAC capex compounding) — expect insurance premiums to compound above CPI over the hold.
Questions for the listing agent
- What do current leases actually rent for vs. the listed asking? Can we see a recent rent roll and the last 12 months of T-12 income?
- It's been on market 34 days. Have you received any prior offers? Is the seller open to a 14% concession, seller financing, or rate buy-down credit?
- Built in 1972 — when were the roof, HVAC, electrical panel, plumbing, and water heater last replaced?
- What does the HOA fee cover, when was the last increase, and are there any pending special assessments or reserve-fund shortfalls?
- Any open or pending special assessments — roof, HVAC, plumbing, elevator, façade? What's the per-unit balance and payoff schedule, and is the seller paying it off at close or rolling it to the buyer?
- Is there a deadline driving the sale (1031 exchange, divorce, estate, relocation)? That informs how much negotiation room exists.
- Schools are B-rated — typically a magnet for longer-tenancy family renters. What's the average tenant stay here, and is there a school-zone premium baked into asking?
- The area grade is low — what's the realistic commute time and amenity access for the typical tenant pool here? Any planned neighborhood developments (good or bad) we should know about?
- What's the average days-on-market for RENTAL listings here right now (not sales)? A rising rental-DOM trend means longer vacancies and softer asking-rent achievability than the comps imply.
- What's the recent tenant-quality profile in this submarket — average credit score on applications, eviction rate, late-payment / NSF rate, and stable-employment percentage? A property-management company in the area should have these aggregated.
- How much new apartment / multifamily construction is in the pipeline within 1–3 miles? Heavy new supply (>2% of stock underway) typically softens rents 12–24 months out; light construction supports rent growth.
Investment metrics
- 1% rule
- 0.86% ✗
- Cap rate
- 2.79%
- Cash-on-cash
- -12.50%
- DSCR
- 0.44
- GRM
- 9.7
CMA / ARV
No comps found within radius.
Projected returns pro-forma
-3.0% appreciation · 3.63% rent growth · sell at horizon
- IRR
- -38.0%
- Equity multiple
- -0.22×
- Total profit
- $-132,821
- Equity at exit
- $58,148
- IRR
- -47.6%
- Equity multiple
- -0.81×
- Total profit
- $-197,214
- Equity at exit
- $33,719
Cash invested: $109,197 (down + closing). Projections, not guarantees.
Landlord ↔ Tenant lean methodology
- Overall (STATE)
- 87 Strongly Landlord-Friendly
- State Florida
- 87 Strongly Landlord-Friendly · R+3
- County
- — inherits STATE
- City
- — inherits STATE
ZIP-level market 33308
- Rents YoY
- 3.6%
- Active inventory
- 739
- Price-to-rent
- 9.7×
Monthly cashflow live
- Estimated rent
- $3,341 high interval (Pro) →
- Mortgage (P&I)
- −$2,045
- Tax from tax record
- −$516 /mo · $6,187/yr
- Insurance
- −$162
- HOA est. from 3 same-building comps
- −$1,054
- Vacancy / Maint / Mgmt
- −$702
- Net cashflow
- $-1,138
Break-even live
UW: 25.0% down · 7.5% · 30yr · 1.5% tax · 5.0% vac · 8.0% maint · 8.0% mgmt
Financing live
Cash to close
- Down payment
- $97,497
- Closing costs
- $11,700
- Reserves months
- —
- Total cash needed
- —
Loan-product check · same deal, 3 products live
Conventional
25% down · 7.5% · 30yr
- Down + closing
- —
- Monthly P&I
- —
- Monthly cashflow
- —
- DSCR
- —
- Eligible?
- —
Personal DTI + credit; lowest rate.
DSCR
20% down · 8.5% · 30yr
- Down + closing
- —
- Monthly P&I
- —
- Monthly cashflow
- —
- DSCR
- —
- Eligible?
- —
No personal income docs; deal must DSCR.
Hard money
10% down · 12.0% · 12mo
- Down + closing
- —
- Monthly P&I
- —
- Monthly cashflow
- —
- DSCR
- —
- Eligible?
- —
Short-term bridge; refi at stabilization.
Rent comps 31 comps
| Address | Beds | Baths | Sqft | Rent | $/sqft | DOM | Units | Dist |
|---|---|---|---|---|---|---|---|---|
| 4013 N Ocean Dr #102 Fort Lauderdale, FL | 1.0 | 1.5 | 790 | $3,500 | $4.43 | 24d | 1 | 0.22mi |
| 4010 Galt Ocean Dr Fort Lauderdale, FL | 2.0–3.0 | 2.0 | 810 | $3,200 | $3.95 | 4d | 3 | 0.22mi |
| 4010 Galt Ocean Dr Fort Lauderdale, FL | 2.0–3.0 | 2.0 | 810 | $5,000 | $6.17 | 5d | 2 | 0.22mi |
| 3900 Galt Ocean Dr Fort Lauderdale, FL | 2.0 | 1.5–2.0 | 1429 | $4,675 | $3.27 | 16d | 3 | 0.29mi |
| 3900 Galt Ocean Dr Fort Lauderdale, FL | 1.0–2.0 | 1.5–2.0 | 1429 | $3,100 | $2.17 | 17d | 4 | 0.29mi |
| 3850 Galt Ocean Dr #1003 Fort Lauderdale, FL | 1.0 | 1.5 | 1050 | $3,300 | $3.14 | 24d | 1 | 0.34mi |
| 3800 Galt Ocean Dr Fort Lauderdale, FL | 1.0–2.0 | 1.5–2.0 | 1071 | $3,300 | $3.08 | 4d | 6 | 0.38mi |
| 3800 Galt Ocean Dr Fort Lauderdale, FL | 1.0–2.0 | 1.5–2.0 | 1071 | $3,200 | $2.99 | 2d | 7 | 0.38mi |
| 3800 Galt Ocean Dr Fort Lauderdale, FL | 1.0–2.0 | 1.5–2.0 | 1071 | $3,400 | $3.17 | 14d | 6 | 0.38mi |
| 4144 El Mar Dr Unit 1 Lauderdale-By-The-Sea, FL | 2.0 | 2.0 | 1116 | $3,250 | $2.91 | 24d | 1 | 0.39mi |
| 3700 Galt Ocean Dr Fort Lauderdale, FL | 1.0–2.0 | 1.5–2.0 | 1025 | $3,500 | $3.41 | 24d | 2 | 0.45mi |
| 3500 Galt Ocean Dr #2314 Fort Lauderdale, FL | 1.0 | 1.5 | 1088 | $4,500 | $4.14 | 24d | 1 | 0.59mi |
| 3500 Galt Ocean Dr #2314 Fort Lauderdale, FL | 1.0 | 1.5 | 1088 | $4,500 | $4.14 | 4d | 1 | 0.59mi |
| 3605 NE 32nd Ave Unit 209A Fort Lauderdale, FL | 2.0 | 2.0 | 1000 | $3,300 | $3.30 | 1d | 1 | 0.61mi |
| 3605 NE 32nd Ave Unit 209A Fort Lauderdale, FL | 2.0 | 2.0 | 1000 | $3,300 | $3.30 | 20d | 1 | 0.61mi |
| 3430 Galt Ocean Dr Fort Lauderdale, FL | 1.0–4.0 | 1.5–4.5 | 2873 | $3,980 | $1.39 | 7d | 4 | 0.65mi |
| 3430 Galt Ocean Dr Fort Lauderdale, FL | 1.0–2.0 | 1.5–2.0 | 1343 | $3,200 | $2.38 | 15d | 4 | 0.65mi |
| 4800 Bayview Dr #303 Fort Lauderdale, FL | 2.0 | 2.0 | 1032 | $3,500 | $3.39 | 24d | 1 | 0.83mi |
| 4512 Sea Grape Dr Unit 1 Lauderdale-By-The-Sea, FL | 1.0 | 1.0 | 853 | $3,500 | $4.10 | 24d | 1 | 0.91mi |
| 3031 N Ocean Blvd Fort Lauderdale, FL | 2.0–3.0 | 2.0 | 1325 | $3,475 | $2.62 | 17d | 3 | 0.95mi |
| 3031 N Ocean Blvd Fort Lauderdale, FL | 2.0–3.0 | 2.0 | 1290 | $3,400 | $2.63 | 7d | 3 | 0.95mi |
| 3031 N Ocean Blvd Fort Lauderdale, FL | 2.0–3.0 | 2.0 | 1290 | $3,200 | $2.48 | 4d | 4 | 0.95mi |
| 4564 El Mar Dr #4 Lauderdale by the Sea, FL | 1.0 | 1.0 | 566 | $3,500 | $6.18 | 17d | 1 | 1.01mi |
| 3020 NE 32nd Ave Fort Lauderdale, FL | 1.0–2.0 | 1.0–2.0 | 920 | $3,200 | $3.48 | 4d | 4 | 1.03mi |
| 2900 NE 30th St Unit H6 Fort Lauderdale, FL | 2.0 | 2.0 | 1040 | $3,200 | $3.08 | 24d | 1 | 1.08mi |
| 2841 N Ocean Blvd Fort Lauderdale, FL | 2.0 | 2.0 | 1150 | $3,700 | $3.22 | 14d | 3 | 1.11mi |
| 4900 N Ocean Blvd #1601 Lauderdale by the Sea, FL | 1.0 | 1.5 | 1000 | $4,000 | $4.00 | 24d | 1 | 1.24mi |
| 4900 N Ocean Blvd #1209 Lauderdale by the Sea, FL | 1.0 | 2.0 | 960 | $4,100 | $4.27 | 14d | 1 | 1.24mi |
| 5000 N Ocean Blvd #506 Lauderdale by the Sea, FL | 1.0 | 1.5 | 1080 | $3,900 | $3.61 | 24d | 1 | 1.31mi |
| 5100 N Ocean Blvd #502 Lauderdale by the Sea, FL | 1.0 | 1.5 | 1080 | $3,400 | $3.15 | 24d | 1 | 1.38mi |
| 2317 N Ocean Blvd Fort Lauderdale, FL | 2.0 | 1.5 | 980 | $4,000 | $4.08 | 24d | 1 | 1.49mi |
HOA detail condo
- Monthly dues
- $0 · $0/yr
- Likely covers
- poolgym
- Assessments
- None detected in remarks — confirm with the listing agent.
Listing history 16 events
-
2026-06-18days on market $389,988 Active 34 DOM
-
2026-06-17days on market $389,988 Active 33 DOM
-
2026-06-16days on market $389,988 Active 32 DOM
-
2026-06-15days on market $389,988 Active 31 DOM
-
2026-06-13days on market $389,988 Active 29 DOM
-
2026-06-09days on market $389,988 Active 25 DOM
-
2026-06-07days on market $389,988 Active 23 DOM
-
2026-06-04days on market $389,988 Active 20 DOM
-
2026-06-03days on market $389,988 Active 19 DOM
-
2026-06-02days on market $389,988 Active 18 DOM
-
2026-06-01days on market $389,988 Active 17 DOM
-
2026-05-31days on market $389,988 Active 16 DOM
-
2026-05-16$389,988 Active
-
2003-06-17soldstatus $175,000
-
1982-12-01soldstatus $72,000
-
1978-10-01soldstatus $54,200
ⓘ Source: listings_history table (triggers on properties + properties_extension) + one-shot
backfill from property_details.listing_events for pre-trigger history.
Tax reassessment forecast FL · Resets to sale price
- Current annual tax
- $6,187 · $516/mo
- Projected year-2 tax
- $6,187 · $516/mo
- Expected delta
- $0/yr ($0/mo · 0.0%)
ⓘ Screening estimate from a state-policy table — verify with the county assessor before closing.
Climate risk First Street
- Flood 1/10 Low FEMA zone X (unshaded) · 0% chance over 30 yrs
- Wildfire 1/10 Low
- Heat 10/10 Extreme 6 d/yr ≥105°F today · 23 d/yr by 30 yrs out
- Wind 10/10 Extreme 99% chance of damaging wind over 30 yrs
- Air quality 2/10 Low 1 unhealthy d/yr today · 2 by 30 yrs out
Nearby sold comps map
Loading sold comps map…
Walkable amenities ~0.75 mi
Loading nearby amenities…
Taxation est. · year 1
- Rental income
- $40,091
- − Mortgage interest
- −$21,845
- − Property taxes
- −$6,187
- − Insurance
- −$1,950
- − Repairs & maintenance
- −$3,207
- − Management
- −$3,207
- − HOA
- −$12,648
- − Depreciation
- −$11,345
- Taxable loss
- −$20,299
- Est. tax savings @ 24.0%
- +$4,872
- After-tax cash flow
- $-8,783/yr
For passive investors: Depreciation is non-cash, so a rental often shows a tax loss while cash-flowing — sheltering income. Rental losses are passive: they offset passive income freely, and up to $25,000/yr can offset ordinary (W-2) income if you actively participate and your MAGI is under $100k (phasing out to $0 by $150k); unused losses carry forward. On sale, claimed depreciation is recaptured at up to 25%, and gains may owe capital-gains tax (a 1031 exchange can defer both). Figures are a year-1 estimate at your 24.0% rate — not tax advice; consult a CPA.
Schools (NCES district)
- District
- Broward
- NCES district ID
- 1200180
- Math proficiency
- 42% ▼ -18.00%
- Reading proficiency
- 53% ▼ -5.00%
- Median HH income
- $52,139
- Composite
- 40.88/100
- National rank
- #3621
- State rank
- #46 of 73 in FL
Livability — Fort Lauderdale
- Score
- 82/100
- State rank
- #78
- US rank
- #1293
Category grades
Schools grade is shown separately in the Schools card above.
Census & demographics
- Census place
- Fort Lauderdale, FL
- County
- Broward County · 1,963,430 people
- City population
- 235,769
- Metro
- Miami-Fort Lauderdale-Pompano Beach, FL
- Population (ZIP)
- 27,935
- Household income
- $93,879
- Rent vs Own
- Severe rent burden
- 912.0
Population outlook (Broward County) Hauer SSP2
- Today (2025)
- 2,207,033 people
- By 2030
- 2,360,704 · +7.0%
- By 2040
- 2,661,208 · +20.6%
- By 2050
- 2,946,698 · +33.5%
- By 2075
- 3,602,273 · +63.2%
- By 2100
- 3,970,984 · +79.9%
Race, ethnicity, and origin ACS 2023
- Neighborhood character
- Predominantly White (75%)
- Race & ethnicity
- White 75% Hispanic / Latino 16% Two or more races 14% Asian 3% Black 2%
- Hispanic origin (detail)
- Puerto Rican 2% Cuban 3%
- Common ancestry
- Romanian 4% Lithuanian 3% Scotch-Irish 3%
- Foreign-born
- 24% · Canada, Jamaica, Dominican Republic
- Languages at home
- 75% English-only · Spanish 14% Other Indo-European 5% Russian/Polish/Slavic 2%
Political lean MEDSL · Broward
- 2024 margin
- D (+17.0) · D 58.0% · R 41.0%
- 2008→2024 swing
- -17.8pp toward R · 2008: 34.7pp · 2024: 17.0pp
- All cycles
- 2024: D+17.0 2020: D+29.8 2016: D+35.0 2012: D+34.9 2008: D+34.7
Not yet ingested
- Civics
- —
Market trends
- HPI YoY
- ▼ -417.95%
- Current HPI
- 325.3902
- Rent YoY
- ▲ 3.63%
- Metro
- Miami-Fort Lauderdale-Pompano Beach, FL
- State GDP YoY
- ▲ 3.28%
- F500 in state
- 36
Industry mix (Fortune 500 HQ in FL)
| Industry | F500 HQs | Revenue |
|---|---|---|
| Industrial Technology | 2 | $29B |
|
||
| Insurance | 2 | $17B |
|
||
| Retail | 1 | $60B |
|
||
| Technology Distribution | 1 | $58B |
|
||
| Homebuilding | 1 | $35B |
|
||
| Technology Manufacturing | 1 | $35B |
|
||
Price history
+619.5% since first listed4 events — show timeline
- 2026-05-16 Listed $389,988 FSBO.com
- 2003-06-17 Sold (Public Records) $175,000 Public Records
- 1982-12-01 Sold (Public Records) $72,000 Public Records
- 1978-10-01 Sold (Public Records) $54,200 Public Records
Property tax history
+5.4%/yrLatest (2025): $6,187 · -4.8% YoY. Source: county tax records.
Cash-flow waterfall
monthlySold comps — $/sqft
last 12 mo · ≤1 miLoading sold comps…