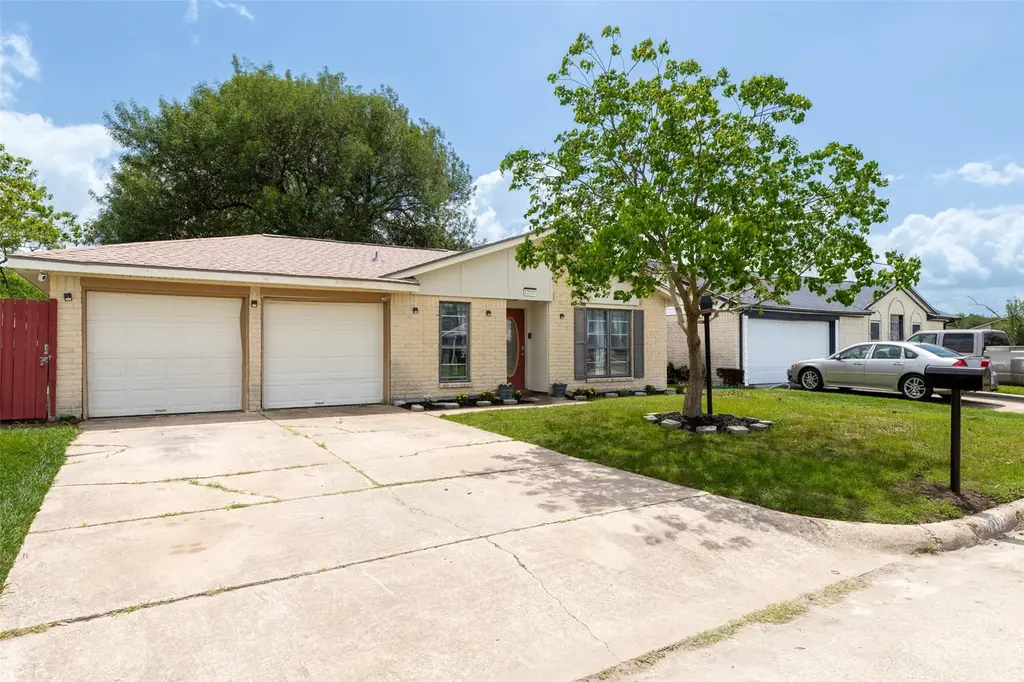
12127 Glenhollow Dr · Houston, TX
Flood risk 8/10 · Major
- FEMA flood zone
- X (unshaded)
- Chance of flooding over 30 yrs
- 0.99%
- Est. flood insurance / yr
- $507 – $1,088
Fire risk 1/10 · Minimal
- Est. fire insurance / yr
- $1,222 – $2,270
Heat risk 9/10 · Severe
- Hot days now (above 108°F)
- 7 days/yr
- Hot days in 30 yrs
- 24 days/yr
Wind risk 9/10 · Severe
- Chance of severe wind over 30 yrs
- 99.0%
Air-quality risk 2/10 · Minimal
- Unhealthy air days now
- 1 days/yr
- Unhealthy air days in 30 yrs
- 2 days/yr
Risk factors via First Street. Map © Google.
Why this score? — see what drove the D+ grade
The composite is a weighted blend of 9 inputs, each scored 0–100. Each bar is that input's sub-score; the figure is the points it added to the 100-point composite (weight × sub-score).
- ARV discount +12.0/15.0
- Cash flow +11.7/30.0
- Appreciation +6.3/10.0
- 1% rule +3.7/10.0
- Livability +3.7/5.0
- DSCR +3.5/10.0
- Rent growth +2.8/5.0
- Schools +2.7/10.0
- Condition / age +2.5/5.0
$179,000
🖨 Deal sheet (PDF) 📄 Offer letter ✓ Due diligence
Listing remarks
Looking for a 3-bedroom, 1.5-bath brick home close to everything at an affordable price? Look no further—12127 Glenhollow is the perfect place for you! This property features a two-car attached garage, a formal living area, ceiling fans throughout, and a combination of tile and carpet flooring. The kitchen offers ample cabinet space, quartz counters, stainless steel appliances, and stylish countertops. Enjoy a manicured lawn and a spacious backyard, perfect for entertaining family and friends. Conveniently located with easy access to Highways 288, 610, and the Sam Houston Tollway. Close to schools, parks, grocery stores, NRG Stadium, SW Houston, and 15 minutes from the Medical Center.
Key facts
- Formal living area
- Ceiling fans
- Brick home
Tags
Property features AI
Exterior
- Parking: Attached 2-car garage; Additional parking
- Utilities: Public water; Public sewer
- Home design: Residential property; Single-story (first-floor living); Slab foundation
- Construction: Brick construction; Composition roof; Built in 1974; Slab foundation
- Exterior features: Fenced backyard; Private yard; Subdivision lot
Interior
- Kitchen: Dishwasher; Electric oven; Electric range; Pantry and quartz countertops
- Bedrooms: Three possible bedrooms (all on the first floor); Primary bedroom on the first floor; Additional bedrooms on the first floor
- Flooring: Carpet; Tile
- Bathrooms: One full bathroom; One half bathroom; Primary bath in primary bedroom
- Heating & cooling: Central heating (electric); Central air conditioning (electric)
- Interior features: Primary bedroom with private bath; Pantry; Quartz counters; Tub/shower; Ceiling fans; Kitchen/dining combo
- Laundry & utility: Washer hookup; Electric dryer hookup; Utility room on the first floor
Neighborhood map
What this means for you Summary
Snapshot
- This is a 3-bed/2.0-bath single-family listed at $179k.
Deal economics
- At list price, monthly cash flow is $-117 ($-1k/yr) — negative.
- To cash-flow at today's rent, offer at most $158k (11.6% below list).
- To meet the 1% rule (rent ≥ 1% of price), the offer needs to be $155k (13.2% below list).
- Recommended offer: $155k (13.2% below list) — sets the bar for 1% rule.
- Cap rate 6.0% vs local median 3.2% in Houston — top-decile yield for the area; either an underpriced asset or a hidden risk that comps aren't pricing in. Stress-test before assuming the spread holds.
Location & tenants
- Location reads 74/100 on livability (#184 in TX, #4,771 nationally) — a middle-class / working-renter tenant base. Strengths: amenities A+, cost of living A+, housing A+; Watch: crime F.
- Houston ISD (urban): math 27% / reading 35% proficiency, ranked #593 of 826 in TX (top 72%) — families likely to look elsewhere, expect single-tenant / working-renter base with shorter leases; 71% free/reduced lunch — lower-income household profile, screen leases tightly.
- Zoned schools: Codwell El (math 8% / reading 22%, grade F, #4,021 of 4,322 statewide, top 94%, 329 students, 93% FRL); Thomas Middle (math 3% / reading 13%, grade F, #1,654 of 1,662 statewide, top 100%, 526 students, 98% FRL); Sterling H S (math 16% / reading 27%, grade F, #1,377 of 1,632 statewide, top 85%, 1,421 students, 92% FRL) — zoned schools average 95% FRL vs 71% district-wide (23 pts higher); higher-poverty schools than district average — tighter screening recommended.
- Zoned-school proficiency averages 15% at this address vs 31% district-wide (-16 pts) — the specific schools serving this property underperform the Houston ISD average; the district grade overstates school quality for this exact location.
- Market conditions: Rents rising (+1.2%/yr); 305 active listings in the ZIP; 27 comparable units currently listed for rent nearby; rentals leasing fast (median 10d on market — plan ~1-2 weeks tenant-placement turnaround); 29,883 units permitted in Harris County in 2024 (8,621 in 5+ unit buildings).
- This rent runs 33% of the median local income ($57k/yr) — at the standard rent-burdened threshold; future hikes will face affordability resistance.
Forward outlook
- In year one you build about $6k of equity ($1k loan paydown + $5k appreciation (2.6% local appreciation)).
- Harris County population projected at +47% by 2050 — long-run rental-demand tailwind backs the buy-and-hold thesis.
- By year 6, paydown + projected appreciation supports a ~$31k cash-out refi (75% LTV) — recoverable capital for the next deal without selling this one.
Negotiation context
- It's been on market 64 days — a 6% lower offer ($168k) is reasonable based on typical stale-listing flexibility.
Risks & watch-outs
- Watch-outs: flood insurance adds $66/mo.
- Climate carrying-cost: severe flood risk; severe wind risk, 99% chance of damaging wind over 30y; extreme-heat days projected 7→24/yr by 2055 (HVAC capex compounding) — expect insurance premiums to compound above CPI over the hold.
Questions for the listing agent
- What do current leases actually rent for vs. the listed asking? Can we see a recent rent roll and the last 12 months of T-12 income?
- It's been on market 64 days. Have you received any prior offers? Is the seller open to a 13% concession, seller financing, or rate buy-down credit?
- Built in 1974 — when were the roof, HVAC, electrical panel, plumbing, and water heater last replaced?
- What's the actual annual flood-insurance premium (NFIP or private), and is the property in a SFHA with mandatory coverage?
- Why hasn't it sold? Are there any deal-killer items the seller is aware of (foundation, flood, title, zoning, code violations)?
- Is there a deadline driving the sale (1031 exchange, divorce, estate, relocation)? That informs how much negotiation room exists.
- Schools are D-rated, which usually means shorter tenancies and higher turnover. Who's the typical renter profile here, and what's been the actual vacancy rate?
- Crime grade is F in this area — have there been break-ins, vandalism, or insurance claims at this property in the last 3 years? What carrier currently insures it and at what premium?
- The area grade is low — what's the realistic commute time and amenity access for the typical tenant pool here? Any planned neighborhood developments (good or bad) we should know about?
- What's the average days-on-market for RENTAL listings here right now (not sales)? A rising rental-DOM trend means longer vacancies and softer asking-rent achievability than the comps imply.
- What's the recent tenant-quality profile in this submarket — average credit score on applications, eviction rate, late-payment / NSF rate, and stable-employment percentage? A property-management company in the area should have these aggregated.
- How much new for-sale + rental construction is in the pipeline within 1–3 miles? Heavy new supply typically softens prices + rents 12–24 months out; constrained supply supports both.
Investment metrics
- 1% rule
- 0.87% ✗
- Cap rate
- 5.95%
- Cash-on-cash
- -1.22%
- DSCR
- 0.95
- GRM
- 9.6
CMA / ARV
- ARV (median comp)
- $198,666
- List price
- $179,000
- Delta
- -9.90%
- Verdict
- FAIR
- Comps
- 20 within 1.0 mi
Show comp detail 12 sales within ~0.75 mi
| Address | Dist | Beds/Ba | Sqft | Sold | Price | $/sf | Match |
|---|---|---|---|---|---|---|---|
| 5119 Kilkenny Dr | 0.13mi | 3/1.5 | 991 (-9%) | 11mo | $130,000 | $131 | 67 |
| 12127 Redfern Dr | 0.05mi | 3/2.0 | 1,250 (+14%) | 8mo | $234,900 | $188 | 67 |
| 11822 Greenshire Dr | 0.55mi | 3/2.0 | 1,100 (+1%) | 11mo | $215,000 | $195 | 64 |
| 5319 Bungalow Ln | 0.48mi | 3/2.0 | 1,146 (+5%) | 11mo | $209,900 | $183 | 60 |
| 5107 Bungalow Ln | 0.42mi | 3/2.0 | 1,189 (+9%) | 10mo | $199,000 | $167 | 57 |
| 5135 Fairgreen Ln | 0.35mi | 3/1.0 | 938 (-14%) | 6mo | $151,500 | $162 | 51 |
| 5306 Bungalow Ln | 0.43mi | 3/1.5 | 1,215 (+11%) | 13mo | $159,000 | $131 | 48 |
| 11511 Lockgate Ln | 0.66mi | 3/1.5 | 1,176 (+8%) | 12mo | $145,000 | $123 | 45 |
| 11519 Roandale Dr | 0.72mi | 3/1.0 | 1,104 (+1%) | 23mo | $180,000 | $163 | 42 |
| 5210 Russelville Rd | 0.25mi | 4/2.0 (+1) | 1,252 (+15%) | 23mo | $164,995 | $132 | 40 |
| 11810 Greenshire Dr | 0.57mi | 3/2.0 | 1,210 (+11%) | 19mo | $205,000 | $169 | 40 |
| 11507 Roandale Dr | 0.75mi | 4/2.0 (+1) | 1,194 (+9%) | 13mo | $195,000 | $163 | 33 |
Match score weights: distance 35% · size 25% · config 20% · recency 20%. Top-matched comps best support the ARV.
Projected returns pro-forma
2.61% appreciation · 1.17% rent growth · sell at horizon
- IRR
- 2.8%
- Equity multiple
- 1.15×
- Total profit
- $7,710
- Equity at exit
- $76,602
- IRR
- 5.5%
- Equity multiple
- 1.78×
- Total profit
- $39,139
- Equity at exit
- $115,118
Cash invested: $50,120 (down + closing). Projections, not guarantees.
Landlord ↔ Tenant lean methodology
- Overall (STATE)
- 87 Strongly Landlord-Friendly
- State Texas
- 87 Strongly Landlord-Friendly · R+5
- County
- — inherits STATE
- City
- — inherits STATE
ZIP-level market 77048
- Home prices YoY
- 1.0%
- Rents YoY
- 1.2%
- Active inventory
- 305
- Price-to-rent
- 9.6×
Monthly cashflow live
- Estimated rent
- $1,553 high interval (Pro) →
- Mortgage (P&I)
- −$939
- Tax from tax record
- −$265 /mo · $3,180/yr
- Insurance
- −$75
- Flood insurance flood zone
- −$66 /mo · $798/yr
- HOA
- −$0
- Vacancy / Maint / Mgmt
- −$326
- Net cashflow
- $-117
Break-even live
Sensitivity live
| Price | -10% $-16 | -5% $-67 | +0% $-117 | +5% $-168 | +10% $-219 |
|---|---|---|---|---|---|
| Rent | -10% $-240 | -5% $-179 | +0% $-117 | +5% $-56 | +10% $5 |
| Rate | -1.0pp $-27 | -0.5pp $-72 | base $-117 | +0.5pp $-164 | +1.0pp $-211 |
UW: 25.0% down · 7.5% · 30yr · 1.5% tax · 5.0% vac · 8.0% maint · 8.0% mgmt
Financing live
Cash to close
- Down payment
- $44,750
- Closing costs
- $5,370
- Reserves months
- —
- Total cash needed
- —
Loan-product check · same deal, 3 products live
Conventional
25% down · 7.5% · 30yr
- Down + closing
- —
- Monthly P&I
- —
- Monthly cashflow
- —
- DSCR
- —
- Eligible?
- —
Personal DTI + credit; lowest rate.
DSCR
20% down · 8.5% · 30yr
- Down + closing
- —
- Monthly P&I
- —
- Monthly cashflow
- —
- DSCR
- —
- Eligible?
- —
No personal income docs; deal must DSCR.
Hard money
10% down · 12.0% · 12mo
- Down + closing
- —
- Monthly P&I
- —
- Monthly cashflow
- —
- DSCR
- —
- Eligible?
- —
Short-term bridge; refi at stabilization.
Rent comps 27 comps
| Address | Beds | Baths | Sqft | Rent | $/sqft | DOM | Units | Dist |
|---|---|---|---|---|---|---|---|---|
| 12227 Cape Hyannis Dr Houston, TX | 3.0 | 2.0 | 1432 | $1,705 | $1.19 | 15d | 1 | 0.45mi |
| 5425 E Orem Dr Houston, TX | 1.0–3.0 | 1.0–2.0 | 910 | $1,499 | $1.65 | 1d | 13 | 0.47mi |
| 11917 Martin Luther King Blvd Houston, TX | 2.0 | 1.0 | 805 | $1,025 | $1.27 | 24d | 1 | 0.49mi |
| 11917 Martin Luther King Blvd Houston, TX | 2.0 | 1.0 | 805 | $1,025 | $1.27 | 20d | 1 | 0.49mi |
| 11911 Martin Luther King Junior Blvd Houston, TX | 1.0–2.0 | 1.0 | 701 | $1,050 | $1.50 | 9d | 1 | 0.57mi |
| 11319 Murr Way Houston, TX | 3.0 | 1.5 | 1213 | $1,699 | $1.40 | 20d | 1 | 0.78mi |
| 5602 Selinsky Rd Unit 422 Houston, TX | 2.0 | 2.0 | 1062 | $1,089 | $1.03 | 9d | 1 | 0.85mi |
| 5602 Selinsky Rd Unit 421 Houston, TX | 2.0 | 2.0 | 1062 | $1,089 | $1.03 | 7d | 1 | 0.85mi |
| 5602 Selinsky Rd Unit 510 Houston, TX | 3.0 | 2.0 | 1167 | $1,313 | $1.13 | 13d | 1 | 0.85mi |
| 5602 Selinsky Rd Unit 5659 Houston, TX | 2.0 | 2.0 | 1062 | $1,113 | $1.05 | 12d | 1 | 0.85mi |
| 5602 Selinsky Rd Unit 2187 Houston, TX | 2.0 | 2.0 | 1062 | $1,073 | $1.01 | 0d | 1 | 0.85mi |
| 5602 Selinsky Rd Unit 3187 Houston, TX | 3.0 | 2.0 | 1167 | $1,273 | $1.09 | 0d | 1 | 0.85mi |
| 5602 Selinsky Rd Unit 2047 Houston, TX | 2.0 | 2.0 | 1062 | $1,114 | $1.05 | 0d | 1 | 0.85mi |
| 5602 Selinsky Rd Unit 3047 Houston, TX | 3.0 | 2.0 | 1167 | $1,324 | $1.13 | 13d | 1 | 0.85mi |
| 5602 Selinsky Rd Unit 2047 Houston, TX | 2.0 | 2.0 | 1062 | $1,113 | $1.05 | 5d | 1 | 0.85mi |
| 4015 Marchant Rd Houston, TX | 3.0 | 2.0 | 1200 | $1,700 | $1.42 | 45d | 1 | 1.01mi |
| 5426 Greylog Dr Houston, TX | 3.0 | 2.0 | 1205 | $1,750 | $1.45 | 26d | 1 | 1.02mi |
| 13555 Cullen Blvd Houston, TX | 1.0–3.0 | 1.0–2.0 | 917 | $1,900 | $2.07 | 45d | 35 | 1.03mi |
| 3918 Almeda-Genoa Rd Houston, TX | 1.0–3.0 | 1.0–2.0 | 1038 | $2,220 | $2.14 | 0d | 26 | 1.03mi |
| 13561 Cullen Blvd Houston, TX | 2.0 | 2.0 | 990 | $1,450 | $1.46 | 45d | 1 | 1.05mi |
| 11819 Leitrim Way Houston, TX | 3.0 | 1.0 | 1476 | $1,150 | $0.78 | 7d | 1 | 1.10mi |
| 13427 Lucky Bill Ln Houston, TX | 3.0 | 2.5 | 1443 | $2,095 | $1.45 | 9d | 1 | 1.11mi |
| 13442 Lucky Bill Ln Houston, TX | 3.0 | 2.0 | 1427 | $2,195 | $1.54 | 24d | 1 | 1.15mi |
| 4322 Groton Dr Houston, TX | 3.0 | 1.0 | 858 | $1,395 | $1.63 | 45d | 1 | 1.20mi |
| 10902 Faircroft Dr Houston, TX | 3.0 | 1.0 | 1308 | $1,455 | $1.11 | 0d | 1 | 1.23mi |
| 4071 Schurmier Rd Unit SLC2 Houston, TX | 2.0 | 2.0 | 990 | $1,575 | $1.59 | 5d | 1 | 1.39mi |
| 13958 Cottingham St Houston, TX | 1.0–2.0 | 1.0–2.0 | 1048 | $1,825 | $1.74 | 0d | 35 | 1.40mi |
Listing history 17 events
-
2026-06-21days on market $179,000 Active 64 DOM
-
2026-06-18days on market $179,000 Active 61 DOM
-
2026-06-17days on market $179,000 Active 60 DOM
-
2026-06-16days on market $179,000 Active 59 DOM
-
2026-06-15price $179,000 Active 58 DOM
-
2026-06-15days on market $199,000 Active 58 DOM
-
2026-06-13days on market $199,000 Active 56 DOM
-
2026-06-10days on market $199,000 Active 52 DOM
-
2026-06-08days on market $199,000 Active 51 DOM
-
2026-06-07days on market $199,000 Active 50 DOM
-
2026-06-04days on market $199,000 Active 47 DOM
-
2026-06-01days on market $199,000 Active 44 DOM
-
2026-05-31days on market $199,000 Active 43 DOM
-
2026-04-18$199,000 Active 773-char remark
-
2020-01-16soldstatus
-
2018-04-18soldstatus
-
1988-01-02soldstatus
ⓘ Source: listings_history table (triggers on properties + properties_extension) + one-shot
backfill from property_details.listing_events for pre-trigger history.
Tax reassessment forecast TX · Resets to sale price
- Current annual tax
- $3,180 · $265/mo
- Projected year-2 tax
- $3,276 · $273/mo
- Expected delta
- +$96/yr (+$8/mo · 3.0%)
ⓘ Screening estimate from a state-policy table — verify with the county assessor before closing.
Climate risk First Street
- Flood 8/10 Severe FEMA zone X (unshaded) · 99% chance over 30 yrs
- Wildfire 1/10 Low
- Heat 9/10 Extreme 7 d/yr ≥108°F today · 24 d/yr by 30 yrs out
- Wind 9/10 Extreme 99% chance of damaging wind over 30 yrs
- Air quality 2/10 Low 1 unhealthy d/yr today · 2 by 30 yrs out
Nearby sold comps map
Loading sold comps map…
Walkable amenities ~0.75 mi
Loading nearby amenities…
Taxation est. · year 1
- Rental income
- $18,642
- − Mortgage interest
- −$10,027
- − Property taxes
- −$3,180
- − Insurance
- −$1,692
- − Repairs & maintenance
- −$1,491
- − Management
- −$1,491
- − Depreciation
- −$5,207
- Taxable loss
- −$4,447
- Est. tax savings @ 24.0%
- +$1,067
- After-tax cash flow
- $-342/yr
For passive investors: Depreciation is non-cash, so a rental often shows a tax loss while cash-flowing — sheltering income. Rental losses are passive: they offset passive income freely, and up to $25,000/yr can offset ordinary (W-2) income if you actively participate and your MAGI is under $100k (phasing out to $0 by $150k); unused losses carry forward. On sale, claimed depreciation is recaptured at up to 25%, and gains may owe capital-gains tax (a 1031 exchange can defer both). Figures are a year-1 estimate at your 24.0% rate — not tax advice; consult a CPA.
Schools (NCES district)
- District
- Houston ISD
- NCES district ID
- 4823640
- Math proficiency
- 27% ▼ -18.00%
- Reading proficiency
- 35% ▼ -6.00%
- Median HH income
- $46,054
- Composite
- 26.63/100
- National rank
- #7173
- State rank
- #593 of 826 in TX
Livability — Houston
- Score
- 74/100
- State rank
- #184
- US rank
- #4771
Category grades
Schools grade is shown separately in the Schools card above.
Census & demographics
- Census place
- Houston, TX
- County
- Harris County · 4,702,590 people
- City population
- 3,226,434
- Metro
- Houston-The Woodlands-Sugar Land, TX
- Population (ZIP)
- 21,151
- Household income
- $56,747
- Rent vs Own
- Severe rent burden
- 1117.0
Population outlook (Harris County) Hauer SSP2
- Today (2025)
- 5,571,493 people
- By 2030
- 6,089,821 · +9.3%
- By 2040
- 7,142,806 · +28.2%
- By 2050
- 8,185,864 · +46.9%
- By 2075
- 10,574,329 · +89.8%
- By 2100
- 12,109,958 · +117.4%
Race, ethnicity, and origin ACS 2023
- Neighborhood character
- Predominantly Black (69%)
- Race & ethnicity
- Black 69% Hispanic / Latino 24% Two or more races 6% Asian 3% White 2%
- Hispanic origin (detail)
- Mexican 17% Puerto Rican 1%
- Foreign-born
- 12% · Canada, Vietnam
- Languages at home
- 76% English-only · Spanish 20% Tagalog/Filipino 2% Vietnamese 1%
Political lean MEDSL · Harris
- 2024 margin
- Lean D (+5.5) · D 52.0% · R 46.4% · Other 1.6%
- 2008→2024 swing
- +3.9pp toward D · 2008: 1.6pp · 2024: 5.5pp
- All cycles
- 2024: D+5.5 2020: D+13.3 2016: D+12.4 2012: D+0.1 2008: D+1.6
Not yet ingested
- Civics
- —
Market trends
- HPI YoY
- ▲ 2.61%
- Current HPI
- 266.4468
- Rent YoY
- ▲ 1.17%
- Metro
- Houston-The Woodlands-Sugar Land, TX
- State GDP YoY
- ▲ 3.95%
- F500 in state
- 110
Industry mix (Fortune 500 HQ in TX)
| Industry | F500 HQs | Revenue |
|---|---|---|
| Energy | 16 | $1,198B |
|
||
| Technology | 5 | $198B |
|
||
| Engineering / Construction | 4 | $72B |
|
||
| Energy Services | 3 | $60B |
|
||
| Utilities | 3 | $41B |
|
||
| Healthcare | 2 | $330B |
|
||
Price history
-10.1% since first listed5 events — show timeline
- 2026-06-15 Price Changed $179,000 HARMLS
- 2026-04-18 Listed $199,000 HARMLS
- 2020-01-16 Sold (Public Records) — Public Records
- 2018-04-18 Sold (Public Records) — Public Records
- 1988-01-02 Sold (Public Records) — Public Records
Property tax history
+7.4%/yrLatest (2025): $3,180 · +6.8% YoY. Source: county tax records.
Cash-flow waterfall
monthlySold comps — $/sqft
last 12 mo · ≤1 miLoading sold comps…