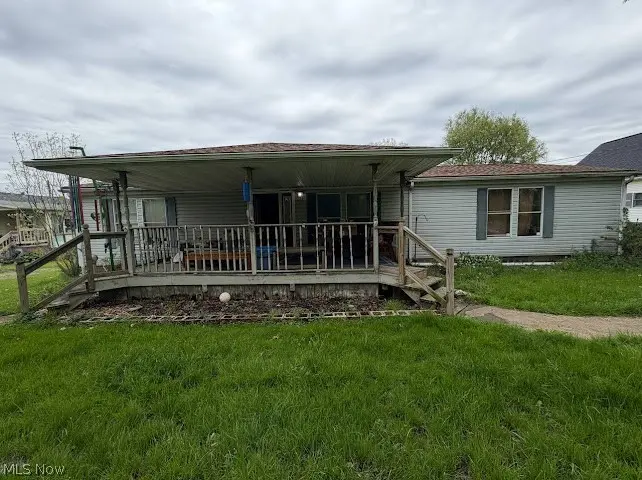
1029 Parkview Ave · McDonald, OH
Flood risk 1/10 · Minimal
- FEMA flood zone
- X (unshaded)
- Chance of flooding over 30 yrs
- 0.0%
- Est. flood insurance / yr
- $473 – $860
Fire risk 1/10 · Minimal
- Est. fire insurance / yr
- $713 – $1,323
Heat risk 3/10 · Minor
- Hot days now (above 97°F)
- 7 days/yr
- Hot days in 30 yrs
- 17 days/yr
Wind risk 1/10 · Minimal
- Chance of severe wind over 30 yrs
- —
Air-quality risk 3/10 · Minor
- Unhealthy air days now
- 1 days/yr
- Unhealthy air days in 30 yrs
- 4 days/yr
Risk factors via First Street. Map © Google.
Why this score? — see what drove the B grade
The composite is a weighted blend of 9 inputs, each scored 0–100. Each bar is that input's sub-score; the figure is the points it added to the 100-point composite (weight × sub-score).
- Cash flow +30.0/30.0
- 1% rule +10.0/10.0
- DSCR +10.0/10.0
- ARV discount +7.5/15.0
- Schools +5.3/10.0
- Livability +3.6/5.0
- Rent growth +2.5/5.0
- Condition / age +2.5/5.0
- Appreciation +0.0/10.0
$59,900
🖨 Deal sheet (PDF) 📄 Offer letter ✓ Due diligence
Listing remarks MLS
Great value is this 3 bedroom home with 2 full baths, living room, family room, 1st floor laundry closet, front porch 18 x 10, back deck, 10 x 10.
Key facts
- Ample cabinetry
- One-floor living
- Spacious kitchen
Tags
Neighborhood map
What this means for you Summary
Snapshot
- This is a 3-bed/2.0-bath manufactured listed at $60k.
Deal economics
- At list price, monthly cash flow is $666 ($8k/yr) — positive.
- The deal already cash-flows at list — no discount required.
- Meets the 1% rule at list price ($1k rent vs $60k).
- Recommended offer: $58k (3.0% below list) — sets the bar for market timing.
Location & tenants
- Location reads 72/100 on livability (#376 in OH) — a middle-class / working-renter tenant base. Strengths: schools A+, cost of living A+, housing A+; Watch: amenities F, commute F, health & safety F.
- Mcdonald Local (suburban): math 57% / reading 67% proficiency, ranked #259 of 656 in OH (top 40%) — acceptable for families but not a draw, mixed tenant base, ~2y average lease.
- Market conditions: 21 active listings in the ZIP; 1 comparable units currently listed for rent nearby; 129 units permitted in Trumbull County in 2024 (0 in 5+ unit buildings).
Forward outlook
- Local home prices are declining (-3.0%/yr); year-one equity from $414 of loan paydown is wiped out by about $2k of value loss. Plan a longer hold.
- Trumbull County population projected at -22% by 2050 — secular population decline; favor cash flow + early exit over multi-decade hold.
- At projected returns (-3.0% appreciation + 3.0% rent growth), your $17k cash investment doubles in ~3 years — after that, you're playing with house money.
Negotiation context
- It's been on market 40 days — a 3% lower offer ($58k) is reasonable based on typical stale-listing flexibility.
- 2 sale attempts since 10y ago; this cycle's ask has dropped $10k (14%) from the opening price — seller is motivated, your offer sets the floor, not the list.
- Current owner paid $32k; list at $60k implies a 87% gain — meaningful room to come down on a strong offer.
Risks & watch-outs
- Watch-outs: property tax is 2.8% of price.
Questions for the listing agent
- It's been on market 40 days. Have you received any prior offers? Is the seller open to a 3% concession, seller financing, or rate buy-down credit?
- Property tax is high relative to price — has the assessment been appealed recently, and will the sale trigger a re-assessment?
- Is there a deadline driving the sale (1031 exchange, divorce, estate, relocation)? That informs how much negotiation room exists.
- Schools are A-rated — typically a magnet for longer-tenancy family renters. What's the average tenant stay here, and is there a school-zone premium baked into asking?
- What's the average days-on-market for RENTAL listings here right now (not sales)? A rising rental-DOM trend means longer vacancies and softer asking-rent achievability than the comps imply.
- What's the recent tenant-quality profile in this submarket — average credit score on applications, eviction rate, late-payment / NSF rate, and stable-employment percentage? A property-management company in the area should have these aggregated.
- How much new for-sale + rental construction is in the pipeline within 1–3 miles? Heavy new supply typically softens prices + rents 12–24 months out; constrained supply supports both.
Investment metrics
- 1% rule
- 2.42% ✓
- Cap rate
- 19.63%
- Cash-on-cash
- 47.63%
- DSCR
- 3.12
- GRM
- 3.4
CMA / ARV
- ARV (median comp)
- $195,232
- List price
- $59,900
- Delta
- -69.32%
- Verdict
- UNDERPRICED
- Comps
- 20 within 1.0 mi
Projected returns pro-forma
-3.0% appreciation · 3.0% rent growth · sell at horizon
- IRR
- 45.1%
- Equity multiple
- 2.95×
- Total profit
- $32,752
- Equity at exit
- $8,931
- IRR
- 51.0%
- Equity multiple
- 5.97×
- Total profit
- $83,365
- Equity at exit
- $5,179
Cash invested: $16,772 (down + closing). Projections, not guarantees.
Landlord ↔ Tenant lean methodology
- Overall (STATE)
- 73 Landlord-Friendly
- State Ohio
- 73 Landlord-Friendly · R+6
- County
- — inherits STATE
- City
- — inherits STATE
ZIP-level market 44437
- Home prices YoY
- -7.8%
- Active inventory
- 21
- Price-to-rent
- 3.4×
Monthly cashflow live
- Estimated rent
- $1,450 medium interval (Pro) →
- Mortgage (P&I)
- −$314
- Tax from tax record
- −$141 /mo · $1,689/yr
- Insurance
- −$25
- HOA
- −$0
- Vacancy / Maint / Mgmt
- −$304
- Net cashflow
- $666
Break-even live
Sensitivity live
| Price | -10% $700 | -5% $683 | +0% $666 | +5% $649 | +10% $632 |
|---|---|---|---|---|---|
| Rent | -10% $551 | -5% $608 | +0% $666 | +5% $723 | +10% $780 |
| Rate | -1.0pp $696 | -0.5pp $681 | base $666 | +0.5pp $650 | +1.0pp $634 |
UW: 25.0% down · 7.5% · 30yr · 1.5% tax · 5.0% vac · 8.0% maint · 8.0% mgmt
Financing live
Cash to close
- Down payment
- $14,975
- Closing costs
- $1,797
- Reserves months
- —
- Total cash needed
- —
Loan-product check · same deal, 3 products live
Conventional
25% down · 7.5% · 30yr
- Down + closing
- —
- Monthly P&I
- —
- Monthly cashflow
- —
- DSCR
- —
- Eligible?
- —
Personal DTI + credit; lowest rate.
DSCR
20% down · 8.5% · 30yr
- Down + closing
- —
- Monthly P&I
- —
- Monthly cashflow
- —
- DSCR
- —
- Eligible?
- —
No personal income docs; deal must DSCR.
Hard money
10% down · 12.0% · 12mo
- Down + closing
- —
- Monthly P&I
- —
- Monthly cashflow
- —
- DSCR
- —
- Eligible?
- —
Short-term bridge; refi at stabilization.
Rent comps 1 comps
| Address | Beds | Baths | Sqft | Rent | $/sqft | DOM | Units | Dist |
|---|---|---|---|---|---|---|---|---|
| 3504 Oakview Dr Girard, OH | 3.0 | 1.0 | 1276 | $1,450 | $1.14 | 14d | 1 | 0.36mi |
Listing history 22 events
-
2026-06-19days on market $59,900 Active 40 DOM
-
2026-06-18days on market $59,900 Active 39 DOM
-
2026-06-17days on market $59,900 Active 38 DOM
-
2026-06-16days on market $59,900 Active 37 DOM
-
2026-06-15days on market $59,900 Active 36 DOM
-
2026-06-14days on market $59,900 Active 34 DOM
-
2026-06-13days on market $59,900 Active 33 DOM
-
2026-06-10days on market $59,900 Active 31 DOM
-
2026-06-09days on market $59,900 Active 30 DOM
-
2026-06-08days on market $59,900 Active 29 DOM
-
2026-06-07days on market $59,900 Active 28 DOM
-
2026-06-05days on market $59,900 Active 25 DOM
-
2026-06-03days on market $59,900 Active 24 DOM
-
2026-06-02days on market $59,900 Active 23 DOM
-
2026-06-01days on market $59,900 Active 22 DOM
-
2026-05-31days on market $59,900 Active 21 DOM
-
2026-05-30pricedays on market $59,900 Active 20 DOM
-
2026-05-10$69,900 Active 800-char remark
-
2017-02-10status Pending 146-char remark
Show marketing remark (146 chars)
Great value is this 3 bedroom home with 2 full baths, living room, family room, 1st floor laundry closet, front porch 18 x 10, back deck, 10 x 10.
-
2017-02-06soldstatus $32,000 Sold 146-char remark
Show marketing remark (146 chars)
Great value is this 3 bedroom home with 2 full baths, living room, family room, 1st floor laundry closet, front porch 18 x 10, back deck, 10 x 10.
-
2016-12-27historical Contingent 146-char remark
Show marketing remark (146 chars)
Great value is this 3 bedroom home with 2 full baths, living room, family room, 1st floor laundry closet, front porch 18 x 10, back deck, 10 x 10.
-
2016-12-19$40,000 Active 146-char remark
Show marketing remark (146 chars)
Great value is this 3 bedroom home with 2 full baths, living room, family room, 1st floor laundry closet, front porch 18 x 10, back deck, 10 x 10.
ⓘ Source: listings_history table (triggers on properties + properties_extension) + one-shot
backfill from property_details.listing_events for pre-trigger history.
Tax reassessment forecast OH · Partial reset (capped growth)
- Current annual tax
- $1,689 · $141/mo
- Projected year-2 tax
- $1,689 · $141/mo
- Expected delta
- $0/yr ($0/mo · 0.0%)
ⓘ Screening estimate from a state-policy table — verify with the county assessor before closing.
Climate risk First Street
- Flood 1/10 Low FEMA zone X (unshaded) · 0% chance over 30 yrs
- Wildfire 1/10 Low
- Heat 3/10 Moderate 7 d/yr ≥97°F today · 17 d/yr by 30 yrs out
- Wind 1/10 Low
- Air quality 3/10 Moderate 1 unhealthy d/yr today · 4 by 30 yrs out
Nearby sold comps map
Loading sold comps map…
Walkable amenities ~0.75 mi
Loading nearby amenities…
Taxation est. · year 1
- Rental income
- $17,400
- − Mortgage interest
- −$3,355
- − Property taxes
- −$1,689
- − Insurance
- −$300
- − Repairs & maintenance
- −$1,392
- − Management
- −$1,392
- − Depreciation
- −$1,743
- Taxable income
- $7,529
- Est. tax owed @ 24.0%
- −$1,807
- After-tax cash flow
- $6,181/yr
For passive investors: Depreciation is non-cash, so a rental often shows a tax loss while cash-flowing — sheltering income. Rental losses are passive: they offset passive income freely, and up to $25,000/yr can offset ordinary (W-2) income if you actively participate and your MAGI is under $100k (phasing out to $0 by $150k); unused losses carry forward. On sale, claimed depreciation is recaptured at up to 25%, and gains may owe capital-gains tax (a 1031 exchange can defer both). Figures are a year-1 estimate at your 24.0% rate — not tax advice; consult a CPA.
Schools (NCES district)
- District
- Mcdonald Local
- NCES district ID
- 3905022
- Math proficiency
- 57% ▼ -20.00%
- Reading proficiency
- 67% ▼ -11.00%
- Median HH income
- $49,637
- Composite
- 52.66/100
- National rank
- #1554
- State rank
- #259 of 656 in OH
Livability — McDonald
- Score
- 72/100
- State rank
- #376
- US rank
- #6131
Category grades
Schools grade is shown separately in the Schools card above.
Census & demographics
- Census place
- McDonald, OH
- County
- Trumbull · 193,293 people
- City population
- 3,900
- Metro
- Youngstown-Warren, OH
- Population (ZIP)
- 3,900
- Household income
- $72,545
- Rent vs Own
Population outlook (Trumbull County) Hauer SSP2
- Today (2025)
- 191,696 people
- By 2030
- 184,015 · -4.0%
- By 2040
- 166,810 · -13.0%
- By 2050
- 149,857 · -21.8%
- By 2075
- 115,769 · -39.6%
- By 2100
- 83,617 · -56.4%
Race, ethnicity, and origin ACS 2023
- Neighborhood character
- Predominantly White (98%)
- Race & ethnicity
- White 98% Two or more races 2%
- Common ancestry
- Romanian 7% Scotch-Irish 2% Subsaharan African 2%
- Foreign-born
- 1%
- Languages at home
- 96% English-only · Other Indo-European 3% Spanish 1%
Political lean MEDSL · Trumbull
- 2024 margin
- R (+16.8) · D 41.2% · R 58.0%
- 2008→2024 swing
- -39.2pp toward R · 2008: 22.4pp · 2024: -16.8pp
- All cycles
- 2024: R+16.8 2020: R+10.6 2016: R+6.4 2012: D+22.2 2008: D+22.4
Not yet ingested
- Civics
- —
Market trends
- HPI YoY
- ▼ -20.52%
- Current HPI
- 241.8126
- Rent YoY
- —
- Metro
- —
- State GDP YoY
- ▲ 1.98%
- F500 in state
- 48
Industry mix (Fortune 500 HQ in OH)
| Industry | F500 HQs | Revenue |
|---|---|---|
| Insurance | 3 | $145B |
|
||
| Industrial Machinery | 3 | $49B |
|
||
| Financial Services | 3 | $24B |
|
||
| Consumer Goods | 2 | $93B |
|
||
| Aerospace / Defense | 2 | $47B |
|
||
| Utilities | 2 | $33B |
|
||
Price history
+49.8% since first listed6 events — show timeline
- 2026-05-30 Price Changed $59,900 MLSNOW
- 2026-05-10 Listed $69,900 MLSNOW
- 2017-02-10 Pending — MLSNOW
- 2017-02-06 Sold (MLS) $32,000 MLSNOW
- 2016-12-27 Contingent — MLSNOW
- 2016-12-19 Listed $40,000 MLSNOW
Property tax history
+0.7%/yrLatest (2025): $1,689 · +0.4% YoY. Source: county tax records.
Cash-flow waterfall
monthlySold comps — $/sqft
last 12 mo · ≤1 miLoading sold comps…