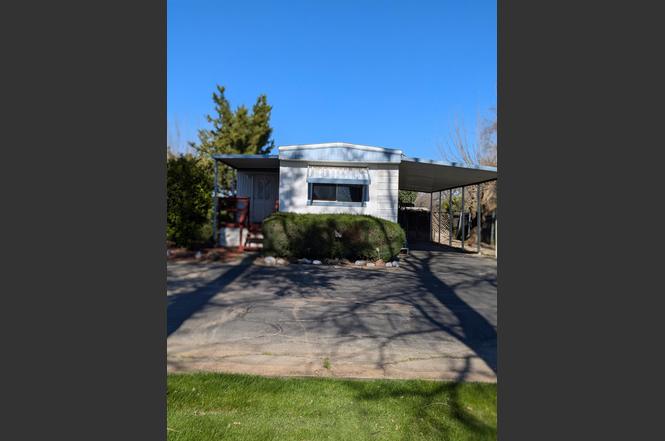
8831 State Highway 70 #21 · Yuba City, CA
Flood risk No data
- FEMA flood zone
- —
- Chance of flooding over 30 yrs
- —
- Est. flood insurance / yr
- —
Fire risk No data
- Est. fire insurance / yr
- —
Heat risk No data
- Hot days now (above threshold)
- —
- Hot days in 30 yrs
- —
Wind risk No data
- Chance of severe wind over 30 yrs
- —
Air-quality risk No data
- Unhealthy air days now
- —
- Unhealthy air days in 30 yrs
- —
Risk factors via First Street. Map © Google.
Why this score? — see what drove the B- grade
The composite is a weighted blend of 9 inputs, each scored 0–100. Each bar is that input's sub-score; the figure is the points it added to the 100-point composite (weight × sub-score).
- Cash flow +30.0/30.0
- 1% rule +10.0/10.0
- DSCR +10.0/10.0
- ARV discount +7.5/15.0
- Livability +3.8/5.0
- Rent growth +3.0/5.0
- Condition / age +2.5/5.0
- Schools +1.8/10.0
- Appreciation +0.0/10.0
$63,000
🖨 Deal sheet 📄 Offer letter ✓ Due diligence
Listing remarks
Lot rent is $645/mo. , which includes water/sewer/garbage. Charming and move-in ready, this 2-bedroom, 2-full baths, single & 3/4-wide (996.5 sq. feet) mobile home is located in a quiet location within a welcoming 55+ community. The 6,000 sq. ft. lot has three mature fruit trees providing shade, and grape vines. There is a covered carport (for two vehicles), on-street parking and a storage shed. It has a brand-new A/C ( & central heating), brand-new dishwasher, brand-new refrigerator (all in 2025) and a free-standing gas range in an open kitchen with lots of storage space. There is new flooring in the kitchen/office space/hallway and secondary bathroom. Electrical and bathroom su
Key facts
- Grape vines
- Mature fruit trees
- Brand-new a/c
Tags
Neighborhood map
What this means for you Summary
Snapshot
- This is a 2-bed/2.0-bath land listed at $63k.
Deal economics
- At list price, monthly cash flow is $805 ($10k/yr) — positive.
- The deal already cash-flows at list — no discount required.
- Meets the 1% rule at list price ($2k rent vs $63k).
- Recommended offer: $59k (6.0% below list) — sets the bar for market timing.
- Cap rate 21.6% vs local median 3.6% in Yuba City — top-decile yield for the area; either an underpriced asset or a hidden risk that comps aren't pricing in. Stress-test before assuming the spread holds.
Location & tenants
- Location reads 75/100 on livability (#111 in CA, #3,863 nationally) — a middle-class / working-renter tenant base. Strengths: commute A+, housing A+, health & safety A+; Watch: crime D+, schools D, cost of living F.
- Marysville Joint Unified (suburban): math 14% / reading 28% proficiency, ranked #455 of 517 in CA (top 88%) — low school quality limits family demand, transient renter base, plan for 1-2y turnover; 68% free/reduced lunch — lower-income household profile, screen leases tightly.
- Market conditions: Rents rising (+1.9%/yr); 254 active listings in the ZIP; 750 units permitted in Yuba County in 2024 (41 in 5+ unit buildings).
Forward outlook
- Local home prices are declining (-3.0%/yr); year-one equity from $436 of loan paydown is wiped out by about $2k of value loss. Plan a longer hold.
- Yuba County population projected to shrink 3% by 2050 — rents likely to lag national; underwrite the cash flow, not the appreciation.
- At projected returns (-3.0% appreciation + 1.9% rent growth), your $18k cash investment doubles in ~3 years — after that, you're playing with house money.
Negotiation context
- It's been on market 79 days — a 6% lower offer ($59k) is reasonable based on typical stale-listing flexibility.
Questions for the listing agent
- It's been on market 79 days. Have you received any prior offers? Is the seller open to a 6% concession, seller financing, or rate buy-down credit?
- Built in 1978 — when were the roof, HVAC, electrical panel, plumbing, and water heater last replaced?
- Why hasn't it sold? Are there any deal-killer items the seller is aware of (foundation, flood, title, zoning, code violations)?
- Is there a deadline driving the sale (1031 exchange, divorce, estate, relocation)? That informs how much negotiation room exists.
- Schools are D-rated, which usually means shorter tenancies and higher turnover. Who's the typical renter profile here, and what's been the actual vacancy rate?
- Crime grade is D in this area — have there been break-ins, vandalism, or insurance claims at this property in the last 3 years? What carrier currently insures it and at what premium?
- What's the average days-on-market for RENTAL listings here right now (not sales)? A rising rental-DOM trend means longer vacancies and softer asking-rent achievability than the comps imply.
- What's the recent tenant-quality profile in this submarket — average credit score on applications, eviction rate, late-payment / NSF rate, and stable-employment percentage? A property-management company in the area should have these aggregated.
- How much new for-sale + rental construction is in the pipeline within 1–3 miles? Heavy new supply typically softens prices + rents 12–24 months out; constrained supply supports both.
Investment metrics
- 1% rule
- 2.49% ✓
- Cap rate
- 21.63%
- Cash-on-cash
- 54.79%
- DSCR
- 3.44
- GRM
- 3.3
CMA / ARV
No comps found within radius.
Projected returns pro-forma
-3.0% appreciation · 1.87% rent growth · sell at horizon
- IRR
- 51.7%
- Equity multiple
- 3.23×
- Total profit
- $39,342
- Equity at exit
- $9,394
- IRR
- 56.6%
- Equity multiple
- 6.29×
- Total profit
- $93,320
- Equity at exit
- $5,447
Cash invested: $17,640 (down + closing). Projections, not guarantees.
Landlord ↔ Tenant lean methodology
- Overall (STATE)
- 18 Strongly Tenant-Friendly
- State California
- 18 Strongly Tenant-Friendly · D+13
- County
- — inherits STATE
- City
- — inherits STATE
ZIP-level market 95901
- Rents YoY
- 1.9%
- Active inventory
- 254
- Price-to-rent
- 3.3×
Monthly cashflow live
- Estimated rent
- $1,571 medium interval (Pro) →
- Mortgage (P&I)
- −$330
- Tax est. 1.5%
- −$79 /mo · $945/yr
- Insurance
- −$26
- HOA
- −$0
- Vacancy / Maint / Mgmt
- −$330
- Net cashflow
- $805
Break-even live
UW: 25.0% down · 7.5% · 30yr · 1.5% tax · 5.0% vac · 8.0% maint · 8.0% mgmt
Financing live
Cash to close
- Down payment
- $15,750
- Closing costs
- $1,890
- Reserves months
- —
- Total cash needed
- —
Loan-product check · same deal, 3 products live
Conventional
25% down · 7.5% · 30yr
- Down + closing
- —
- Monthly P&I
- —
- Monthly cashflow
- —
- DSCR
- —
- Eligible?
- —
Personal DTI + credit; lowest rate.
DSCR
20% down · 8.5% · 30yr
- Down + closing
- —
- Monthly P&I
- —
- Monthly cashflow
- —
- DSCR
- —
- Eligible?
- —
No personal income docs; deal must DSCR.
Hard money
10% down · 12.0% · 12mo
- Down + closing
- —
- Monthly P&I
- —
- Monthly cashflow
- —
- DSCR
- —
- Eligible?
- —
Short-term bridge; refi at stabilization.
Nearby sold comps map
Loading sold comps map…
Walkable amenities ~0.75 mi
Loading nearby amenities…
Taxation est. · year 1
- Rental income
- $18,846
- − Mortgage interest
- −$3,529
- − Property taxes
- −$945
- − Insurance
- −$315
- − Repairs & maintenance
- −$1,508
- − Management
- −$1,508
- − Depreciation
- −$1,833
- Taxable income
- $9,209
- Est. tax owed @ 24.0%
- −$2,210
- After-tax cash flow
- $7,454/yr
For passive investors: Depreciation is non-cash, so a rental often shows a tax loss while cash-flowing — sheltering income. Rental losses are passive: they offset passive income freely, and up to $25,000/yr can offset ordinary (W-2) income if you actively participate and your MAGI is under $100k (phasing out to $0 by $150k); unused losses carry forward. On sale, claimed depreciation is recaptured at up to 25%, and gains may owe capital-gains tax (a 1031 exchange can defer both). Figures are a year-1 estimate at your 24.0% rate — not tax advice; consult a CPA.
Schools (NCES district)
- District
- Marysville Joint Unified
- NCES district ID
- 0624090
- Math proficiency
- 14% ▼ -13.00%
- Reading proficiency
- 28% ▼ -10.00%
- Median HH income
- $44,598
- Composite
- 18.18/100
- National rank
- #8961
- State rank
- #455 of 517 in CA
Livability — Yuba City
- Score
- 75/100
- State rank
- #111
- US rank
- #3863
Category grades
Schools grade is shown separately in the Schools card above.
Census & demographics
- County
- Yuba County · 71,731 people
- City population
- 81,625
- Metro
- Yuba City, CA
- Population (ZIP)
- 37,732
- Household income
- $69,776
- Rent vs Own
- Severe rent burden
- 1190.0
Population outlook (Yuba County) Hauer SSP2
- Today (2025)
- 75,432 people
- By 2030
- 75,358 · -0.1%
- By 2040
- 74,643 · -1.0%
- By 2050
- 72,937 · -3.3%
- By 2075
- 66,368 · -12.0%
- By 2100
- 54,524 · -27.7%
Race, ethnicity, and origin ACS 2023
- Neighborhood character
- Diverse neighborhood (Simpson 0.65)
- Race & ethnicity
- White 51% Hispanic / Latino 28% Two or more races 17% Asian 9% Black 3% Native American 2%
- Hispanic origin (detail)
- Mexican 25%
- Common ancestry
- Italian 2% Lithuanian 1% Russian 1%
- Foreign-born
- 12% · Canada, China
- Languages at home
- 75% English-only · Spanish 16% Other Asian/Pacific 5% Other Indo-European 1%
Political lean MEDSL · Yuba
- 2024 margin
- Strong R (+25.8) · D 35.7% · R 61.5% · Other 2.8%
- 2008→2024 swing
- -11.2pp toward R · 2008: -14.7pp · 2024: -25.8pp
- All cycles
- 2024: R+25.8 2020: R+21.6 2016: R+24.1 2012: R+19.5 2008: R+14.7
Not yet ingested
- Civics
- —
Market trends
- HPI YoY
- ▼ -268.01%
- Current HPI
- 203.7684
- Rent YoY
- ▲ 1.87%
- Metro
- Yuba City, CA
- State GDP YoY
- ▲ 3.21%
- F500 in state
- 116
Industry mix (Fortune 500 HQ in CA)
| Industry | F500 HQs | Revenue |
|---|---|---|
| Technology | 27 | $1,492B |
|
||
| Financial Services | 3 | $174B |
|
||
| Retail | 3 | $44B |
|
||
| Insurance | 3 | $26B |
|
||
| Media / Entertainment | 2 | $115B |
|
||
| Pharmaceuticals / Biotech | 2 | $62B |
|
||
Property tax history
+24.4%/yrLatest (2025): $44 · +59.6% YoY. Source: county tax records.
Cash-flow waterfall
monthlySold comps — $/sqft
last 12 mo · ≤1 miLoading sold comps…