620 #25 Montauk Hwy #25 · Quiogue, NY
Flood risk 1/10 · Minimal
- FEMA flood zone
- X (unshaded)
- Chance of flooding over 30 yrs
- 0.0%
- Est. flood insurance / yr
- $473 – $860
Fire risk 1/10 · Minimal
- Est. fire insurance / yr
- $691 – $1,283
Heat risk 4/10 · Minor
- Hot days now (above 90°F)
- 7 days/yr
- Hot days in 30 yrs
- 19 days/yr
Wind risk 8/10 · Major
- Chance of severe wind over 30 yrs
- 80.0%
Air-quality risk 2/10 · Minimal
- Unhealthy air days now
- 2 days/yr
- Unhealthy air days in 30 yrs
- 2 days/yr
Risk factors via First Street. Map © Google.
Why this score? — see what drove the D+ grade
The composite is a weighted blend of 9 inputs, each scored 0–100. Each bar is that input's sub-score; the figure is the points it added to the 100-point composite (weight × sub-score).
- Cash flow +15.0/30.0
- Appreciation +10.0/10.0
- Schools +6.6/10.0
- 1% rule +5.0/10.0
- DSCR +5.0/10.0
- Livability +3.0/5.0
- Rent growth +2.5/5.0
- Condition / age +2.5/5.0
- ARV discount +0.0/15.0
$199,900
🖨 Deal sheet (PDF) 📄 Offer letter ✓ Due diligence
Listing remarks MLS
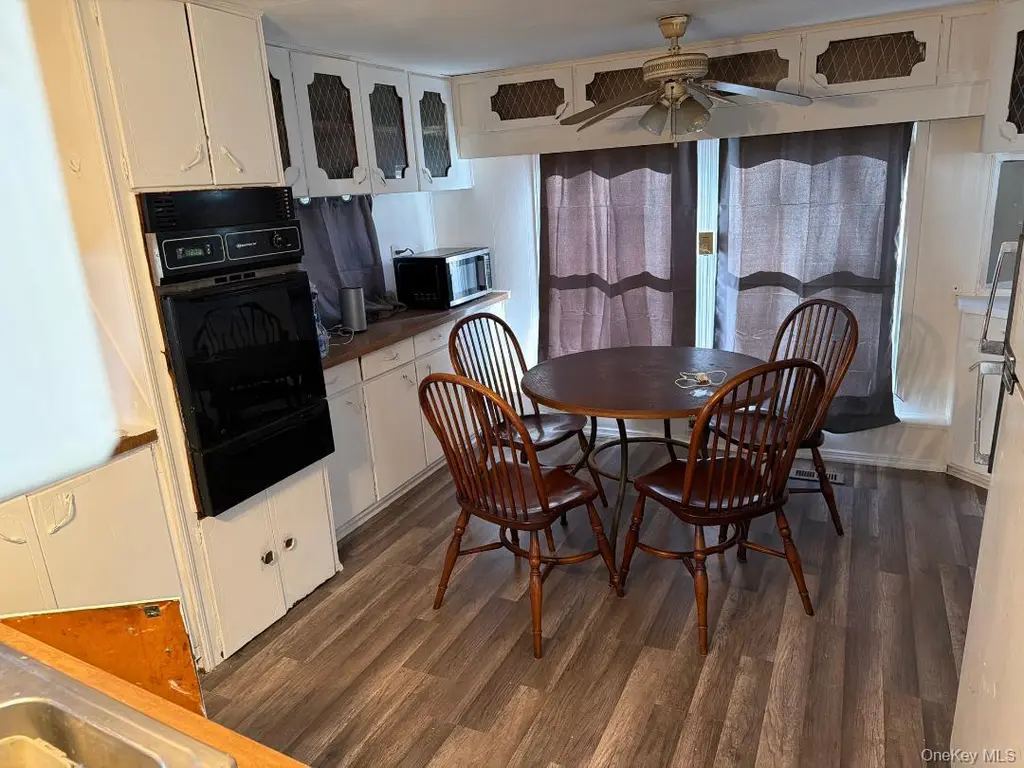
Diamond 2 Br. Mobile Home, 12X60 Eik, W/ Many Cabinets, Lots Of Storage, All Appliances Stay, Cac, Light And Bright, Florida Room Leads To Deck, Double Shed W/ Electric, Professionally Landscaped W/ Walks And Privacy., Additional information: Appearance:Mint,Separate Hotwater Heater:Y
Key facts
- Covered porch
- Two outside sheds
- Eat in kitchen
Tags
Property features AI
Finance
- HOA & community: Monthly association fee of $677 covering common area maintenance, snow removal, trash, and other items
Exterior
- Parking: Private parking lot
- Utilities: Electric service by PSEG; Cesspool sewer; Cable connected
- Home design: Manufactured house / Mobile home
- Construction: Mobile/manufactured construction
- Exterior features: Not waterfront
Interior
- Kitchen: Oven; Refrigerator
- Bathrooms: 1 full bathroom
- Heating & cooling: Kerosene heating; Wall/window air conditioning units
- Interior features: Eat-in kitchen; No basement; Attic: none; One-level layout; Total of 4 rooms
- Laundry & utility: Dedicated laundry room
Neighborhood map
What this means for you Summary
Snapshot
- This is a 2-bed/1.0-bath manufactured listed at $200k.
Deal economics
- At list price, monthly cash flow is $10k ($123k/yr) — positive.
- The deal already cash-flows at list — no discount required.
- Meets the 1% rule at list price ($16k rent vs $200k).
Location & tenants
- Location reads 59/100 on livability (#1,023 in NY) — a working-class tenant base; expect higher turnover. Strengths: crime A+, employment A+, housing B; Watch: amenities F, commute F, cost of living F.
- Westhampton Beach Union Free School District (suburban): math 72% / reading 75% proficiency, ranked #81 of 590 in NY (top 14%) — strong family-tenant draw, lease renewals of 3-5y typical.
- Zoned schools: Westhampton Beach Elementary School (math 67% / reading 67%, grade B+, #525 of 2,108 statewide, top 27%, 356 students, 43% FRL); Westhampton Middle School (math 61% / reading 63%, grade B+, #136 of 729 statewide, top 20%, 434 students, 26% FRL); Westhampton Beach Senior High School (math 90% / reading 96%, grade A+, #147 of 1,100 statewide, top 14%, 964 students, 24% FRL).
- Market conditions: 112 active listings in the ZIP; 1 comparable units currently listed for rent nearby; high-income renter base; 1,366 units permitted in Suffolk County in 2024 (216 in 5+ unit buildings).
- At $15,535/mo this rent would consume 149% of the median local household income ($125k/yr) (locally 43% of renters already pay >50% of income on rent) — very limited rent-growth headroom before tenants either downsize or default.
Forward outlook
- In year one you build about $21k of equity ($1k loan paydown + $20k appreciation (10.0% local appreciation)).
- Suffolk County population projected to shrink 5% by 2050 — rents likely to lag national; underwrite the cash flow, not the appreciation.
- At projected returns (10.0% appreciation + 3.0% rent growth), your $56k cash investment doubles in ~1 year — after that, you're playing with house money.
- By year 2, paydown + projected appreciation supports a ~$34k cash-out refi (75% LTV) — recoverable capital for the next deal without selling this one.
Negotiation context
- Only 11 days on market — expect competitive offers; lowballing is unlikely to land.
- 2 sale attempts since 14y ago with the ask held roughly flat each time — persistent listings suggest the price (not the market) is what's stuck; bring a comps-based counter.
- Current owner paid $40k; list at $200k implies a 400% gain — meaningful room to come down on a strong offer.
Risks & watch-outs
- Climate carrying-cost: severe wind risk, 80% chance of damaging wind over 30y — expect insurance premiums to compound above CPI over the hold.
Questions for the listing agent
- Built in 1967 — when were the roof, HVAC, electrical panel, plumbing, and water heater last replaced?
- What does the HOA fee cover, when was the last increase, and are there any pending special assessments or reserve-fund shortfalls?
- Is there a deadline driving the sale (1031 exchange, divorce, estate, relocation)? That informs how much negotiation room exists.
- Schools are D-rated, which usually means shorter tenancies and higher turnover. Who's the typical renter profile here, and what's been the actual vacancy rate?
- The area grade is low — what's the realistic commute time and amenity access for the typical tenant pool here? Any planned neighborhood developments (good or bad) we should know about?
- What's the average days-on-market for RENTAL listings here right now (not sales)? A rising rental-DOM trend means longer vacancies and softer asking-rent achievability than the comps imply.
- What's the recent tenant-quality profile in this submarket — average credit score on applications, eviction rate, late-payment / NSF rate, and stable-employment percentage? A property-management company in the area should have these aggregated.
- How much new for-sale + rental construction is in the pipeline within 1–3 miles? Heavy new supply typically softens prices + rents 12–24 months out; constrained supply supports both.
Investment metrics
- 1% rule
- 7.77% ✓
- Cap rate
- 67.61%
- Cash-on-cash
- 218.98%
- DSCR
- 10.74
- GRM
- 1.1
CMA / ARV
- ARV (on-the-fly)
- $161,472
- Comps found
- 5
Show comp detail 5 sales within ~0.75 mi
| Address | Dist | Beds/Ba | Sqft | Sold | Price | $/sf | Match |
|---|---|---|---|---|---|---|---|
| 620 Montauk Hwy #32 | 0.00mi | 2/1.0 | 672 (-3%) | 4mo | $89,000 | $132 | 91 |
| 620 Montauk Hwy #40 | 0.00mi | 2/1.0 | 720 (+3%) | 9mo | $180,000 | $250 | 87 |
| 620 Montauk Hwy #54 | 0.00mi | 2/1.0 | 672 (-3%) | 15mo | $155,670 | $232 | 82 |
| 620 Montauk Hwy #33 | 0.00mi | 2/1.0 | 600 (-14%) | 3mo | $139,000 | $232 | 75 |
| 620 Montauk #3 | 0.00mi | 2/1.0 | 800 (+15%) | 20mo | $207,000 | $259 | 58 |
Match score weights: distance 35% · size 25% · config 20% · recency 20%. Top-matched comps best support the ARV.
Projected returns pro-forma
10.0% appreciation · 3.0% rent growth · sell at horizon
- IRR
- —
- Equity multiple
- 14.58×
- Total profit
- $760,066
- Equity at exit
- $180,086
- IRR
- —
- Equity multiple
- 31.87×
- Total profit
- $1,727,978
- Equity at exit
- $388,362
Cash invested: $55,972 (down + closing). Projections, not guarantees.
Landlord ↔ Tenant lean methodology
- Overall (STATE)
- 15 Strongly Tenant-Friendly
- State New York
- 15 Strongly Tenant-Friendly · D+10
- County
- — inherits STATE
- City
- — inherits STATE
ZIP-level market 11978
- Home prices YoY
- 2.9%
- Active inventory
- 112
- Price-to-rent
- 1.1×
Monthly cashflow live
- Estimated rent
- $15,535 medium interval (Pro) →
- Mortgage (P&I)
- −$1,048
- Tax est. 1.5%
- −$250 /mo · $2,998/yr
- Insurance
- −$83
- HOA
- −$677
- Vacancy / Maint / Mgmt
- −$3,262
- Net cashflow
- $10,214
Break-even live
Sensitivity live
| Price | -10% $10,352 | -5% $10,283 | +0% $10,214 | +5% $10,145 | +10% $10,076 |
|---|---|---|---|---|---|
| Rent | -10% $8,987 | -5% $9,601 | +0% $10,214 | +5% $10,828 | +10% $11,441 |
| Rate | -1.0pp $10,315 | -0.5pp $10,265 | base $10,214 | +0.5pp $10,162 | +1.0pp $10,110 |
UW: 25.0% down · 7.5% · 30yr · 1.5% tax · 5.0% vac · 8.0% maint · 8.0% mgmt
Financing live
Cash to close
- Down payment
- $49,975
- Closing costs
- $5,997
- Reserves months
- —
- Total cash needed
- —
Loan-product check · same deal, 3 products live
Conventional
25% down · 7.5% · 30yr
- Down + closing
- —
- Monthly P&I
- —
- Monthly cashflow
- —
- DSCR
- —
- Eligible?
- —
Personal DTI + credit; lowest rate.
DSCR
20% down · 8.5% · 30yr
- Down + closing
- —
- Monthly P&I
- —
- Monthly cashflow
- —
- DSCR
- —
- Eligible?
- —
No personal income docs; deal must DSCR.
Hard money
10% down · 12.0% · 12mo
- Down + closing
- —
- Monthly P&I
- —
- Monthly cashflow
- —
- DSCR
- —
- Eligible?
- —
Short-term bridge; refi at stabilization.
Rent comps 1 comps
| Address | Beds | Baths | Sqft | Rent | $/sqft | DOM | Units | Dist |
|---|---|---|---|---|---|---|---|---|
| 424 Main St Westhampton Beach, NY | 2.0 | 1.0 | 632 | $10,000 | $15.82 | 19d | 1 | 0.71mi |
HOA detail
- Monthly dues
- $677 · $8,124/yr
- Likely covers
- waterelectric
Listing history 8 events
-
2026-06-18days on market $199,900 Active 11 DOM
-
2026-06-17days on market $199,900 Active 10 DOM
-
2026-06-16days on market $199,900 Active 9 DOM
-
2026-06-15days on market $199,900 Active 8 DOM
-
2026-06-13days on market $199,900 Active 6 DOM
-
2026-06-09days on market $199,900 Active 2 DOM
-
2026-06-08remarks 446-char remark
-
2026-06-08$199,900 Active 1 DOM
ⓘ Source: listings_history table (triggers on properties + properties_extension) + one-shot
backfill from property_details.listing_events for pre-trigger history.
Climate risk First Street
- Flood 1/10 Low FEMA zone X (unshaded) · 0% chance over 30 yrs
- Wildfire 1/10 Low
- Heat 4/10 Moderate 7 d/yr ≥90°F today · 19 d/yr by 30 yrs out
- Wind 8/10 Severe 80% chance of damaging wind over 30 yrs
- Air quality 2/10 Low 2 unhealthy d/yr today · 2 by 30 yrs out
Nearby sold comps map
Loading sold comps map…
Walkable amenities ~0.75 mi
Loading nearby amenities…
Taxation est. · year 1
- Rental income
- $186,419
- − Mortgage interest
- −$11,198
- − Property taxes
- −$2,998
- − Insurance
- −$1,000
- − Repairs & maintenance
- −$14,914
- − Management
- −$14,914
- − HOA
- −$8,124
- − Depreciation
- −$5,815
- Taxable income
- $127,458
- Est. tax owed @ 24.0%
- −$30,590
- After-tax cash flow
- $91,980/yr
For passive investors: Depreciation is non-cash, so a rental often shows a tax loss while cash-flowing — sheltering income. Rental losses are passive: they offset passive income freely, and up to $25,000/yr can offset ordinary (W-2) income if you actively participate and your MAGI is under $100k (phasing out to $0 by $150k); unused losses carry forward. On sale, claimed depreciation is recaptured at up to 25%, and gains may owe capital-gains tax (a 1031 exchange can defer both). Figures are a year-1 estimate at your 24.0% rate — not tax advice; consult a CPA.
Schools (NCES district)
- District
- Westhampton Beach Union Free School District
- NCES district ID
- 3631020
- Math proficiency
- 72% ▼ -5.00%
- Reading proficiency
- 75% ▲ 3.00%
- Median HH income
- $88,137
- Composite
- 65.91/100
- National rank
- #444
- State rank
- #81 of 590 in NY
Livability — Quiogue
- Score
- 59/100
- State rank
- #1023
- US rank
- #19962
Category grades
Schools grade is shown separately in the Schools card above.
Census & demographics
- Census place
- Quiogue, NY
- County
- Suffolk County · 679,920 people
- City population
- 4,376
- Metro
- New York-Newark-Jersey City, NY-NJ-PA
- Population (ZIP)
- 4,705
- Household income
- $125,179
- Rent vs Own
- Severe rent burden
- 43.0
Population outlook (Suffolk County) Hauer SSP2
- Today (2025)
- 1,505,262 people
- By 2030
- 1,498,318 · -0.5%
- By 2040
- 1,471,101 · -2.3%
- By 2050
- 1,424,848 · -5.3%
- By 2075
- 1,337,157 · -11.2%
- By 2100
- 1,217,720 · -19.1%
Race, ethnicity, and origin ACS 2023
- Neighborhood character
- Predominantly White (72%)
- Race & ethnicity
- White 72% Two or more races 14% Hispanic / Latino 11% Black 6% Asian 2%
- Hispanic origin (detail)
- Puerto Rican 1%
- Common ancestry
- Romanian 7% Scotch-Irish 2% Italian 2%
- Foreign-born
- 14% · Canada, Jamaica, China
- Languages at home
- 84% English-only · Spanish 10% Other Indo-European 2% Russian/Polish/Slavic 1%
Political lean MEDSL · Suffolk
- 2024 margin
- Lean R (+10.0) · D 45.0% · R 55.0%
- 2008→2024 swing
- -16.0pp toward R · 2008: 6.0pp · 2024: -10.0pp
- All cycles
- 2024: R+10.0 2020: R+0.0 2016: R+8.2 2012: D+2.9 2008: D+6.0
Not yet ingested
- Civics
- —
Market trends
- HPI YoY
- ▲ 13.02%
- Current HPI
- 460.3964
- Rent YoY
- —
- Metro
- New York-Newark-Jersey City, NY-NJ-PA
- State GDP YoY
- ▲ 2.60%
- F500 in state
- 92
Industry mix (Fortune 500 HQ in NY)
| Industry | F500 HQs | Revenue |
|---|---|---|
| Financial Services | 10 | $950B |
|
||
| Consumer Goods | 9 | $162B |
|
||
| Insurance | 4 | $225B |
|
||
| Telecommunications | 2 | $144B |
|
||
| Pharmaceuticals | 2 | $112B |
|
||
| Media / Entertainment | 2 | $69B |
|
||
Price history
+399.8% since first listed3 events — show timeline
- 2026-06-05 Listed $199,900 OneKey® MLS as Distributed by MLS Grid
- 2013-03-01 Sold (MLS) $40,000 OneKey® MLS as Distributed by MLS Grid
- 2012-12-10 Listed $40,000 OneKey® MLS as Distributed by MLS Grid
Property tax history
+2.7%/yrLatest (2022): $51 · +0.0% YoY. Source: county tax records.
Cash-flow waterfall
monthlySold comps — $/sqft
last 12 mo · ≤1 miLoading sold comps…