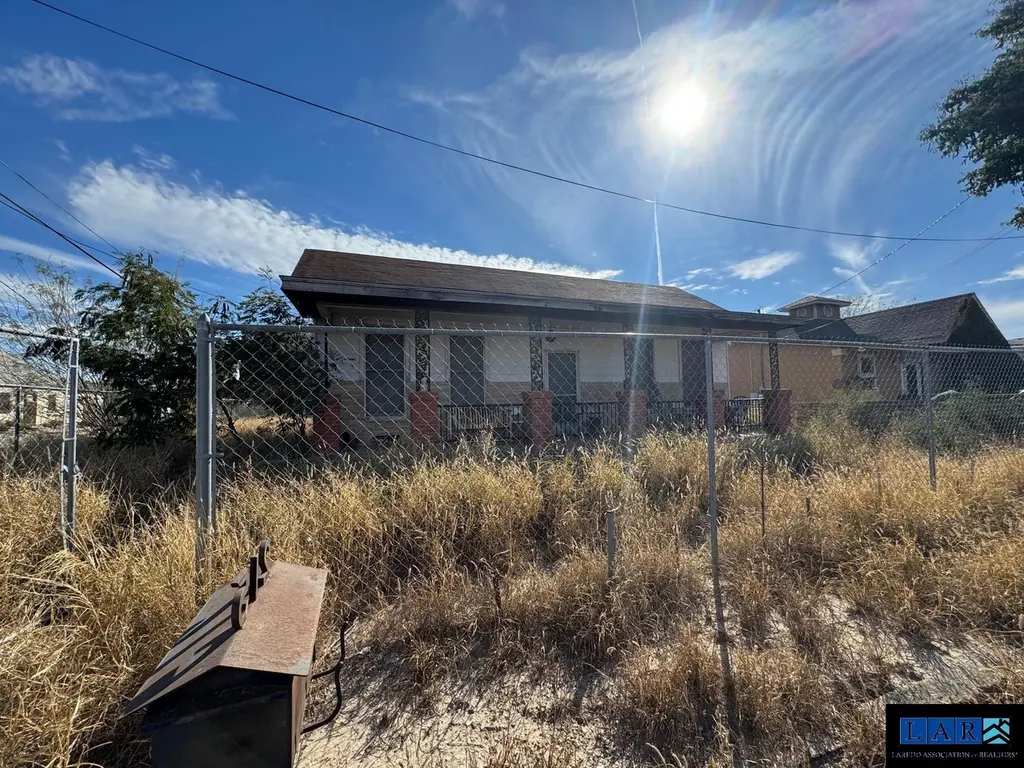
215 Cortez St · Laredo, TX
Flood risk 1/10 · Minimal
- FEMA flood zone
- X (unshaded)
- Chance of flooding over 30 yrs
- 0.0%
- Est. flood insurance / yr
- $507 – $1,088
Fire risk 4/10 · Minor
- Est. fire insurance / yr
- $1,222 – $2,270
Heat risk 8/10 · Major
- Hot days now (above 110°F)
- 7 days/yr
- Hot days in 30 yrs
- 23 days/yr
Wind risk 8/10 · Major
- Chance of severe wind over 30 yrs
- 80.0%
Air-quality risk 1/10 · Minimal
- Unhealthy air days now
- 0 days/yr
- Unhealthy air days in 30 yrs
- 0 days/yr
Risk factors via First Street. Map © Google.
Why this score? — see what drove the D grade
The composite is a weighted blend of 9 inputs, each scored 0–100. Each bar is that input's sub-score; the figure is the points it added to the 100-point composite (weight × sub-score).
- Cash flow +15.5/30.0
- Appreciation +7.5/10.0
- DSCR +4.8/10.0
- 1% rule +4.6/10.0
- Livability +3.7/5.0
- Rent growth +2.5/5.0
- Condition / age +2.5/5.0
- Schools +2.0/10.0
- ARV discount +0.0/15.0
$155,000
🖨 Deal sheet (PDF) 📄 Offer letter ✓ Due diligence
Listing remarks MLS
Investment opportunity * CORNER LOT / CASH ONLY * please contact me with any questions.
Key facts
- 7,712 sq ft lot
- Built 1954
- Listed 115 days
Neighborhood map
What this means for you Summary
Snapshot
- This is a 3-bed/1.0-bath single-family listed at $155k.
Deal economics
- At list price, monthly cash flow is $62 ($741/yr) — positive.
- The deal already cash-flows at list — no discount required.
- To meet the 1% rule (rent ≥ 1% of price), the offer needs to be $148k (4.2% below list).
- Recommended offer: $141k (9.0% below list) — sets the bar for market timing.
- Cap rate 6.8% vs local median 4.1% in Laredo — top-decile yield for the area; either an underpriced asset or a hidden risk that comps aren't pricing in. Stress-test before assuming the spread holds.
Location & tenants
- Location reads 73/100 on livability (#227 in TX) — a middle-class / working-renter tenant base. Strengths: cost of living A+, housing A+, health & safety A+; Watch: crime C-, employment D+, amenities F.
- Laredo ISD (urban): math 21% / reading 29% proficiency, ranked #739 of 826 in TX (top 90%) — low school quality limits family demand, transient renter base, plan for 1-2y turnover; 82% free/reduced lunch — lower-income household profile, screen leases tightly.
- Zoned schools: J C Martin Jr El (math 22% / reading 32%, grade F, #2,791 of 4,322 statewide, top 68%, 483 students, 99% FRL); Memorial Middle (math 19% / reading 26%, grade F, #1,341 of 1,662 statewide, top 82%, 668 students, 98% FRL); Dr Leo Cigarroa H S (math 21% / reading 21%, grade F, #1,385 of 1,632 statewide, top 85%, 1,472 students, 98% FRL) — zoned schools average 98% FRL vs 82% district-wide (16 pts higher); higher-poverty schools than district average — tighter screening recommended.
- Market conditions: 68 active listings in the ZIP; 3 comparable units currently listed for rent nearby; rentals lingering (median 46d on market — plan ~5-8 weeks vacancy on turnover, expect pricing pressure); 100% of comp listings sitting > 30 days — soft ceiling on asking rent; 1,448 units permitted in Webb County in 2024 (245 in 5+ unit buildings).
Forward outlook
- In year one you build about $9k of equity ($1k loan paydown + $8k appreciation (4.9% local appreciation)).
- Webb County population projected at +23% by 2050 — long-run rental-demand tailwind backs the buy-and-hold thesis.
- At projected returns (4.9% appreciation + 3.0% rent growth), your $43k cash investment doubles in ~5 years — after that, you're playing with house money.
- By year 5, paydown + projected appreciation supports a ~$38k cash-out refi (75% LTV) — recoverable capital for the next deal without selling this one.
Negotiation context
- It's been on market 115 days — a 9% lower offer ($141k) is reasonable based on typical stale-listing flexibility.
Risks & watch-outs
- Watch-outs: built in 1954 — expect roof / HVAC / electrical / plumbing capex.
- Climate carrying-cost: severe wind risk, 80% chance of damaging wind over 30y; extreme-heat days projected 7→23/yr by 2055 (HVAC capex compounding) — expect insurance premiums to compound above CPI over the hold.
Questions for the listing agent
- It's been on market 115 days. Have you received any prior offers? Is the seller open to a 9% concession, seller financing, or rate buy-down credit?
- Built in 1954 — when were the roof, HVAC, electrical panel, plumbing, and water heater last replaced?
- Why hasn't it sold? Are there any deal-killer items the seller is aware of (foundation, flood, title, zoning, code violations)?
- Is there a deadline driving the sale (1031 exchange, divorce, estate, relocation)? That informs how much negotiation room exists.
- The area grade is low — what's the realistic commute time and amenity access for the typical tenant pool here? Any planned neighborhood developments (good or bad) we should know about?
- What's the average days-on-market for RENTAL listings here right now (not sales)? A rising rental-DOM trend means longer vacancies and softer asking-rent achievability than the comps imply.
- What's the recent tenant-quality profile in this submarket — average credit score on applications, eviction rate, late-payment / NSF rate, and stable-employment percentage? A property-management company in the area should have these aggregated.
- How much new for-sale + rental construction is in the pipeline within 1–3 miles? Heavy new supply typically softens prices + rents 12–24 months out; constrained supply supports both.
Investment metrics
- 1% rule
- 0.96% ✗
- Cap rate
- 6.77%
- Cash-on-cash
- 1.71%
- DSCR
- 1.08
- GRM
- 8.7
CMA / ARV
- ARV (median comp)
- $109,536
- List price
- $155,000
- Delta
- 41.51%
- Verdict
- OVERPRICED
- Comps
- 2 within 1.0 mi
Projected returns pro-forma
4.93% appreciation · 3.0% rent growth · sell at horizon
- IRR
- 14.2%
- Equity multiple
- 1.90×
- Total profit
- $39,071
- Equity at exit
- $87,161
- IRR
- 14.9%
- Equity multiple
- 3.65×
- Total profit
- $115,134
- Equity at exit
- $149,873
Cash invested: $43,400 (down + closing). Projections, not guarantees.
Landlord ↔ Tenant lean methodology
- Overall (STATE)
- 87 Strongly Landlord-Friendly
- State Texas
- 87 Strongly Landlord-Friendly · R+5
- County
- — inherits STATE
- City
- — inherits STATE
ZIP-level market 78040
- Home prices YoY
- 3.9%
- Active inventory
- 68
- Price-to-rent
- 8.7×
Monthly cashflow live
- Estimated rent
- $1,484 medium interval (Pro) →
- Mortgage (P&I)
- −$813
- Tax from tax record
- −$234 /mo · $2,802/yr
- Insurance
- −$65
- HOA
- −$0
- Vacancy / Maint / Mgmt
- −$312
- Net cashflow
- $62
Break-even live
Sensitivity live
| Price | -10% $150 | -5% $106 | +0% $62 | +5% $18 | +10% $-26 |
|---|---|---|---|---|---|
| Rent | -10% $-56 | -5% $3 | +0% $62 | +5% $120 | +10% $179 |
| Rate | -1.0pp $140 | -0.5pp $101 | base $62 | +0.5pp $22 | +1.0pp $-19 |
UW: 25.0% down · 7.5% · 30yr · 1.5% tax · 5.0% vac · 8.0% maint · 8.0% mgmt
Financing live
Cash to close
- Down payment
- $38,750
- Closing costs
- $4,650
- Reserves months
- —
- Total cash needed
- —
Loan-product check · same deal, 3 products live
Conventional
25% down · 7.5% · 30yr
- Down + closing
- —
- Monthly P&I
- —
- Monthly cashflow
- —
- DSCR
- —
- Eligible?
- —
Personal DTI + credit; lowest rate.
DSCR
20% down · 8.5% · 30yr
- Down + closing
- —
- Monthly P&I
- —
- Monthly cashflow
- —
- DSCR
- —
- Eligible?
- —
No personal income docs; deal must DSCR.
Hard money
10% down · 12.0% · 12mo
- Down + closing
- —
- Monthly P&I
- —
- Monthly cashflow
- —
- DSCR
- —
- Eligible?
- —
Short-term bridge; refi at stabilization.
Rent comps 3 comps
| Address | Beds | Baths | Sqft | Rent | $/sqft | DOM | Units | Dist |
|---|---|---|---|---|---|---|---|---|
| 1702 Cortez St Laredo, TX | 3.0 | 2.0 | 1628 | $1,700 | $1.04 | 45d | 1 | 0.91mi |
| 1718 Willow St Laredo, TX | 3.0 | 2.0 | 1705 | $1,350 | $0.79 | 45d | 1 | 0.95mi |
| 2016 Rosario St Laredo, TX | 3.0 | 1.0 | 1293 | $1,350 | $1.04 | 45d | 1 | 1.13mi |
Listing history 19 events
-
2026-06-21days on market $155,000 Active 115 DOM
-
2026-06-21days on market $155,000 Active 114 DOM
-
2026-06-18days on market $155,000 Active 112 DOM
-
2026-06-17days on market $155,000 Active 111 DOM
-
2026-06-16days on market $155,000 Active 110 DOM
-
2026-06-15days on market $155,000 Active 109 DOM
-
2026-06-13days on market $155,000 Active 107 DOM
-
2026-06-12days on market $155,000 Active 106 DOM
-
2026-06-10days on market $155,000 Active 103 DOM
-
2026-06-08days on market $155,000 Active 102 DOM
-
2026-06-08days on market $155,000 Active 101 DOM
-
2026-06-07days on market $155,000 Active 100 DOM
-
2026-06-03days on market $155,000 Active 97 DOM
-
2026-06-02days on market $155,000 Active 96 DOM
-
2026-06-01days on market $155,000 Active 95 DOM
-
2026-05-31days on market $155,000 Active 94 DOM
-
2026-05-18price $155,000 89-char remark
Show marketing remark (89 chars)
Investment opportunity * CORNER LOT / CASH ONLY * please contact me with any questions.
-
2026-02-26$160,000 Active 89-char remark
Show marketing remark (89 chars)
Investment opportunity * CORNER LOT / CASH ONLY * please contact me with any questions.
-
1965-10-01soldstatus
ⓘ Source: listings_history table (triggers on properties + properties_extension) + one-shot
backfill from property_details.listing_events for pre-trigger history.
Tax reassessment forecast TX · Resets to sale price
- Current annual tax
- $2,802 · $234/mo
- Projected year-2 tax
- $2,836 · $236/mo
- Expected delta
- +$34/yr (+$3/mo · 1.2%)
ⓘ Screening estimate from a state-policy table — verify with the county assessor before closing.
Climate risk First Street
- Flood 1/10 Low FEMA zone X (unshaded) · 0% chance over 30 yrs
- Wildfire 4/10 Moderate
- Heat 8/10 Severe 7 d/yr ≥110°F today · 23 d/yr by 30 yrs out
- Wind 8/10 Severe 80% chance of damaging wind over 30 yrs
- Air quality 1/10 Low 0 unhealthy d/yr today · 0 by 30 yrs out
Nearby sold comps map
Loading sold comps map…
Walkable amenities ~0.75 mi
Loading nearby amenities…
Taxation est. · year 1
- Rental income
- $17,813
- − Mortgage interest
- −$8,682
- − Property taxes
- −$2,802
- − Insurance
- −$775
- − Repairs & maintenance
- −$1,425
- − Management
- −$1,425
- − Depreciation
- −$4,509
- Taxable loss
- −$1,806
- Est. tax savings @ 24.0%
- +$433
- After-tax cash flow
- $1,175/yr
For passive investors: Depreciation is non-cash, so a rental often shows a tax loss while cash-flowing — sheltering income. Rental losses are passive: they offset passive income freely, and up to $25,000/yr can offset ordinary (W-2) income if you actively participate and your MAGI is under $100k (phasing out to $0 by $150k); unused losses carry forward. On sale, claimed depreciation is recaptured at up to 25%, and gains may owe capital-gains tax (a 1031 exchange can defer both). Figures are a year-1 estimate at your 24.0% rate — not tax advice; consult a CPA.
Schools (NCES district)
- District
- Laredo ISD
- NCES district ID
- 4826790
- Math proficiency
- 21% ▼ -34.00%
- Reading proficiency
- 29% ▼ -13.00%
- Median HH income
- $25,655
- Composite
- 19.7/100
- National rank
- #8724
- State rank
- #739 of 826 in TX
Livability — Laredo
- Score
- 73/100
- State rank
- #227
- US rank
- #5399
Category grades
Schools grade is shown separately in the Schools card above.
Census & demographics
- Census place
- Laredo, TX
- City population
- 67,333
- Population (ZIP)
- 36,115
Population outlook (Webb County) Hauer SSP2
- Today (2025)
- 301,387 people
- By 2030
- 316,307 · +5.0%
- By 2040
- 345,636 · +14.7%
- By 2050
- 370,647 · +23.0%
- By 2075
- 413,907 · +37.3%
- By 2100
- 416,458 · +38.2%
Race, ethnicity, and origin ACS 2023
- Neighborhood character
- Predominantly Hispanic (97%)
- Race & ethnicity
- Hispanic / Latino 97% Two or more races 56% White 3%
- Hispanic origin (detail)
- Mexican 95%
- Foreign-born
- 32% · Canada
- Languages at home
- 7% English-only · Spanish 93%
Political lean MEDSL · Webb
- 2024 margin
- Toss-up / Even · D 48.5% · R 50.7%
- 2008→2024 swing
- -45.6pp toward R · 2008: 43.4pp · 2024: -2.2pp
- All cycles
- 2024: R+2.2 2020: D+23.3 2016: D+51.6 2012: D+54.0 2008: D+43.4
Not yet ingested
- Civics
- —
Market trends
- HPI YoY
- ▲ 4.93%
- Current HPI
- 133.0457
- Rent YoY
- —
- Metro
- —
- State GDP YoY
- ▲ 3.95%
- F500 in state
- 110
Industry mix (Fortune 500 HQ in TX)
| Industry | F500 HQs | Revenue |
|---|---|---|
| Energy | 16 | $1,198B |
|
||
| Technology | 5 | $198B |
|
||
| Engineering / Construction | 4 | $72B |
|
||
| Energy Services | 3 | $60B |
|
||
| Utilities | 3 | $41B |
|
||
| Healthcare | 2 | $330B |
|
||
Price history
-3.1% since first listed3 events — show timeline
- 2026-05-18 Price Changed $155,000 LAOR
- 2026-02-26 Listed $160,000 LAOR
- 1965-10-01 Sold (Public Records) — Public Records
Property tax history
+5.6%/yrLatest (2025): $2,802 · -2.7% YoY. Source: county tax records.
Cash-flow waterfall
monthlySold comps — $/sqft
last 12 mo · ≤1 miLoading sold comps…