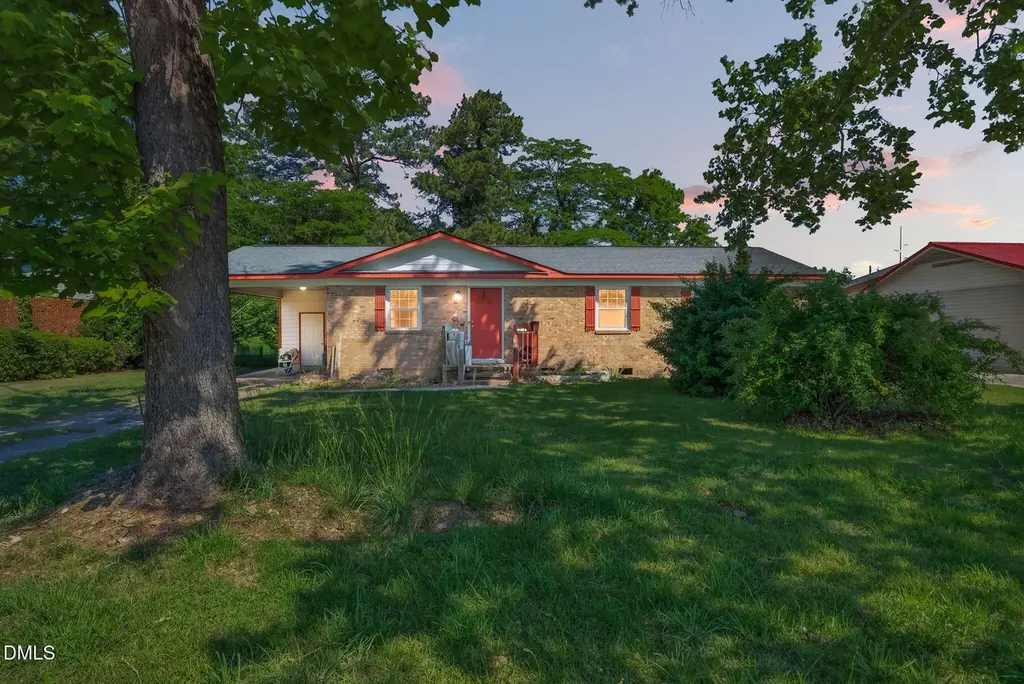
6510 Portsmouth Dr · Fayetteville, NC
Flood risk 1/10 · Minimal
- FEMA flood zone
- X (unshaded)
- Chance of flooding over 30 yrs
- 0.0%
- Est. flood insurance / yr
- $507 – $1,088
Fire risk 3/10 · Minor
- Est. fire insurance / yr
- $906 – $1,684
Heat risk 7/10 · Major
- Hot days now (above 107°F)
- 7 days/yr
- Hot days in 30 yrs
- 16 days/yr
Wind risk 7/10 · Major
- Chance of severe wind over 30 yrs
- 75.0%
Air-quality risk 2/10 · Minimal
- Unhealthy air days now
- 0 days/yr
- Unhealthy air days in 30 yrs
- 1 days/yr
Risk factors via First Street. Map © Google.
Why this score? — see what drove the D+ grade
The composite is a weighted blend of 9 inputs, each scored 0–100. Each bar is that input's sub-score; the figure is the points it added to the 100-point composite (weight × sub-score).
- Cash flow +13.6/30.0
- ARV discount +11.8/15.0
- DSCR +4.1/10.0
- Livability +3.8/5.0
- 1% rule +3.6/10.0
- Rent growth +3.3/5.0
- Schools +3.1/10.0
- Condition / age +2.5/5.0
- Appreciation +0.0/10.0
$165,000
🖨 Deal sheet 📄 Offer letter ✓ Due diligence
Listing remarks MLS
Glenbrook - Newly Renovated Ranch with 3 Bedrooms, 2 Full Baths, Large Family Room, Spacious Eat in Kitchen, New 30 year roof, New insulated windows, 2 full new bath showers tiled up to the ceilings, New Kitchen cabinets, New Kitchen Countertops, Authentic hardwood flooring refurbished, New Appliances stainless steel, Single Carport, Sewer connection has been completed!
Key facts
- Covered carport
- One-level living
- Carport
Tags
Property features AI
Finance
- Other: Lot cleared; Lot approx. 0.26 acres; One-level living; No pool or spa; No other structures
- HOA & community: No association
Exterior
- Parking: Attached carport (1 space); Open/off-street parking (2 spaces); Driveway
- Utilities: Public water; Public sewer; Electricity connected; Sewer connected; Water connected
- Home design: Single-story house; Site-built construction; Fixer condition; Zoned SF10
- Construction: Brick veneer exterior; Shingle roof; Brick/mortar raised foundation; Built as a house (site built)
- Exterior features: Front porch; Fenced backyard with chain-link fencing; Storage
Interior
- Kitchen: Free-standing electric range; Range hood
- Bedrooms: 3 bedrooms (all on main level)
- Flooring: Tile flooring; Wood flooring
- Bathrooms: 2 full bathrooms
- Heating & cooling: Electric heating; Forced air; Heat pump; Central electric air conditioning
- Interior features: Eat-in kitchen; Kitchen and dining room combined; Primary bedroom on main floor
- Laundry & utility: Main-level laundry room with washer and electric dryer hookups
Neighborhood map
What this means for you Summary
Snapshot
- This is a 3-bed/2.0-bath single-family listed at $165k.
Deal economics
- At list price, monthly cash flow is $9 ($111/yr) — positive.
- The deal already cash-flows at list — no discount required.
- To meet the 1% rule (rent ≥ 1% of price), the offer needs to be $142k (14.0% below list).
- Recommended offer: $142k (14.0% below list) — sets the bar for 1% rule.
- Cap rate 6.4% vs local median 4.9% in Fayetteville — top-decile yield for the area; either an underpriced asset or a hidden risk that comps aren't pricing in. Stress-test before assuming the spread holds.
Location & tenants
- Location reads 75/100 on livability (#45 in NC, #4,031 nationally) — a middle-class / working-renter tenant base. Strengths: commute A+, cost of living A+, housing A+; Watch: crime F, employment D-.
- Cumberland County Schools (urban): math 32% / reading 41% proficiency, ranked #126 of 178 in NC (top 71%) — families likely to look elsewhere, expect single-tenant / working-renter base with shorter leases.
- Zoned schools: Lewis Chapel Middle (math 15% / reading 27%, grade F, #424 of 475 statewide, top 90%, 578 students, 100% FRL); Seventy-First High (math 45% / reading 44%, grade F, #352 of 535 statewide, top 68%, 1,366 students, 70% FRL) — zoned schools average 85% FRL vs 55% district-wide (30 pts higher); higher-poverty schools than district average — tighter screening recommended.
- Market conditions: Rents rising (+3.1%/yr); 429 active listings in the ZIP; 40 comparable units currently listed for rent nearby; rentals at typical pace (median 24d on market — plan ~3-4 weeks tenant-placement turnaround); 1,125 units permitted in Cumberland County in 2024 (104 in 5+ unit buildings).
Forward outlook
- Local home prices are declining (-3.0%/yr); year-one equity from $1k of loan paydown is wiped out by about $5k of value loss. Plan a longer hold.
Negotiation context
- It's been on market 34 days — a 3% lower offer ($160k) is reasonable based on typical stale-listing flexibility.
- 3 sale attempts since 8y ago; this cycle's ask has dropped $10k (6%) from the opening price — seller is motivated, your offer sets the floor, not the list.
- Current owner paid $120k; 38% above their basis — modest negotiation headroom, anchor on the comps not their cost.
Risks & watch-outs
- Climate carrying-cost: major wind risk, 75% chance of damaging wind over 30y; extreme-heat days projected 7→16/yr by 2055 (HVAC capex compounding) — expect insurance premiums to compound above CPI over the hold.
Questions for the listing agent
- It's been on market 34 days. Have you received any prior offers? Is the seller open to a 14% concession, seller financing, or rate buy-down credit?
- Built in 1972 — when were the roof, HVAC, electrical panel, plumbing, and water heater last replaced?
- Is there a deadline driving the sale (1031 exchange, divorce, estate, relocation)? That informs how much negotiation room exists.
- Crime grade is F in this area — have there been break-ins, vandalism, or insurance claims at this property in the last 3 years? What carrier currently insures it and at what premium?
- The area grade is low — what's the realistic commute time and amenity access for the typical tenant pool here? Any planned neighborhood developments (good or bad) we should know about?
- What's the average days-on-market for RENTAL listings here right now (not sales)? A rising rental-DOM trend means longer vacancies and softer asking-rent achievability than the comps imply.
- What's the recent tenant-quality profile in this submarket — average credit score on applications, eviction rate, late-payment / NSF rate, and stable-employment percentage? A property-management company in the area should have these aggregated.
- How much new for-sale + rental construction is in the pipeline within 1–3 miles? Heavy new supply typically softens prices + rents 12–24 months out; constrained supply supports both.
Investment metrics
- 1% rule
- 0.86% ✗
- Cap rate
- 6.36%
- Cash-on-cash
- 0.24%
- DSCR
- 1.01
- GRM
- 9.7
CMA / ARV
- ARV (on-the-fly)
- $182,250
- Comps found
- 12
Show comp detail 12 sales within ~0.75 mi
| Address | Dist | Beds/Ba | Sqft | Sold | Price | $/sf | Match |
|---|---|---|---|---|---|---|---|
| 6512 Schaffer Pl | 0.22mi | 3/1.5 | 1,155 (+3%) | 4mo | $169,900 | $147 | 80 |
| 6493 Portsmouth Dr | 0.12mi | 3/2.0 | 1,200 (+7%) | 5mo | $193,500 | $161 | 80 |
| 6544 Saint Louis St | 0.26mi | 4/1.5 (+1) | 1,148 (+2%) | 6mo | $163,000 | $142 | 73 |
| 604 Clifford Ave | 0.53mi | 3/2.0 | 1,120 (-0%) | 3mo | $184,000 | $164 | 72 |
| 1028 Crayton Cir | 0.49mi | 3/1.5 | 1,092 (-3%) | 9mo | $159,700 | $146 | 63 |
| 545 Jennings Farm Rd | 0.67mi | 3/2.0 | 1,104 (-2%) | 7mo | $208,400 | $189 | 60 |
| 549 Jennings Farm Rd | 0.66mi | 3/2.0 | 1,172 (+4%) | 8mo | $205,000 | $175 | 55 |
| 6110 Conaway Dr | 0.67mi | 3/2.0 | 1,014 (-10%) | 1mo | $186,500 | $184 | 51 |
| 525 Offing Dr | 0.66mi | 3/2.0 | 1,265 (+12%) | 3mo | $220,000 | $174 | 46 |
| 6310 Glenlea Cir | 0.66mi | 3/1.5 | 1,275 (+13%) | 1mo | $165,000 | $129 | 44 |
| 6206 Glenlea Cir | 0.61mi | 4/2.0 (+1) | 1,268 (+13%) | 10mo | $205,000 | $162 | 37 |
| 6341 Cliffdale Rd | 0.75mi | 3/1.0 | 1,258 (+12%) | 5mo | $134,500 | $107 | 37 |
Match score weights: distance 35% · size 25% · config 20% · recency 20%. Top-matched comps best support the ARV.
Projected returns pro-forma
-3.0% appreciation · 3.11% rent growth · sell at horizon
- IRR
- -15.8%
- Equity multiple
- 0.44×
- Total profit
- $-25,988
- Equity at exit
- $24,602
- IRR
- -7.2%
- Equity multiple
- 0.54×
- Total profit
- $-21,209
- Equity at exit
- $14,266
Cash invested: $46,200 (down + closing). Projections, not guarantees.
Landlord ↔ Tenant lean methodology
- Overall (STATE)
- 85 Strongly Landlord-Friendly
- State North Carolina
- 85 Strongly Landlord-Friendly · R+3
- County
- — inherits STATE
- City
- — inherits STATE
ZIP-level market 28314
- Home prices YoY
- -15.7%
- Rents YoY
- 3.1%
- Active inventory
- 429
- Price-to-rent
- 9.7×
Monthly cashflow live
- Estimated rent
- $1,420 high interval (Pro) →
- Mortgage (P&I)
- −$865
- Tax from tax record
- −$178 /mo · $2,140/yr
- Insurance
- −$69
- HOA
- −$0
- Vacancy / Maint / Mgmt
- −$298
- Net cashflow
- $9
Break-even live
UW: 25.0% down · 7.5% · 30yr · 1.5% tax · 5.0% vac · 8.0% maint · 8.0% mgmt
Financing live
Cash to close
- Down payment
- $41,250
- Closing costs
- $4,950
- Reserves months
- —
- Total cash needed
- —
Loan-product check · same deal, 3 products live
Conventional
25% down · 7.5% · 30yr
- Down + closing
- —
- Monthly P&I
- —
- Monthly cashflow
- —
- DSCR
- —
- Eligible?
- —
Personal DTI + credit; lowest rate.
DSCR
20% down · 8.5% · 30yr
- Down + closing
- —
- Monthly P&I
- —
- Monthly cashflow
- —
- DSCR
- —
- Eligible?
- —
No personal income docs; deal must DSCR.
Hard money
10% down · 12.0% · 12mo
- Down + closing
- —
- Monthly P&I
- —
- Monthly cashflow
- —
- DSCR
- —
- Eligible?
- —
Short-term bridge; refi at stabilization.
Rent comps 40 comps
| Address | Beds | Baths | Sqft | Rent | $/sqft | DOM | Units | Dist |
|---|---|---|---|---|---|---|---|---|
| 6517 Portsmouth Dr Fayetteville, NC | 3.0 | 1.5 | 1125 | $1,250 | $1.11 | 23d | 1 | 0.03mi |
| 944 Lark Dr Fayetteville, NC | 3.0 | 2.0 | 1100 | $1,395 | $1.27 | 14d | 1 | 0.31mi |
| 3500 Carlson Bay Ct Fayetteville, NC | 1.0–3.0 | 1.0–2.0 | 850 | $1,350 | $1.59 | 14d | 4 | 0.56mi |
| 3325 Oak Forest Dr Fayetteville, NC | 1.0–3.0 | 1.0–2.0 | 1112 | $1,745 | $1.57 | 14d | 66 | 0.59mi |
| 698 Bartons Landing Pl #5 Fayetteville, NC | 2.0 | 2.0 | 1136 | $1,100 | $0.97 | 23d | 1 | 0.60mi |
| 663 Bartons Landing Pl Unit 2 Fayetteville, NC | 2.0 | 2.0 | 1150 | $1,200 | $1.04 | 14d | 1 | 0.65mi |
| 6340 Ginger Cir Fayetteville, NC | 3.0 | 1.5 | 1052 | $1,400 | $1.33 | 23d | 1 | 0.66mi |
| 1131 Capeharbor Ct Fayetteville, NC | 2.0 | 2.0 | 1100 | $1,345 | $1.22 | 14d | 14 | 0.68mi |
| 672 Bartons Landing Pl Fayetteville, NC | 2.0 | 2.0 | 1145 | $1,100 | $0.96 | 14d | 1 | 0.75mi |
| 6309 Lynette Cir Fayetteville, NC | 3.0 | 1.5 | 1014 | $1,300 | $1.28 | 23d | 1 | 0.76mi |
| 679 Bartons Landing Pl Unit 6 Fayetteville, NC | 2.0 | 2.0 | 1145 | $1,200 | $1.05 | 23d | 1 | 0.79mi |
| 679 Bartons Landing Pl Fayetteville, NC | 2.0 | 2.0 | 1145 | $1,150 | $1.00 | 23d | 1 | 0.79mi |
| 567 Cutchen Ln Fayetteville, NC | 1.0–3.0 | 1.0–2.0 | 975 | $1,425 | $1.46 | 14d | 61 | 0.86mi |
| 6408 Starbrook Dr #5 Fayetteville, NC | 2.0 | 2.0 | 860 | $995 | $1.16 | 23d | 1 | 0.86mi |
| 6400 Starbrook Dr #1 Fayetteville, NC | 2.0 | 2.0 | 860 | $1,000 | $1.16 | 23d | 1 | 0.87mi |
| 6132 Dandy Loop Rd Fayetteville, NC | 3.0 | 1.0 | 1456 | $1,325 | $0.91 | 23d | 1 | 0.88mi |
| 420 Mangum Ct Fayetteville, NC | 3.0 | 2.0 | 1127 | $1,550 | $1.38 | 23d | 1 | 0.89mi |
| 1222 Southwood Dr Fayetteville, NC | 2.0 | 1.5 | 801 | $875 | $1.09 | 23d | 1 | 0.90mi |
| 3119 Wisteria Ln Unit 102 Fayetteville, NC | 3.0 | 2.0 | 1415 | $1,550 | $1.10 | 14d | 1 | 0.91mi |
| 495 Stiles Pl Fayetteville, NC | 3.0 | 2.0 | 1300 | $1,250 | $0.96 | 14d | 1 | 0.91mi |
| 1066 Strickland Bridge Rd Fayetteville, NC | 3.0 | 2.0 | 1427 | $2,050 | $1.44 | 14d | 1 | 0.92mi |
| 812 Crescent Commons Way Fayetteville, NC | 1.0–2.0 | 1.0–2.0 | 963 | $1,385 | $1.44 | 14d | 10 | 0.95mi |
| 5831 Waters Edge Dr Fayetteville, NC | 3.0 | 2.0 | 1344 | $1,545 | $1.15 | 23d | 1 | 0.96mi |
| 540 Auburndale Ln Fayetteville, NC | 3.0 | 2.0 | 1100 | $1,600 | $1.45 | 14d | 1 | 1.01mi |
| 5761 Waterwood Dr Fayetteville, NC | 3.0 | 2.0 | 1452 | $1,600 | $1.10 | 21d | 1 | 1.03mi |
| 6793 Candlewood Dr Fayetteville, NC | 3.0 | 2.0 | 1240 | $1,475 | $1.19 | 14d | 1 | 1.05mi |
| 5713 Waterwood Dr Fayetteville, NC | 3.0 | 2.0 | 1440 | $1,650 | $1.15 | 21d | 1 | 1.07mi |
| 1443 Larkhall Dr Fayetteville, NC | 4.0 | 2.0 | 1382 | $1,600 | $1.16 | 23d | 1 | 1.07mi |
| 202 Bertram Pl Fayetteville, NC | 3.0 | 2.0 | 1175 | $1,300 | $1.11 | 14d | 1 | 1.08mi |
| 1070 Rulnick St Fayetteville, NC | 3.0 | 1.0 | 1014 | $1,200 | $1.18 | 23d | 1 | 1.16mi |
| 6407 Wallaby Ct Fayetteville, NC | 2.0 | 1.5 | 1100 | $1,200 | $1.09 | 14d | 1 | 1.17mi |
| 6332 Marykirk Dr Unit A Fayetteville, NC | 2.0 | 1.5 | 925 | $1,150 | $1.24 | 23d | 1 | 1.18mi |
| 7298 Ryan St Fayetteville, NC | 4.0 | 1.5 | 1315 | $1,400 | $1.06 | 23d | 1 | 1.19mi |
| 6333 Marykirk Dr Unit A Fayetteville, NC | 2.0 | 1.5 | 1080 | $1,075 | $1.00 | 23d | 1 | 1.20mi |
| 6324 Marykirk Dr Unit A Fayetteville, NC | 2.0 | 1.5 | 792 | $900 | $1.14 | 23d | 1 | 1.22mi |
| 3330 Harbour Pointe Pl #12 Fayetteville, NC | 3.0 | 2.0 | 1401 | $1,700 | $1.21 | 14d | 1 | 1.25mi |
| 7252 Ainsley St Fayetteville, NC | 3.0 | 1.0 | 1265 | $1,299 | $1.03 | 23d | 1 | 1.25mi |
| 338 Milburn Dr Fayetteville, NC | 3.0 | 1.5 | 1128 | $1,550 | $1.37 | 23d | 1 | 1.28mi |
| 1437 Artesian Ct Fayetteville, NC | 2.0 | 1.5 | 850 | $1,000 | $1.18 | 14d | 1 | 1.29mi |
| 600 Scotia Ln Fayetteville, NC | 1.0–3.0 | 1.0–2.0 | 1070 | $1,380 | $1.29 | 14d | 29 | 1.29mi |
Listing history 21 events
-
2026-06-18days on market $165,000 Active 34 DOM
-
2026-06-17days on market $165,000 Active 33 DOM
-
2026-06-16days on market $165,000 Active 32 DOM
-
2026-06-15days on market $165,000 Active 31 DOM
-
2026-06-14days on market $165,000 Active 29 DOM
-
2026-06-13days on market $165,000 Active 28 DOM
-
2026-06-10days on market $165,000 Active 26 DOM
-
2026-06-09days on market $165,000 Active 25 DOM
-
2026-06-08days on market $165,000 Active 24 DOM
-
2026-06-07days on market $165,000 Active 23 DOM
-
2026-06-03days on market $165,000 Active 19 DOM
-
2026-06-02days on market $165,000 Active 18 DOM
-
2026-06-01pricedays on market $165,000 Active 17 DOM
-
2026-05-31days on market $175,000 Active 16 DOM
-
2026-05-30days on market $175,000 Active 15 DOM
-
2026-05-15$175,000 Active
-
2021-04-21soldstatus $120,000 372-char remark
Show marketing remark (372 chars)
Glenbrook - Newly Renovated Ranch with 3 Bedrooms, 2 Full Baths, Large Family Room, Spacious Eat in Kitchen, New 30 year roof, New insulated windows, 2 full new bath showers tiled up to the ceilings, New Kitchen cabinets, New Kitchen Countertops, Authentic hardwood flooring refurbished, New Appliances stainless steel, Single Carport, Sewer connection has been completed!
-
2021-04-21soldstatus $120,000
Show marketing remark (372 chars)
Glenbrook - Newly Renovated Ranch with 3 Bedrooms, 2 Full Baths, Large Family Room, Spacious Eat in Kitchen, New 30 year roof, New insulated windows, 2 full new bath showers tiled up to the ceilings, New Kitchen cabinets, New Kitchen Countertops, Authentic hardwood flooring refurbished, New Appliances stainless steel, Single Carport, Sewer connection has been completed!
-
2021-02-13$119,900 372-char remark
Show marketing remark (372 chars)
Glenbrook - Newly Renovated Ranch with 3 Bedrooms, 2 Full Baths, Large Family Room, Spacious Eat in Kitchen, New 30 year roof, New insulated windows, 2 full new bath showers tiled up to the ceilings, New Kitchen cabinets, New Kitchen Countertops, Authentic hardwood flooring refurbished, New Appliances stainless steel, Single Carport, Sewer connection has been completed!
-
2018-09-04soldstatus $36,000 386-char remark
Show marketing remark (386 chars)
TO BE SOLD "AS IS"CASH ONLY. LOTS OF POTENTIAL FOR INVESTORS. ". SELLER DOES NOT PAY CUSTOMARY CLOSING COSTS; INCLUDING TITLE POLICY, ESCROW FEES, SURVEY OR TRANSFER FEES. PROOF OF FUNDS REQUIRED ON CASH TRANSACTIONS; LENDER PRE-APPROVAL LETTER FOR FINANCED OFFERS (DATED WITHIN LAST 30 DAYS). THE PROPERTY WAS BUILT PRIOR TO 1978 AND LEAD-BASED PAINT POTENTIALLY EXISTS.
-
2018-07-31$39,900 386-char remark
Show marketing remark (386 chars)
TO BE SOLD "AS IS"CASH ONLY. LOTS OF POTENTIAL FOR INVESTORS. ". SELLER DOES NOT PAY CUSTOMARY CLOSING COSTS; INCLUDING TITLE POLICY, ESCROW FEES, SURVEY OR TRANSFER FEES. PROOF OF FUNDS REQUIRED ON CASH TRANSACTIONS; LENDER PRE-APPROVAL LETTER FOR FINANCED OFFERS (DATED WITHIN LAST 30 DAYS). THE PROPERTY WAS BUILT PRIOR TO 1978 AND LEAD-BASED PAINT POTENTIALLY EXISTS.
ⓘ Source: listings_history table (triggers on properties + properties_extension) + one-shot
backfill from property_details.listing_events for pre-trigger history.
Tax reassessment forecast NC · Resets to sale price
- Current annual tax
- $2,140 · $178/mo
- Projected year-2 tax
- $2,140 · $178/mo
- Expected delta
- $0/yr ($0/mo · 0.0%)
ⓘ Screening estimate from a state-policy table — verify with the county assessor before closing.
Climate risk First Street
- Flood 1/10 Low FEMA zone X (unshaded) · 0% chance over 30 yrs
- Wildfire 3/10 Moderate
- Heat 7/10 Severe 7 d/yr ≥107°F today · 16 d/yr by 30 yrs out
- Wind 7/10 Severe 75% chance of damaging wind over 30 yrs
- Air quality 2/10 Low 0 unhealthy d/yr today · 1 by 30 yrs out
Nearby sold comps map
Loading sold comps map…
Walkable amenities ~0.75 mi
Loading nearby amenities…
Taxation est. · year 1
- Rental income
- $17,037
- − Mortgage interest
- −$9,243
- − Property taxes
- −$2,140
- − Insurance
- −$825
- − Repairs & maintenance
- −$1,363
- − Management
- −$1,363
- − Depreciation
- −$4,800
- Taxable loss
- −$2,697
- Est. tax savings @ 24.0%
- +$647
- After-tax cash flow
- $758/yr
For passive investors: Depreciation is non-cash, so a rental often shows a tax loss while cash-flowing — sheltering income. Rental losses are passive: they offset passive income freely, and up to $25,000/yr can offset ordinary (W-2) income if you actively participate and your MAGI is under $100k (phasing out to $0 by $150k); unused losses carry forward. On sale, claimed depreciation is recaptured at up to 25%, and gains may owe capital-gains tax (a 1031 exchange can defer both). Figures are a year-1 estimate at your 24.0% rate — not tax advice; consult a CPA.
Schools (NCES district)
- District
- Cumberland County Schools
- NCES district ID
- 3700011
- Math proficiency
- 32% ▼ -2.00%
- Reading proficiency
- 41% ▼ -1.00%
- Median HH income
- $44,168
- Composite
- 31.0/100
- National rank
- #6096
- State rank
- #126 of 178 in NC
Livability — Fayetteville
- Score
- 75/100
- State rank
- #45
- US rank
- #4031
Category grades
Schools grade is shown separately in the Schools card above.
Census & demographics
- Census place
- Fayetteville, NC
- County
- Cumberland County · 265,314 people
- City population
- 226,118
- Metro
- Fayetteville, NC
- Population (ZIP)
- 55,834
- Household income
- $62,249
- Rent vs Own
- Severe rent burden
- 2511.0
Population outlook (Cumberland County) Hauer SSP2
- Today (2025)
- 330,855 people
- By 2030
- 333,523 · +0.8%
- By 2040
- 335,583 · +1.4%
- By 2050
- 335,325 · +1.4%
- By 2075
- 342,853 · +3.6%
- By 2100
- 340,698 · +3.0%
Race, ethnicity, and origin ACS 2023
- Neighborhood character
- Diverse neighborhood (Simpson 0.67)
- Race & ethnicity
- Black 49% White 25% Hispanic / Latino 16% Two or more races 11% Asian 3%
- Hispanic origin (detail)
- Mexican 5% Puerto Rican 6% Dominican 1%
- Common ancestry
- Slovak 1% Romanian 1% Lithuanian 1%
- Foreign-born
- 9% · Canada, South Korea
- Languages at home
- 84% English-only · Spanish 10% Korean 1% Other Asian/Pacific 1%
Political lean MEDSL · Cumberland
- 2024 margin
- D (+13.4) · D 56.1% · R 42.7% · Other 1.2%
- 2008→2024 swing
- -4.3pp toward R · 2008: 17.7pp · 2024: 13.4pp
- All cycles
- 2024: D+13.4 2020: D+16.6 2016: D+16.0 2012: D+19.7 2008: D+17.7
Not yet ingested
- Civics
- —
Market trends
- HPI YoY
- ▼ -43.20%
- Current HPI
- 231.873
- Rent YoY
- ▲ 3.11%
- Metro
- Fayetteville, NC
- State GDP YoY
- ▲ 3.28%
- F500 in state
- 26
Industry mix (Fortune 500 HQ in NC)
| Industry | F500 HQs | Revenue |
|---|---|---|
| Financial Services | 2 | $213B |
|
||
| Retail | 2 | $95B |
|
||
| Industrial Conglomerate | 1 | $38B |
|
||
| Metals / Steel | 1 | $35B |
|
||
| Utilities | 1 | $30B |
|
||
| Industrial Machinery | 1 | $19B |
|
||
Price history
+338.6% since first listed6 events — show timeline
- 2026-05-15 Listed $175,000 TMLS
- 2021-04-21 Sold (Public Records) $120,000 Public Records
- 2021-04-21 Sold (MLS) $120,000 LPRMLS
- 2021-02-13 Listed $119,900 LPRMLS
- 2018-09-04 Sold (MLS) $36,000 LPRMLS
- 2018-07-31 Listed $39,900 LPRMLS
Property tax history
+8.0%/yrLatest (2025): $2,140 · +67.9% YoY. Source: county tax records.
Cash-flow waterfall
monthlySold comps — $/sqft
last 12 mo · ≤1 miLoading sold comps…