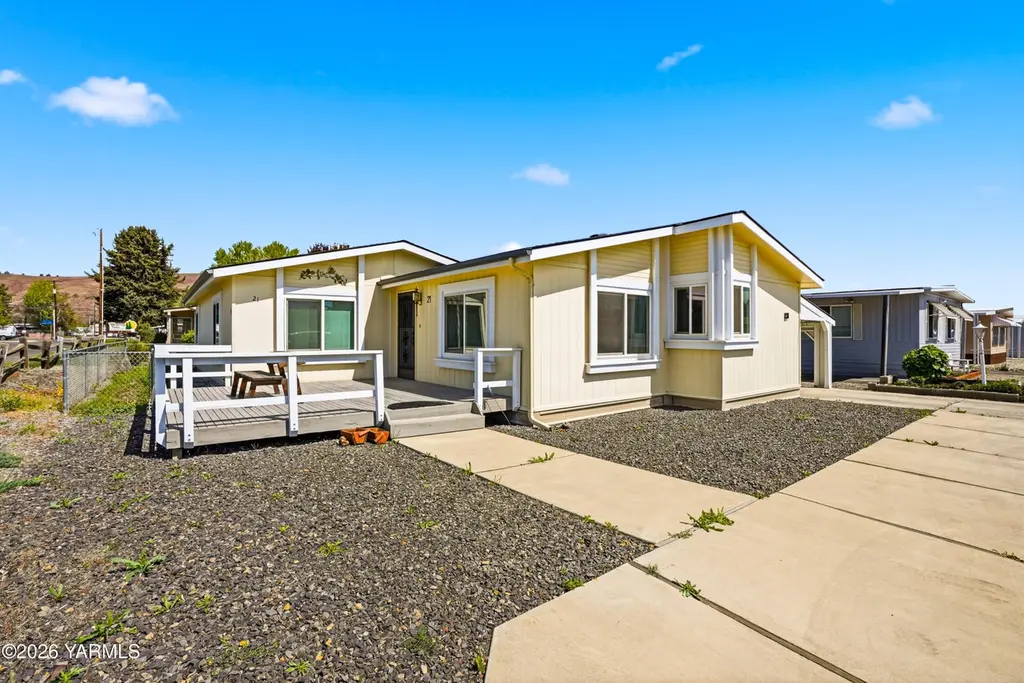
1011 N 34th Ave #21 · Yakima, WA
Flood risk 1/10 · Minimal
- FEMA flood zone
- X (unshaded)
- Chance of flooding over 30 yrs
- 0.0%
- Est. flood insurance / yr
- $507 – $1,088
Fire risk 5/10 · Moderate
- Est. fire insurance / yr
- $604 – $1,122
Heat risk 4/10 · Minor
- Hot days now (above 97°F)
- 7 days/yr
- Hot days in 30 yrs
- 14 days/yr
Wind risk 1/10 · Minimal
- Chance of severe wind over 30 yrs
- —
Air-quality risk 9/10 · Severe
- Unhealthy air days now
- 14 days/yr
- Unhealthy air days in 30 yrs
- 16 days/yr
Risk factors via First Street. Map © Google.
Why this score? — see what drove the C+ grade
The composite is a weighted blend of 9 inputs, each scored 0–100. Each bar is that input's sub-score; the figure is the points it added to the 100-point composite (weight × sub-score).
- Cash flow +30.0/30.0
- 1% rule +10.0/10.0
- DSCR +10.0/10.0
- Livability +4.0/5.0
- Rent growth +3.8/5.0
- Schools +3.4/10.0
- Condition / age +2.5/5.0
- ARV discount +0.0/15.0
- Appreciation +0.0/10.0
$134,900
🖨 Deal sheet 📄 Offer letter ✓ Due diligence
Listing remarks MLS
This is a triple wide!!! The seller fell in love with this house because of the cathedral ceilings of the LR and Master BR and thinks you will too. The kitchen is spacious and huge. There is a formal dining space. There is an oversized utility room. Please pardon our mess, still moving.
Key facts
- Spacious living area
- Front porch
- Outdoor retreat
Tags
Property features AI
Finance
- HOA & community: Community pool; Senior community
Exterior
- Parking: 2-car garage; Off-street parking
- Utilities: Public water; Sewer connected
- Home design: Manufactured home; Single-story; Residential property; Located on leased land (MFG on Leased Land)
- Construction: Frame, Masonite and wood siding construction; Slab foundation; Built as a manufactured home
- Exterior features: Composition roof; Shed(s)
Interior
- Kitchen: Dishwasher; Refrigerator
- Flooring: Carpet; Vinyl
- Bathrooms: 2 full bathrooms
- Heating & cooling: Central air conditioning; Forced air heating
- Interior features: Dishwasher; Refrigerator
Neighborhood map
What this means for you Summary
Snapshot
- This is a 3-bed/2.0-bath single-family listed at $135k.
Deal economics
- At list price, monthly cash flow is $808 ($10k/yr) — positive.
- The deal already cash-flows at list — no discount required.
- Meets the 1% rule at list price ($2k rent vs $135k).
- Recommended offer: $131k (3.0% below list) — sets the bar for market timing.
- Cap rate 13.5% vs local median 3.4% in Yakima — top-decile yield for the area; either an underpriced asset or a hidden risk that comps aren't pricing in. Stress-test before assuming the spread holds.
Location & tenants
- Location reads 80/100 on livability (#98 in WA, #1,912 nationally) — a professional / high-income tenant draw. Strengths: amenities A+, commute A+, housing A+; Watch: employment D, crime F.
- Yakima School District (urban): math 34% / reading 42% proficiency, ranked #238 of 291 in WA (top 82%) — families likely to look elsewhere, expect single-tenant / working-renter base with shorter leases; 76% free/reduced lunch — lower-income household profile, screen leases tightly.
- Market conditions: Rents rising fast (+5.1%/yr); 185 active listings in the ZIP; 5 comparable units currently listed for rent nearby; rentals lingering (median 44d on market — plan ~5-8 weeks vacancy on turnover, expect pricing pressure); 60% of comp listings sitting > 30 days — soft ceiling on asking rent; 468 units permitted in Yakima County in 2024 (23 in 5+ unit buildings).
- This rent runs 39% of the median local income ($63k/yr) — at the standard rent-burdened threshold; future hikes will face affordability resistance.
Forward outlook
- Local home prices are declining (-3.0%/yr); year-one equity from $933 of loan paydown is wiped out by about $4k of value loss. Plan a longer hold.
- Yakima County population projected at +6% by 2050 — modest demand growth; plan on rents tracking national, not racing it.
- At projected returns (-3.0% appreciation + 5.1% rent growth), your $38k cash investment doubles in ~5 years — after that, you're playing with house money.
Negotiation context
- It's been on market 46 days — a 3% lower offer ($131k) is reasonable based on typical stale-listing flexibility.
- 2 sale attempts since 13y ago with the ask held roughly flat each time — persistent listings suggest the price (not the market) is what's stuck; bring a comps-based counter.
- Current owner paid $40k; list at $135k implies a 237% gain — meaningful room to come down on a strong offer.
Risks & watch-outs
- Climate carrying-cost: moderate wildfire risk — expect insurance premiums to compound above CPI over the hold.
Questions for the listing agent
- It's been on market 46 days. Have you received any prior offers? Is the seller open to a 3% concession, seller financing, or rate buy-down credit?
- Is there a deadline driving the sale (1031 exchange, divorce, estate, relocation)? That informs how much negotiation room exists.
- Crime grade is F in this area — have there been break-ins, vandalism, or insurance claims at this property in the last 3 years? What carrier currently insures it and at what premium?
- What's the average days-on-market for RENTAL listings here right now (not sales)? A rising rental-DOM trend means longer vacancies and softer asking-rent achievability than the comps imply.
- What's the recent tenant-quality profile in this submarket — average credit score on applications, eviction rate, late-payment / NSF rate, and stable-employment percentage? A property-management company in the area should have these aggregated.
- How much new for-sale + rental construction is in the pipeline within 1–3 miles? Heavy new supply typically softens prices + rents 12–24 months out; constrained supply supports both.
Investment metrics
- 1% rule
- 1.51% ✓
- Cap rate
- 13.48%
- Cash-on-cash
- 25.66%
- DSCR
- 2.14
- GRM
- 5.5
CMA / ARV
- ARV (median comp)
- $94,885
- List price
- $134,900
- Delta
- 42.17%
- Verdict
- OVERPRICED
- Comps
- 4 within 1.0 mi
Show comp detail 9 sales within ~0.75 mi
| Address | Dist | Beds/Ba | Sqft | Sold | Price | $/sf | Match |
|---|---|---|---|---|---|---|---|
| 505 N 29th Pl | 0.68mi | 3/2.5 | 1,891 (+1%) | 6mo | $340,000 | $180 | 59 |
| 4307 Catalyss Way | 0.66mi | 3/2.0 | 1,973 (+5%) | 13mo | $663,500 | $336 | 49 |
| 4309 Catalyss Way | 0.67mi | 3/2.0 | 1,981 (+6%) | 19mo | $692,000 | $349 | 43 |
| 4303 Lexington Way | 0.65mi | 3/2.0 | 1,973 (+5%) | 22mo | $699,000 | $354 | 43 |
| 3508 Highview Dr | 0.63mi | 2/2.0 (-1) | 2,092 (+12%) | 12mo | $365,000 | $174 | 35 |
| 4400 Tayhill Way | 0.62mi | 3/2.0 | 1,690 (-10%) | 24mo | $544,582 | $322 | 35 |
| 4308 Tayhill Way | 0.61mi | 3/2.0 | 1,598 (-15%) | 15mo | $520,000 | $325 | 35 |
| 515 N 27th Ave | 0.73mi | 3/2.0 | 1,649 (-12%) | 15mo | $325,000 | $197 | 33 |
| 624 Estee Ct | 0.72mi | 2/2.0 (-1) | 1,709 (-9%) | 17mo | $320,000 | $187 | 32 |
Match score weights: distance 35% · size 25% · config 20% · recency 20%. Top-matched comps best support the ARV.
Projected returns pro-forma
-3.0% appreciation · 5.07% rent growth · sell at horizon
- IRR
- 21.4%
- Equity multiple
- 1.90×
- Total profit
- $33,871
- Equity at exit
- $20,114
- IRR
- 30.8%
- Equity multiple
- 4.02×
- Total profit
- $114,101
- Equity at exit
- $11,664
Cash invested: $37,772 (down + closing). Projections, not guarantees.
Landlord ↔ Tenant lean methodology
- Overall (STATE)
- 28 Tenant-Leaning
- State Washington
- 28 Tenant-Leaning · D+8
- County
- — inherits STATE
- City
- — inherits STATE
ZIP-level market 98902
- Rents YoY
- 5.1%
- Active inventory
- 185
- Price-to-rent
- 5.5×
Monthly cashflow live
- Estimated rent
- $2,040 high interval (Pro) →
- Mortgage (P&I)
- −$707
- Tax from tax record
- −$40 /mo · $480/yr
- Insurance
- −$56
- HOA
- −$0
- Vacancy / Maint / Mgmt
- −$428
- Net cashflow
- $808
Break-even live
UW: 25.0% down · 7.5% · 30yr · 1.5% tax · 5.0% vac · 8.0% maint · 8.0% mgmt
Financing live
Cash to close
- Down payment
- $33,725
- Closing costs
- $4,047
- Reserves months
- —
- Total cash needed
- —
Loan-product check · same deal, 3 products live
Conventional
25% down · 7.5% · 30yr
- Down + closing
- —
- Monthly P&I
- —
- Monthly cashflow
- —
- DSCR
- —
- Eligible?
- —
Personal DTI + credit; lowest rate.
DSCR
20% down · 8.5% · 30yr
- Down + closing
- —
- Monthly P&I
- —
- Monthly cashflow
- —
- DSCR
- —
- Eligible?
- —
No personal income docs; deal must DSCR.
Hard money
10% down · 12.0% · 12mo
- Down + closing
- —
- Monthly P&I
- —
- Monthly cashflow
- —
- DSCR
- —
- Eligible?
- —
Short-term bridge; refi at stabilization.
Rent comps 5 comps
| Address | Beds | Baths | Sqft | Rent | $/sqft | DOM | Units | Dist |
|---|---|---|---|---|---|---|---|---|
| 710 N 29th Ave #1 Yakima, WA | 3.0 | 2.5 | 1512 | $1,850 | $1.22 | 43d | 1 | 0.43mi |
| 4402 Tayhill Way Yakima, WA | 3.0 | 2.0 | 1589 | $3,200 | $2.01 | 43d | 1 | 0.60mi |
| 511 N 22nd Ave Yakima, WA | 4.0 | 2.5 | 2396 | $2,150 | $0.90 | 43d | 1 | 0.94mi |
| 5101 W Powerhouse Rd Unit 46 Yakima, WA | 2.0 | 2.5 | 1268 | $1,850 | $1.46 | 13d | 1 | 1.35mi |
| 305 N 50th Ave Yakima, WA | 3.0 | 2.0 | 1794 | $2,300 | $1.28 | 21d | 1 | 1.44mi |
Listing history 21 events
-
2026-06-19days on market $134,900 Active 46 DOM
-
2026-06-18days on market $134,900 Active 45 DOM
-
2026-06-17days on market $134,900 Active 44 DOM
-
2026-06-17price $134,900 Active 43 DOM
-
2026-06-16days on market $139,900 Active 43 DOM
-
2026-06-15days on market $139,900 Active 42 DOM
-
2026-06-14days on market $139,900 Active 40 DOM
-
2026-06-13days on market $139,900 Active 39 DOM
-
2026-06-10days on market $139,900 Active 37 DOM
-
2026-06-09days on market $139,900 Active 36 DOM
-
2026-06-08days on market $139,900 Active 35 DOM
-
2026-06-07days on market $139,900 Active 34 DOM
-
2026-06-05days on market $139,900 Active 31 DOM
-
2026-06-03days on market $139,900 Active 30 DOM
-
2026-06-02days on market $139,900 Active 29 DOM
-
2026-06-01days on market $139,900 Active 28 DOM
-
2026-05-31days on market $139,900 Active 27 DOM
-
2026-05-30days on market $139,900 Active 26 DOM
-
2026-05-04$139,900 Active 608-char remark
-
2014-06-02soldstatus $40,000 287-char remark
Show marketing remark (287 chars)
This is a triple wide!!! The seller fell in love with this house because of the cathedral ceilings of the LR and Master BR and thinks you will too. The kitchen is spacious and huge. There is a formal dining space. There is an oversized utility room. Please pardon our mess, still moving.
-
2013-12-16$42,500 287-char remark
Show marketing remark (287 chars)
This is a triple wide!!! The seller fell in love with this house because of the cathedral ceilings of the LR and Master BR and thinks you will too. The kitchen is spacious and huge. There is a formal dining space. There is an oversized utility room. Please pardon our mess, still moving.
ⓘ Source: listings_history table (triggers on properties + properties_extension) + one-shot
backfill from property_details.listing_events for pre-trigger history.
Tax reassessment forecast WA · Resets to sale price
- Current annual tax
- $480 · $40/mo
- Projected year-2 tax
- $1,322 · $110/mo
- Expected delta
- +$842/yr (+$70/mo · 175.5%)
ⓘ Screening estimate from a state-policy table — verify with the county assessor before closing.
Climate risk First Street
- Flood 1/10 Low FEMA zone X (unshaded) · 0% chance over 30 yrs
- Wildfire 5/10 Major
- Heat 4/10 Moderate 7 d/yr ≥97°F today · 14 d/yr by 30 yrs out
- Wind 1/10 Low
- Air quality 9/10 Extreme 14 unhealthy d/yr today · 16 by 30 yrs out
Nearby sold comps map
Loading sold comps map…
Walkable amenities ~0.75 mi
Loading nearby amenities…
Taxation est. · year 1
- Rental income
- $24,476
- − Mortgage interest
- −$7,556
- − Property taxes
- −$480
- − Insurance
- −$674
- − Repairs & maintenance
- −$1,958
- − Management
- −$1,958
- − Depreciation
- −$3,924
- Taxable income
- $7,925
- Est. tax owed @ 24.0%
- −$1,902
- After-tax cash flow
- $7,791/yr
For passive investors: Depreciation is non-cash, so a rental often shows a tax loss while cash-flowing — sheltering income. Rental losses are passive: they offset passive income freely, and up to $25,000/yr can offset ordinary (W-2) income if you actively participate and your MAGI is under $100k (phasing out to $0 by $150k); unused losses carry forward. On sale, claimed depreciation is recaptured at up to 25%, and gains may owe capital-gains tax (a 1031 exchange can defer both). Figures are a year-1 estimate at your 24.0% rate — not tax advice; consult a CPA.
Schools (NCES district)
- District
- Yakima School District
- NCES district ID
- 5310110
- Math proficiency
- 34% ▼ -1.00%
- Reading proficiency
- 42% ▬ 0.00%
- Median HH income
- $36,538
- Composite
- 34.04/100
- National rank
- #10305
- State rank
- #238 of 291 in WA
Livability — Yakima
- Score
- 80/100
- State rank
- #98
- US rank
- #1912
Category grades
Schools grade is shown separately in the Schools card above.
Census & demographics
- Census place
- Yakima, WA
- County
- Yakima County · 134,789 people
- City population
- 115,918
- Metro
- Yakima, WA
- Population (ZIP)
- 46,492
- Household income
- $63,092
- Rent vs Own
- Severe rent burden
- 1607.0
Population outlook (Yakima County) Hauer SSP2
- Today (2025)
- 256,514 people
- By 2030
- 259,403 · +1.1%
- By 2040
- 265,677 · +3.6%
- By 2050
- 273,061 · +6.5%
- By 2075
- 296,991 · +15.8%
- By 2100
- 315,291 · +22.9%
Race, ethnicity, and origin ACS 2023
- Neighborhood character
- Diverse neighborhood (Simpson 0.59)
- Race & ethnicity
- Hispanic / Latino 50% White 40% Two or more races 24% Black 2% Pacific Islander 2% Native American 1% Asian 1%
- Hispanic origin (detail)
- Mexican 44%
- Common ancestry
- Lithuanian 2% Slovak 1% Italian 1%
- Foreign-born
- 20% · Canada
- Languages at home
- 60% English-only · Spanish 37% Other Asian/Pacific 1%
Political lean MEDSL · Yakima
- 2024 margin
- R (+14.3) · D 41.6% · R 55.9% · Other 2.5%
- 2008→2024 swing
- -3.8pp toward R · 2008: -10.6pp · 2024: -14.3pp
- All cycles
- 2024: R+14.3 2020: R+7.7 2016: R+15.4 2012: R+15.1 2008: R+10.6
Not yet ingested
- Civics
- —
Market trends
- HPI YoY
- ▼ -363.66%
- Current HPI
- 294.559
- Rent YoY
- ▲ 5.07%
- Metro
- Yakima, WA
- State GDP YoY
- ▲ 4.65%
- F500 in state
- 22
Industry mix (Fortune 500 HQ in WA)
| Industry | F500 HQs | Revenue |
|---|---|---|
| Retail | 2 | $269B |
|
||
| Technology / Retail | 1 | $638B |
|
||
| Technology | 1 | $245B |
|
||
| Telecommunications | 1 | $38B |
|
||
| Food / Beverage | 1 | $36B |
|
||
| Automotive / Trucks | 1 | $34B |
|
||
Price history
+217.4% since first listed4 events — show timeline
- 2026-06-16 Price Changed $134,900 YAMLS
- 2026-05-04 Listed $139,900 YAMLS
- 2014-06-02 Sold (MLS) $40,000 YAMLS
- 2013-12-16 Listed $42,500 YAMLS
Property tax history
+1.6%/yrLatest (2026): $480 · -4.9% YoY. Source: county tax records.
Cash-flow waterfall
monthlySold comps — $/sqft
last 12 mo · ≤1 miLoading sold comps…