 Fourplex
258 Elm St · Barton, VT
Flood risk 1/10 · Minimal
- FEMA flood zone
- X
- Chance of flooding over 30 yrs
- 0.0%
- Est. flood insurance / yr
- $507 – $1,088
Fire risk 1/10 · Minimal
- Est. fire insurance / yr
- $480 – $892
Heat risk 2/10 · Minimal
- Hot days now (above 88°F)
- 8 days/yr
- Hot days in 30 yrs
- 18 days/yr
Wind risk 2/10 · Minimal
- Chance of severe wind over 30 yrs
- 4.0%
Air-quality risk 2/10 · Minimal
- Unhealthy air days now
- 1 days/yr
- Unhealthy air days in 30 yrs
- 1 days/yr
Risk factors via First Street. Map © Google.
Why this score? — see what drove the C- grade
The composite is a weighted blend of 9 inputs, each scored 0–100. Each bar is that input's sub-score; the figure is the points it added to the 100-point composite (weight × sub-score).
- Cash flow +15.0/30.0
- ARV discount +7.5/15.0
- Appreciation +6.8/10.0
- 1% rule +5.0/10.0
- DSCR +5.0/10.0
- Schools +5.0/10.0
- Livability +3.2/5.0
- Rent growth +2.5/5.0
- Condition / age +2.5/5.0
$65,000
🖨 Deal sheet 📄 Offer letter ✓ Due diligence
Multi-family units
County records classify this as Multi-Family (2-4 Unit). Listing-text estimate: 4 units. confirmed
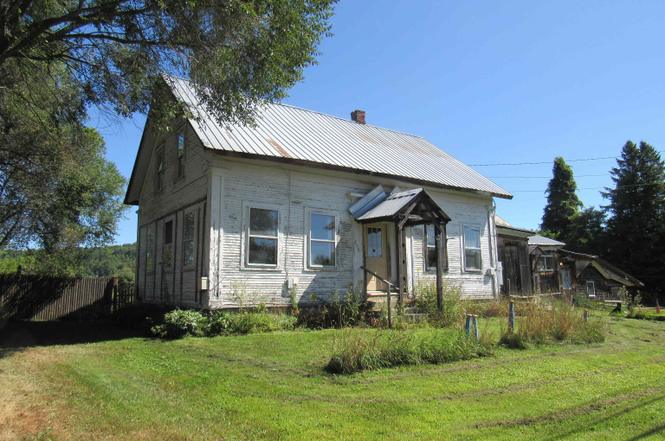
Listing remarks
This 1930 Vintage 4 Unit is being sold As-Is. It sets on a wonderful large, flat lot with a private back yard, distant mountain range views, gardens, berry bushes and offers Town water and Sewer. This property may be ideal for you to restore/rehab or the make use of it generous size footprint. It is a convenient location setting on the fringe of the center of town. Seller is Motivated. Book to Look!
Key facts
- Private back yard
- Large flat lot
- Gardens
Tags
Property features AI
Finance
- Other: Existing construction status; Directions: From Church St in Barton turn onto Elm St; the property is on the right.
Exterior
- Parking: Driveway parking
- Utilities: Community sewer; Community water; 100 Amp electrical service on-site; Internet via cable; Other utilities listed
- Home design: Apartment building / Cape style; White exterior
- Construction: Built in 1930; Wood frame construction; Metal roof; Unknown survey status
- Exterior features: Corner lot; Level lot; Gravel driveway; Public maintained road frontage (118 ft)
Interior
- Bedrooms: Four 2-bedroom units; One 1-bedroom unit
- Flooring: Carpet; Wood
- Bathrooms: Four full bathrooms
- Heating & cooling: Hot air heating; No central air
- Interior features: Interior-access basement; Partial, unfinished basement with dirt floor
Neighborhood map
What this means for you Summary
Snapshot
- This is a 4 × 2-bed/?-bath units multifamily listed at $65k.
Deal economics
- At list price, monthly cash flow is $5k ($61k/yr) — positive. Per door: $1k/mo.
- The deal already cash-flows at list — no discount required.
- Meets the 1% rule at list price ($7k rent vs $65k).
- Recommended offer: $57k (12.0% below list) — sets the bar for market timing.
Location & tenants
- Location reads 63/100 on livability (#68 in VT) — a middle-class / working-renter tenant base. Strengths: cost of living A+, housing B+, health & safety B+; Watch: crime D+, schools D-, amenities F.
- Market conditions: 22 active listings in the ZIP; 157 units permitted in Orleans County in 2024 (107 in 5+ unit buildings).
Forward outlook
- In year one you build about $3k of equity ($449 loan paydown + $2k appreciation (3.6% local appreciation)).
- Orleans County population projected at -19% by 2050 — secular population decline; favor cash flow + early exit over multi-decade hold.
- At projected returns (3.6% appreciation + 3.0% rent growth), your $18k cash investment doubles in ~1 year — after that, you're playing with house money.
Negotiation context
- It's been on market 288 days — a 12% lower offer ($57k) is reasonable based on typical stale-listing flexibility.
- 2 sale attempts; this cycle's ask has dropped $11k (14%) from the opening price — seller is motivated, your offer sets the floor, not the list.
Risks & watch-outs
- Watch-outs: built in 1930 — expect roof / HVAC / electrical / plumbing capex.
Questions for the listing agent
- It's been on market 288 days. Have you received any prior offers? Is the seller open to a 12% concession, seller financing, or rate buy-down credit?
- Can we see the unit-by-unit rent roll, current vacancy, and any below-market leases? What's the average tenancy length?
- What capital expenditures (roof, boiler, parking lot, exteriors) have been made in the last 5 years, and what's planned in the next 2?
- Built in 1930 — when were the roof, HVAC, electrical panel, plumbing, and water heater last replaced?
- Why hasn't it sold? Are there any deal-killer items the seller is aware of (foundation, flood, title, zoning, code violations)?
- Is there a deadline driving the sale (1031 exchange, divorce, estate, relocation)? That informs how much negotiation room exists.
- Schools are D-rated, which usually means shorter tenancies and higher turnover. Who's the typical renter profile here, and what's been the actual vacancy rate?
- Crime grade is D in this area — have there been break-ins, vandalism, or insurance claims at this property in the last 3 years? What carrier currently insures it and at what premium?
- What's the average days-on-market for RENTAL listings here right now (not sales)? A rising rental-DOM trend means longer vacancies and softer asking-rent achievability than the comps imply.
- What's the recent tenant-quality profile in this submarket — average credit score on applications, eviction rate, late-payment / NSF rate, and stable-employment percentage? A property-management company in the area should have these aggregated.
- How much new apartment / multifamily construction is in the pipeline within 1–3 miles? Heavy new supply (>2% of stock underway) typically softens rents 12–24 months out; light construction supports rent growth.
Investment metrics
- 1% rule
- 10.78% ✓
- Cap rate
- 100.15%
- Cash-on-cash
- 335.21%
- DSCR
- 15.91
- GRM
- 0.8
CMA / ARV
No comps found within radius.
Projected returns pro-forma
3.64% appreciation · 3.0% rent growth · sell at horizon
- IRR
- —
- Equity multiple
- 19.35×
- Total profit
- $333,947
- Equity at exit
- $31,579
- IRR
- —
- Equity multiple
- 41.25×
- Total profit
- $732,516
- Equity at exit
- $50,580
Cash invested: $18,200 (down + closing). Projections, not guarantees.
Landlord ↔ Tenant lean methodology
- Overall (STATE)
- 41 Moderately Tenant-Leaning
- State Vermont
- 41 Moderately Tenant-Leaning · D+15
- County
- — inherits STATE
- City
- — inherits STATE
ZIP-level market 05822
- Home prices YoY
- 1.8%
- Active inventory
- 22
- Price-to-rent
- 3.1×
Monthly cashflow live
- Estimated rent
- $7,004 medium interval (Pro) →
- Mortgage (P&I)
- −$341
- Tax est. 1.5%
- −$81 /mo · $975/yr
- Insurance
- −$27
- HOA
- −$0
- Vacancy / Maint / Mgmt
- −$1,471
- Net cashflow
- $5,084
Break-even live
4-unit breakdown (identical units grouped — click to expand)
| Units | Beds | Baths | Est. rent |
|---|---|---|---|
| 4× units | 2 | — | $7,004 |
| #1 | 2 | — | $1,751 |
| #2 | 2 | — | $1,751 |
| #3 | 2 | — | $1,751 |
| #4 | 2 | — | $1,751 |
| Total (4 units) | $7,004 | ||
UW: 25.0% down · 7.5% · 30yr · 1.5% tax · 5.0% vac · 8.0% maint · 8.0% mgmt
Financing live
Cash to close
- Down payment
- $16,250
- Closing costs
- $1,950
- Reserves months
- —
- Total cash needed
- —
Loan-product check · same deal, 3 products live
Conventional
25% down · 7.5% · 30yr
- Down + closing
- —
- Monthly P&I
- —
- Monthly cashflow
- —
- DSCR
- —
- Eligible?
- —
Personal DTI + credit; lowest rate.
DSCR
20% down · 8.5% · 30yr
- Down + closing
- —
- Monthly P&I
- —
- Monthly cashflow
- —
- DSCR
- —
- Eligible?
- —
No personal income docs; deal must DSCR.
Hard money
10% down · 12.0% · 12mo
- Down + closing
- —
- Monthly P&I
- —
- Monthly cashflow
- —
- DSCR
- —
- Eligible?
- —
Short-term bridge; refi at stabilization.
Listing history 18 events
-
2026-06-18days on market $65,000 Active 288 DOM
-
2026-06-17days on market $65,000 Active 287 DOM
-
2026-06-16days on market $65,000 Active 286 DOM
-
2026-06-15days on market $65,000 Active 285 DOM
-
2026-06-15days on market $65,000 Active 284 DOM
-
2026-06-13days on market $65,000 Active 283 DOM
-
2026-06-12days on market $65,000 Active 282 DOM
-
2026-06-09days on market $65,000 Active 279 DOM
-
2026-06-08days on market $65,000 Active 278 DOM
-
2026-06-08days on market $65,000 Active 277 DOM
-
2026-06-07days on market $65,000 Active 276 DOM
-
2026-06-03days on market $65,000 Active 273 DOM
-
2026-06-02days on market $65,000 Active 272 DOM
-
2026-06-01days on market $65,000 Active 271 DOM
-
2026-05-31pricedays on market $65,000 Active 270 DOM
-
2026-01-03status Active
-
2026-01-01historical
-
2025-09-01$75,900 Active
ⓘ Source: listings_history table (triggers on properties + properties_extension) + one-shot
backfill from property_details.listing_events for pre-trigger history.
Climate risk First Street
- Flood 1/10 Low FEMA zone X · 0% chance over 30 yrs
- Wildfire 1/10 Low
- Heat 2/10 Low 8 d/yr ≥88°F today · 18 d/yr by 30 yrs out
- Wind 2/10 Low 4% chance of damaging wind over 30 yrs
- Air quality 2/10 Low 1 unhealthy d/yr today · 1 by 30 yrs out
Nearby sold comps map
Loading sold comps map…
Walkable amenities ~0.75 mi
Loading nearby amenities…
Taxation est. · year 1
- Rental income
- $84,048
- − Mortgage interest
- −$3,641
- − Property taxes
- −$975
- − Insurance
- −$325
- − Repairs & maintenance
- −$6,724
- − Management
- −$6,724
- − Depreciation
- −$1,891
- Taxable income
- $63,768
- Est. tax owed @ 24.0%
- −$15,304
- After-tax cash flow
- $45,703/yr
For passive investors: Depreciation is non-cash, so a rental often shows a tax loss while cash-flowing — sheltering income. Rental losses are passive: they offset passive income freely, and up to $25,000/yr can offset ordinary (W-2) income if you actively participate and your MAGI is under $100k (phasing out to $0 by $150k); unused losses carry forward. On sale, claimed depreciation is recaptured at up to 25%, and gains may owe capital-gains tax (a 1031 exchange can defer both). Figures are a year-1 estimate at your 24.0% rate — not tax advice; consult a CPA.
Schools (NCES district)
No district data.
Livability — Barton
- Score
- 63/100
- State rank
- #68
- US rank
- #15172
Category grades
Schools grade is shown separately in the Schools card above.
Census & demographics
- Census place
- Barton, VT
- Population (ZIP)
- 1,999
Population outlook (Orleans County) Hauer SSP2
- Today (2025)
- 26,222 people
- By 2030
- 25,399 · -3.1%
- By 2040
- 23,350 · -11.0%
- By 2050
- 21,232 · -19.0%
- By 2075
- 16,543 · -36.9%
- By 2100
- 11,566 · -55.9%
Race, ethnicity, and origin ACS 2023
- Neighborhood character
- Predominantly White (91%)
- Race & ethnicity
- White 91% Two or more races 3% Hispanic / Latino 3% Black 2%
- Common ancestry
- Lithuanian 14% Slovak 5% Romanian 4%
- Foreign-born
- 5% · Canada
- Languages at home
- 94% English-only · Spanish 2% French/Haitian/Cajun 1%
Political lean MEDSL · Orleans
- 2024 margin
- Toss-up / Even · D 47.8% · R 49.4% · Other 2.8%
- 2008→2024 swing
- -29.1pp toward R · 2008: 27.5pp · 2024: -1.6pp
- All cycles
- 2024: R+1.6 2020: D+4.5 2016: D+0.2 2012: D+24.2 2008: D+27.5
Not yet ingested
- Civics
- —
Market trends
- HPI YoY
- ▲ 3.64%
- Current HPI
- 205.7059
- Rent YoY
- —
- Metro
- —
- State GDP YoY
- —
- F500 in state
- 0
Price history
3 events — show timeline
- 2026-01-03 Relisted — PrimeMLS
- 2026-01-01 Delisted — PrimeMLS
- 2025-09-01 Listed $75,900 PrimeMLS
Cash-flow waterfall
monthlySold comps — $/sqft
last 12 mo · ≤1 miLoading sold comps…