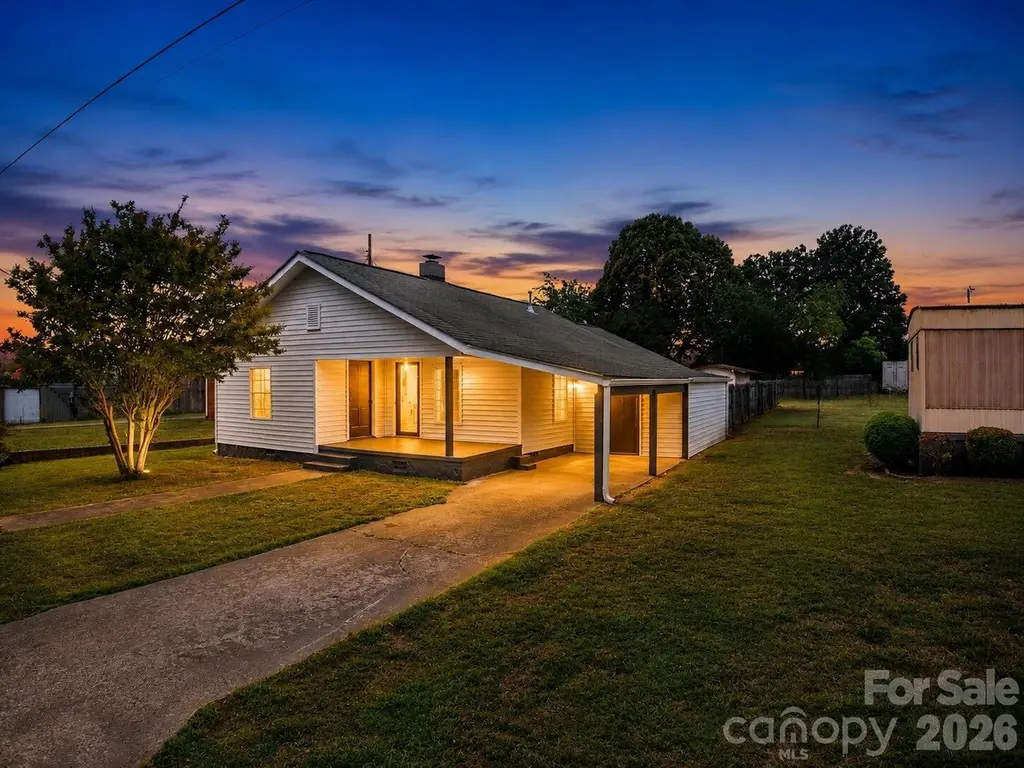
3620 2nd Ave SW · Long View, NC
Flood risk 1/10 · Minimal
- FEMA flood zone
- X (unshaded)
- Chance of flooding over 30 yrs
- 0.0%
- Est. flood insurance / yr
- $507 – $1,088
Fire risk 3/10 · Minor
- Est. fire insurance / yr
- $906 – $1,684
Heat risk 5/10 · Moderate
- Hot days now (above 102°F)
- 7 days/yr
- Hot days in 30 yrs
- 17 days/yr
Wind risk 2/10 · Minimal
- Chance of severe wind over 30 yrs
- 2.0%
Air-quality risk 3/10 · Minor
- Unhealthy air days now
- 2 days/yr
- Unhealthy air days in 30 yrs
- 2 days/yr
Risk factors via First Street. Map © Google.
Why this score? — see what drove the B grade
The composite is a weighted blend of 9 inputs, each scored 0–100. Each bar is that input's sub-score; the figure is the points it added to the 100-point composite (weight × sub-score).
- Cash flow +30.0/30.0
- 1% rule +10.0/10.0
- DSCR +10.0/10.0
- ARV discount +7.5/15.0
- Schools +3.8/10.0
- Rent growth +3.5/5.0
- Livability +3.2/5.0
- Condition / age +2.5/5.0
- Appreciation +0.0/10.0
$95,000
🖨 Deal sheet 📄 Offer letter ✓ Due diligence
Listing remarks MLS
Investor opportunity! Spacious 2 bedroom 1 bath home in Longview NC. Home in process of remodel and is being sold as is. Several windows have been updated throughout the home. Natural gas and septic is city sewer. Several kitchen cabinets come with the home for buyer to determine layout. Home has screened in back porch. Above ground pool included.
Key facts
- Updated windows
- Above ground pool
- 7,405 sq ft lot
Tags
Property features AI
Finance
- Other: Property zoned R-3; Workshop/outbuilding on the property
- HOA & community: No HOA
Exterior
- Parking: Attached carport (1 space)
- Utilities: City water; Public sewer
- Home design: Single-family residence; One level
- Construction: Site-built construction; Vinyl exterior; Crawl space foundation
- Exterior features: Deck; Front porch; Exterior storage; Fenced yard with privacy fencing; Cleared lot; Concrete road access (publicly maintained)
Interior
- Kitchen: Dishwasher; Electric cooktop; Electric oven; Microwave; Refrigerator
- Bedrooms: 3 bedrooms on the main level
- Flooring: Vinyl
- Bathrooms: 2 full bathrooms on the main level
- Heating & cooling: Natural gas heating; Central air conditioning
- Interior features: Open floorplan; Breakfast bar; Split bedroom layout; Walk-in closet(s); Insulated windows; Insulated doors; Fireplace (see remarks)
- Laundry & utility: Electric dryer hookup; Laundry located in hall
Neighborhood map
What this means for you Summary
Snapshot
- This is a 2-bed/1.0-bath single-family listed at $95k.
Deal economics
- At list price, monthly cash flow is $683 ($8k/yr) — positive.
- The deal already cash-flows at list — no discount required.
- Meets the 1% rule at list price ($2k rent vs $95k).
- Recommended offer: $84k (12.0% below list) — sets the bar for market timing.
Location & tenants
- Location reads 63/100 on livability (#416 in NC) — a middle-class / working-renter tenant base. Strengths: cost of living A+, housing A+, health & safety B; Watch: amenities F, commute F, employment F.
- Burke County Schools (rural): math 43% / reading 47% proficiency, ranked #89 of 178 in NC (top 50%) — families likely to look elsewhere, expect single-tenant / working-renter base with shorter leases.
- Zoned schools: Hildebran Elementary (math 37% / reading 42%, grade F, #694 of 1,410 statewide, top 53%, 320 students, 77% FRL); East Burke High (math 67% / reading 52%, grade C+, #216 of 535 statewide, top 43%, 879 students, 64% FRL) — zoned schools average 70% FRL vs 52% district-wide (18 pts higher); higher-poverty schools than district average — tighter screening recommended.
- Market conditions: Rents rising fast (+4.2%/yr); 212 active listings in the ZIP; 3 comparable units currently listed for rent nearby; rentals at typical pace (median 21d on market — plan ~3-4 weeks tenant-placement turnaround); 422 units permitted in Burke County in 2024 (94 in 5+ unit buildings).
- This rent runs 31% of the median local income ($62k/yr) — at the standard rent-burdened threshold; future hikes will face affordability resistance.
Forward outlook
- Local home prices are declining (-3.0%/yr); year-one equity from $657 of loan paydown is wiped out by about $3k of value loss. Plan a longer hold.
- Burke County population projected at -18% by 2050 — secular population decline; favor cash flow + early exit over multi-decade hold.
- At projected returns (-3.0% appreciation + 4.2% rent growth), your $27k cash investment doubles in ~4 years — after that, you're playing with house money.
Negotiation context
- It's been on market 132 days — a 12% lower offer ($84k) is reasonable based on typical stale-listing flexibility.
- 2 sale attempts; this cycle's ask has dropped $120k (56%) from the opening price — seller is motivated, your offer sets the floor, not the list.
- Current owner paid $70k; 36% above their basis — modest negotiation headroom, anchor on the comps not their cost.
Risks & watch-outs
- Watch-outs: built in 1925 — expect roof / HVAC / electrical / plumbing capex.
- Climate carrying-cost: extreme-heat days projected 7→17/yr by 2055 (HVAC capex compounding) — expect insurance premiums to compound above CPI over the hold.
Questions for the listing agent
- It's been on market 132 days. Have you received any prior offers? Is the seller open to a 12% concession, seller financing, or rate buy-down credit?
- Built in 1925 — when were the roof, HVAC, electrical panel, plumbing, and water heater last replaced?
- Why hasn't it sold? Are there any deal-killer items the seller is aware of (foundation, flood, title, zoning, code violations)?
- Is there a deadline driving the sale (1031 exchange, divorce, estate, relocation)? That informs how much negotiation room exists.
- Schools are F-rated, which usually means shorter tenancies and higher turnover. Who's the typical renter profile here, and what's been the actual vacancy rate?
- What's the average days-on-market for RENTAL listings here right now (not sales)? A rising rental-DOM trend means longer vacancies and softer asking-rent achievability than the comps imply.
- What's the recent tenant-quality profile in this submarket — average credit score on applications, eviction rate, late-payment / NSF rate, and stable-employment percentage? A property-management company in the area should have these aggregated.
- How much new for-sale + rental construction is in the pipeline within 1–3 miles? Heavy new supply typically softens prices + rents 12–24 months out; constrained supply supports both.
Investment metrics
- 1% rule
- 1.69% ✓
- Cap rate
- 14.92%
- Cash-on-cash
- 30.81%
- DSCR
- 2.37
- GRM
- 4.9
CMA / ARV
- ARV (on-the-fly)
- $275,184
- Comps found
- 12
Show comp detail 12 sales within ~0.75 mi
| Address | Dist | Beds/Ba | Sqft | Sold | Price | $/sf | Match |
|---|---|---|---|---|---|---|---|
| 330 33rd St SW | 0.14mi | 3/1.0 (+1) | 1,370 (-9%) | 11mo | $129,000 | $94 | 63 |
| 408 29th Street Pl SW | 0.42mi | 3/2.5 (+1) | 1,471 (-3%) | 8mo | $270,000 | $184 | 58 |
| 400 37th St SW | 0.26mi | 3/2.0 (+1) | 1,392 (-8%) | 11mo | $120,000 | $86 | 57 |
| 3985 1st Ave SW | 0.39mi | 2/2.0 | 1,693 (+12%) | 8mo | $175,000 | $103 | 51 |
| 937 37th St SW | 0.56mi | 3/2.5 (+1) | 1,475 (-2%) | 10mo | $269,000 | $182 | 51 |
| 206 11th St NE | 0.43mi | 3/2.0 (+1) | 1,330 (-12%) | 3mo | $195,000 | $147 | 49 |
| 515 37th St SW | 0.33mi | 3/1.0 (+1) | 1,313 (-13%) | 12mo | $221,000 | $168 | 48 |
| 300 Pine Meadows Cir | 0.68mi | 3/2.0 (+1) | 1,450 (-4%) | 12mo | $299,999 | $207 | 42 |
| 915 37th St SW | 0.54mi | 2/2.0 | 1,725 (+14%) | 12mo | $280,000 | $162 | 37 |
| 1013 37th St SW | 0.61mi | 3/2.0 (+1) | 1,300 (-14%) | 9mo | $274,500 | $211 | 32 |
| 103 Pine Meadows Cir | 0.70mi | 3/2.0 (+1) | 1,290 (-15%) | 11mo | $265,000 | $205 | 25 |
| 206 Pine Meadow St | 0.74mi | 3/2.0 (+1) | 1,296 (-14%) | 12mo | $305,000 | $235 | 23 |
Match score weights: distance 35% · size 25% · config 20% · recency 20%. Top-matched comps best support the ARV.
Projected returns pro-forma
-3.0% appreciation · 4.16% rent growth · sell at horizon
- IRR
- 26.8%
- Equity multiple
- 2.13×
- Total profit
- $29,977
- Equity at exit
- $14,165
- IRR
- 35.0%
- Equity multiple
- 4.38×
- Total profit
- $89,986
- Equity at exit
- $8,214
Cash invested: $26,600 (down + closing). Projections, not guarantees.
Landlord ↔ Tenant lean methodology
- Overall (STATE)
- 85 Strongly Landlord-Friendly
- State North Carolina
- 85 Strongly Landlord-Friendly · R+3
- County
- — inherits STATE
- City
- — inherits STATE
ZIP-level market 28602
- Home prices YoY
- -13.6%
- Rents YoY
- 4.2%
- Active inventory
- 212
- Price-to-rent
- 4.9×
Monthly cashflow live
- Estimated rent
- $1,604 medium interval (Pro) →
- Mortgage (P&I)
- −$498
- Tax from tax record
- −$46 /mo · $553/yr
- Insurance
- −$40
- HOA
- −$0
- Vacancy / Maint / Mgmt
- −$337
- Net cashflow
- $683
Break-even live
UW: 25.0% down · 7.5% · 30yr · 1.5% tax · 5.0% vac · 8.0% maint · 8.0% mgmt
Financing live
Cash to close
- Down payment
- $23,750
- Closing costs
- $2,850
- Reserves months
- —
- Total cash needed
- —
Loan-product check · same deal, 3 products live
Conventional
25% down · 7.5% · 30yr
- Down + closing
- —
- Monthly P&I
- —
- Monthly cashflow
- —
- DSCR
- —
- Eligible?
- —
Personal DTI + credit; lowest rate.
DSCR
20% down · 8.5% · 30yr
- Down + closing
- —
- Monthly P&I
- —
- Monthly cashflow
- —
- DSCR
- —
- Eligible?
- —
No personal income docs; deal must DSCR.
Hard money
10% down · 12.0% · 12mo
- Down + closing
- —
- Monthly P&I
- —
- Monthly cashflow
- —
- DSCR
- —
- Eligible?
- —
Short-term bridge; refi at stabilization.
Rent comps 3 comps
| Address | Beds | Baths | Sqft | Rent | $/sqft | DOM | Units | Dist |
|---|---|---|---|---|---|---|---|---|
| 823 31st St SW Hickory, NC | 3.0 | 2.5 | 1335 | $1,775 | $1.33 | 21d | 1 | 0.56mi |
| 130 18th St SW Hickory, NC | 3.0 | 2.5 | 1333 | $1,595 | $1.20 | 21d | 1 | 1.44mi |
| 128 18th Street Pl NW Hickory, NC | 3.0 | 2.5 | 1333 | $1,595 | $1.20 | 21d | 1 | 1.49mi |
Listing history 22 events
-
2026-06-19days on market $95,000 Active 132 DOM
-
2026-06-18days on market $95,000 Active 131 DOM
-
2026-06-17days on market $95,000 Active 130 DOM
-
2026-06-16days on market $95,000 Active 129 DOM
-
2026-06-15days on market $95,000 Active 128 DOM
-
2026-06-14days on market $95,000 Active 126 DOM
-
2026-06-13days on market $95,000 Active 125 DOM
-
2026-06-10days on market $95,000 Active 123 DOM
-
2026-06-09days on market $95,000 Active 122 DOM
-
2026-06-09pricestatusdays on market $95,000 Active 121 DOM
-
2026-06-08days on market $215,000 Active Under Contract 31 DOM
-
2026-06-07days on market $215,000 Active Under Contract 30 DOM
-
2026-06-05days on market $215,000 Active Under Contract 27 DOM
-
2026-06-02days on market $215,000 Active Under Contract 25 DOM
-
2026-06-01days on market $215,000 Active Under Contract 24 DOM
-
2026-05-31days on market $215,000 Active Under Contract 23 DOM
-
2026-05-30days on market $215,000 Active Under Contract 22 DOM
-
2026-05-10historical Active Under Contract
-
2026-05-08$215,000 Active
-
2026-02-20soldstatus $70,000
-
2026-02-07$95,000 Active 349-char remark
Show marketing remark (349 chars)
Investor opportunity! Spacious 2 bedroom 1 bath home in Longview NC. Home in process of remodel and is being sold as is. Several windows have been updated throughout the home. Natural gas and septic is city sewer. Several kitchen cabinets come with the home for buyer to determine layout. Home has screened in back porch. Above ground pool included.
-
1992-08-21soldstatus $25,000
ⓘ Source: listings_history table (triggers on properties + properties_extension) + one-shot
backfill from property_details.listing_events for pre-trigger history.
Tax reassessment forecast NC · Resets to sale price
- Current annual tax
- $553 · $46/mo
- Projected year-2 tax
- $779 · $65/mo
- Expected delta
- +$226/yr (+$19/mo · 40.9%)
ⓘ Screening estimate from a state-policy table — verify with the county assessor before closing.
Climate risk First Street
- Flood 1/10 Low FEMA zone X (unshaded) · 0% chance over 30 yrs
- Wildfire 3/10 Moderate
- Heat 5/10 Major 7 d/yr ≥102°F today · 17 d/yr by 30 yrs out
- Wind 2/10 Low 2% chance of damaging wind over 30 yrs
- Air quality 3/10 Moderate 2 unhealthy d/yr today · 2 by 30 yrs out
Nearby sold comps map
Loading sold comps map…
Walkable amenities ~0.75 mi
Loading nearby amenities…
Taxation est. · year 1
- Rental income
- $19,243
- − Mortgage interest
- −$5,321
- − Property taxes
- −$553
- − Insurance
- −$475
- − Repairs & maintenance
- −$1,539
- − Management
- −$1,539
- − Depreciation
- −$2,764
- Taxable income
- $7,051
- Est. tax owed @ 24.0%
- −$1,692
- After-tax cash flow
- $6,503/yr
For passive investors: Depreciation is non-cash, so a rental often shows a tax loss while cash-flowing — sheltering income. Rental losses are passive: they offset passive income freely, and up to $25,000/yr can offset ordinary (W-2) income if you actively participate and your MAGI is under $100k (phasing out to $0 by $150k); unused losses carry forward. On sale, claimed depreciation is recaptured at up to 25%, and gains may owe capital-gains tax (a 1031 exchange can defer both). Figures are a year-1 estimate at your 24.0% rate — not tax advice; consult a CPA.
Schools (NCES district)
- District
- Burke County Schools
- NCES district ID
- 3700480
- Math proficiency
- 43% ▼ -2.00%
- Reading proficiency
- 47% ▬ 0.00%
- Median HH income
- $38,342
- Composite
- 37.51/100
- National rank
- #4400
- State rank
- #89 of 178 in NC
Livability — Long View
- Score
- 63/100
- State rank
- #416
- US rank
- #15606
Category grades
Schools grade is shown separately in the Schools card above.
Census & demographics
- Census place
- Long View, NC
- County
- Catawba County · 105,763 people
- Metro
- Hickory-Lenoir-Morganton, NC
- Population (ZIP)
- 31,113
- Household income
- $62,048
- Rent vs Own
- Severe rent burden
- 642.0
Population outlook (Burke County) Hauer SSP2
- Today (2025)
- 86,552 people
- By 2030
- 84,123 · -2.8%
- By 2040
- 78,165 · -9.7%
- By 2050
- 71,099 · -17.9%
- By 2075
- 56,264 · -35.0%
- By 2100
- 44,742 · -48.3%
Race, ethnicity, and origin ACS 2023
- Neighborhood character
- Predominantly White (70%)
- Race & ethnicity
- White 70% Black 12% Hispanic / Latino 10% Two or more races 7% Asian 6%
- Hispanic origin (detail)
- Mexican 7%
- Common ancestry
- Slovak 3% Italian 3% Iranian 2%
- Foreign-born
- 6% · Canada, Dominican Republic
- Languages at home
- 88% English-only · Spanish 7% Other Asian/Pacific 4%
Political lean MEDSL · Burke
- 2024 margin
- Solid R (+41.2) · D 29.0% · R 70.3%
- 2008→2024 swing
- -22.0pp toward R · 2008: -19.2pp · 2024: -41.2pp
- All cycles
- 2024: R+41.2 2020: R+40.1 2016: R+39.4 2012: R+23.6 2008: R+19.2
Not yet ingested
- Civics
- —
Market trends
- HPI YoY
- ▼ -41.01%
- Current HPI
- 259.947
- Rent YoY
- ▲ 4.16%
- Metro
- Hickory-Lenoir-Morganton, NC
- State GDP YoY
- ▲ 3.28%
- F500 in state
- 26
Industry mix (Fortune 500 HQ in NC)
| Industry | F500 HQs | Revenue |
|---|---|---|
| Financial Services | 2 | $213B |
|
||
| Retail | 2 | $95B |
|
||
| Industrial Conglomerate | 1 | $38B |
|
||
| Metals / Steel | 1 | $35B |
|
||
| Utilities | 1 | $30B |
|
||
| Industrial Machinery | 1 | $19B |
|
||
Price history
+760.0% since first listed5 events — show timeline
- 2026-05-10 Contingent — CANOPYMLS as Distributed by MLS Grid
- 2026-05-08 Listed $215,000 CANOPYMLS as Distributed by MLS Grid
- 2026-02-20 Sold (Public Records) $70,000 Public Records
- 2026-02-07 Listed $95,000 ForSaleByOwner.com
- 1992-08-21 Sold (Public Records) $25,000 Public Records
Property tax history
+0.5%/yrLatest (2025): $553 · -1.4% YoY. Source: county tax records.
Cash-flow waterfall
monthlySold comps — $/sqft
last 12 mo · ≤1 miLoading sold comps…