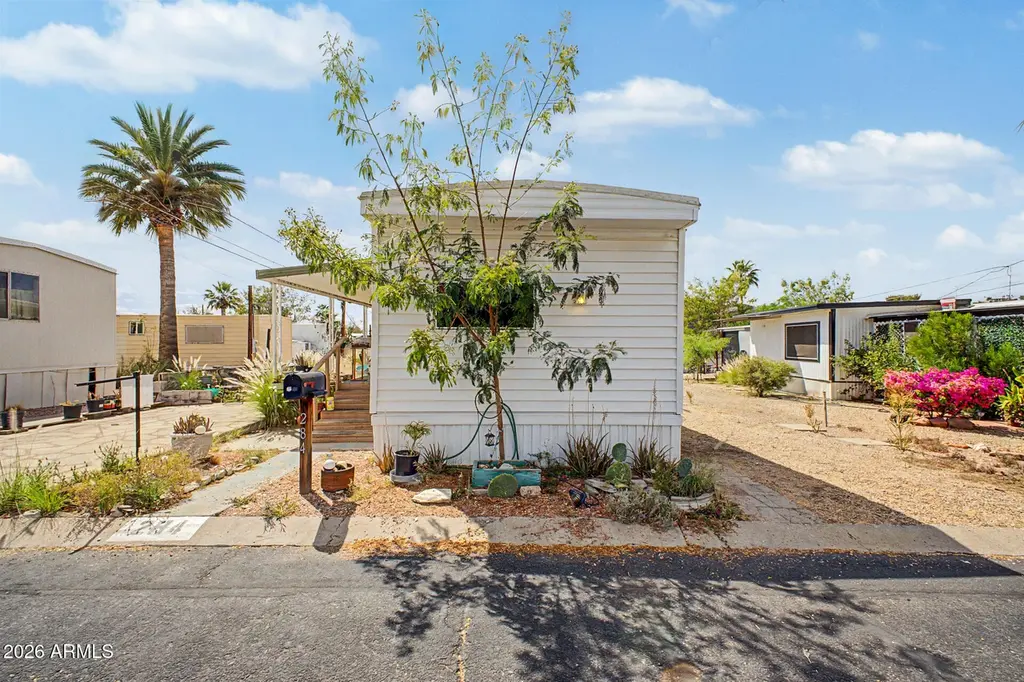
10401 N Cave Creek Rd #284 · Phoenix, AZ
Flood risk 1/10 · Minimal
- FEMA flood zone
- X (shaded)
- Chance of flooding over 30 yrs
- 0.0%
- Est. flood insurance / yr
- $507 – $1,088
Fire risk 2/10 · Minimal
- Est. fire insurance / yr
- $610 – $1,132
Heat risk 8/10 · Major
- Hot days now (above 110°F)
- 6 days/yr
- Hot days in 30 yrs
- 15 days/yr
Wind risk 1/10 · Minimal
- Chance of severe wind over 30 yrs
- —
Air-quality risk 3/10 · Minor
- Unhealthy air days now
- 3 days/yr
- Unhealthy air days in 30 yrs
- 4 days/yr
Risk factors via First Street. Map © Google.
Why this score? — see what drove the D grade
The composite is a weighted blend of 9 inputs, each scored 0–100. Each bar is that input's sub-score; the figure is the points it added to the 100-point composite (weight × sub-score).
- Cash flow +15.0/30.0
- ARV discount +7.5/15.0
- 1% rule +5.0/10.0
- DSCR +5.0/10.0
- Livability +3.8/5.0
- Condition / age +2.5/5.0
- Schools +2.3/10.0
- Rent growth +2.1/5.0
- Appreciation +0.0/10.0
$14,999
🖨 Deal sheet 📄 Offer letter ✓ Due diligence
Listing remarks
On Leased Land & 55 Plus Community: Charming 2-bedroom mobile home is now on the market! Inside, you'll find inviting living areas with wood-look flooring, plenty of natural light, and neutral colors, making every space perfect for entertaining and relaxation. The kitchen comes equipped with plentiful storage cabinetry, ample counter space, and built-in appliances for a seamless cooking experience. Two bedrooms promise a good night's sleep, both featuring a nice closet space and ceiling fans. Sip your morning coffee under the covered patio and enjoy the beautiful mountain views! Don't forget to visit the community's pool for a refreshing time! Welcome home!
Key facts
- Parking
- Community pool
- Built 1972
Property features AI
Finance
- HOA & community: Land lease: $820 monthly; No association fees included; Community pool
Exterior
- Parking: 1 open parking space
- Utilities: Public sewer; City water and private water company available
- Home design: Manufactured / mobile housing; Leasehold ownership; Mountain views
- Construction: Wood frame construction, painted exterior; Metal roof; Building area as reported by owner
- Exterior features: Partial fencing; Desert front and desert back lot characteristics; Private maintained road
Interior
- Kitchen: Laminate counters; Pantry; Refrigerator; Disposal
- Bedrooms: Up to 2 possible bedrooms
- Flooring: Laminate flooring; Tile flooring
- Bathrooms: 1 full bathroom (total)
- Heating & cooling: Heat pump heating; Ceiling fan cooling; Has heating and cooling
- Interior features: High-speed internet; No interior steps; Pantry; 3/4 bath in master bedroom; Bath lever faucets and grab bars (accessibility)
- Laundry & utility: Inside laundry
Neighborhood map
What this means for you Summary
Snapshot
- This is a 2-bed/1.0-bath manufactured listed at $15k.
Deal economics
- At list price, monthly cash flow is $893 ($11k/yr) — positive.
- The deal already cash-flows at list — no discount required.
- Meets the 1% rule at list price ($1k rent vs $15k).
- Recommended offer: $14k (6.0% below list) — sets the bar for market timing.
- Cap rate 77.7% vs local median 3.3% in Phoenix — top-decile yield for the area; either an underpriced asset or a hidden risk that comps aren't pricing in. Stress-test before assuming the spread holds.
Location & tenants
- Location reads 75/100 on livability (#16 in AZ, #3,924 nationally) — a middle-class / working-renter tenant base. Strengths: amenities A+, commute A+, housing A+; Watch: health & safety C-, crime F.
- Glendale Union High School District (4285) (urban): math 23% / reading 31% proficiency, ranked #130 of 249 in AZ (top 52%) — low school quality limits family demand, transient renter base, plan for 1-2y turnover.
- Market conditions: Rents soft (-1.8%/yr); 288 active listings in the ZIP; 40 comparable units currently listed for rent nearby; rentals leasing fast (median 1d on market — plan ~1-2 weeks tenant-placement turnaround); solid renter incomes; 36,011 units permitted in Maricopa County in 2024 (12,801 in 5+ unit buildings).
Forward outlook
- Local home prices are declining (-3.0%/yr); year-one equity from $103 of loan paydown is wiped out by about $450 of value loss. Plan a longer hold.
- Maricopa County population projected at +38% by 2050 — long-run rental-demand tailwind backs the buy-and-hold thesis.
- At projected returns (-3.0% appreciation + 0.0% rent growth), your $4k cash investment doubles in ~1 year — after that, you're playing with house money.
Negotiation context
- It's been on market 77 days — a 6% lower offer ($14k) is reasonable based on typical stale-listing flexibility.
Risks & watch-outs
- Climate carrying-cost: extreme-heat days projected 6→15/yr by 2055 (HVAC capex compounding) — expect insurance premiums to compound above CPI over the hold.
Questions for the listing agent
- It's been on market 77 days. Have you received any prior offers? Is the seller open to a 6% concession, seller financing, or rate buy-down credit?
- Built in 1972 — when were the roof, HVAC, electrical panel, plumbing, and water heater last replaced?
- Why hasn't it sold? Are there any deal-killer items the seller is aware of (foundation, flood, title, zoning, code violations)?
- Is there a deadline driving the sale (1031 exchange, divorce, estate, relocation)? That informs how much negotiation room exists.
- Crime grade is F in this area — have there been break-ins, vandalism, or insurance claims at this property in the last 3 years? What carrier currently insures it and at what premium?
- The area grade is low — what's the realistic commute time and amenity access for the typical tenant pool here? Any planned neighborhood developments (good or bad) we should know about?
- What's the average days-on-market for RENTAL listings here right now (not sales)? A rising rental-DOM trend means longer vacancies and softer asking-rent achievability than the comps imply.
- What's the recent tenant-quality profile in this submarket — average credit score on applications, eviction rate, late-payment / NSF rate, and stable-employment percentage? A property-management company in the area should have these aggregated.
- How much new for-sale + rental construction is in the pipeline within 1–3 miles? Heavy new supply typically softens prices + rents 12–24 months out; constrained supply supports both.
Investment metrics
- 1% rule
- 8.41% ✓
- Cap rate
- 77.72%
- Cash-on-cash
- 255.10%
- DSCR
- 12.35
- GRM
- 1.0
CMA / ARV
- ARV (on-the-fly)
- $34,400
- Comps found
- 10
Show comp detail 10 sales within ~0.75 mi
| Address | Dist | Beds/Ba | Sqft | Sold | Price | $/sf | Match |
|---|---|---|---|---|---|---|---|
| 10401 N Cave Creek Rd #275 | 0.16mi | 2/1.0 | 792 (-1%) | 8mo | $45,000 | $57 | 84 |
| 10401 N Cave Creek Rd #301 | 0.09mi | 2/1.0 | 850 (+6%) | 9mo | $24,000 | $28 | 78 |
| 10401 N Cave Creek Rd #274 | 0.00mi | 2/1.5 | 720 (-10%) | 7mo | $34,000 | $47 | 76 |
| 10401 N Cave Creek Rd #305 | 0.09mi | 2/2.0 | 728 (-9%) | 8mo | $33,333 | $46 | 70 |
| 10401 N Cave Creek Rd #263 | 0.16mi | 1/1.0 (-1) | 784 (-2%) | 18mo | $22,000 | $28 | 69 |
| 10401 N Cave Creek Rd #315 | 0.09mi | 2/1.0 | 860 (+8%) | 19mo | $27,500 | $32 | 68 |
| 10401 N Cave Creek Rd #115 | 0.08mi | 1/1.0 (-1) | 704 (-12%) | 8mo | $30,000 | $43 | 65 |
| 10401 N Cave Creek Rd #252 | 0.16mi | 2/1.5 | 912 (+14%) | 9mo | $29,000 | $32 | 60 |
| 10401 N Cave Creek Rd #331 | 0.09mi | 1/1.0 (-1) | 720 (-10%) | 20mo | $15,000 | $21 | 58 |
| 10401 N Cave Creek Rd #242 | 0.09mi | 2/1.5 | 896 (+12%) | 23mo | $42,500 | $47 | 55 |
Match score weights: distance 35% · size 25% · config 20% · recency 20%. Top-matched comps best support the ARV.
Projected returns pro-forma
-3.0% appreciation · 0.0% rent growth · sell at horizon
- IRR
- —
- Equity multiple
- 13.09×
- Total profit
- $50,755
- Equity at exit
- $2,236
- IRR
- —
- Equity multiple
- 25.58×
- Total profit
- $103,209
- Equity at exit
- $1,297
Cash invested: $4,200 (down + closing). Projections, not guarantees.
Landlord ↔ Tenant lean methodology
- Overall (STATE)
- 87 Strongly Landlord-Friendly
- State Arizona
- 87 Strongly Landlord-Friendly · R+3
- County
- — inherits STATE
- City
- — inherits STATE
ZIP-level market 85020
- Rents YoY
- -1.8%
- Active inventory
- 288
- Price-to-rent
- 1.0×
Monthly cashflow live
- Estimated rent
- $1,261 high interval (Pro) →
- Mortgage (P&I)
- −$79
- Tax est. 1.5%
- −$19 /mo · $225/yr
- Insurance
- −$6
- HOA
- −$0
- Vacancy / Maint / Mgmt
- −$265
- Net cashflow
- $893
Break-even live
UW: 25.0% down · 7.5% · 30yr · 1.5% tax · 5.0% vac · 8.0% maint · 8.0% mgmt
Financing live
Cash to close
- Down payment
- $3,750
- Closing costs
- $450
- Reserves months
- —
- Total cash needed
- —
Loan-product check · same deal, 3 products live
Conventional
25% down · 7.5% · 30yr
- Down + closing
- —
- Monthly P&I
- —
- Monthly cashflow
- —
- DSCR
- —
- Eligible?
- —
Personal DTI + credit; lowest rate.
DSCR
20% down · 8.5% · 30yr
- Down + closing
- —
- Monthly P&I
- —
- Monthly cashflow
- —
- DSCR
- —
- Eligible?
- —
No personal income docs; deal must DSCR.
Hard money
10% down · 12.0% · 12mo
- Down + closing
- —
- Monthly P&I
- —
- Monthly cashflow
- —
- DSCR
- —
- Eligible?
- —
Short-term bridge; refi at stabilization.
Rent comps 40 comps
| Address | Beds | Baths | Sqft | Rent | $/sqft | DOM | Units | Dist |
|---|---|---|---|---|---|---|---|---|
| 1525 E Cheryl Dr Phoenix, AZ | 1.0–2.0 | 1.0–2.0 | 843 | $1,157 | $1.37 | 1d | 6 | 0.14mi |
| 1420 E Brown St Unit C Phoenix, AZ | 2.0 | 1.0 | 840 | $1,295 | $1.54 | 1d | 1 | 0.16mi |
| 10410 N Cave Creek Rd Phoenix, AZ | 2.0–3.0 | 2.0 | 1227 | $1,400 | $1.14 | 1d | 4 | 0.19mi |
| 1551 E Christy Dr Phoenix, AZ | 2.0 | 1.0 | 702 | $950 | $1.35 | 24d | 1 | 0.21mi |
| 10644 N 15th Way Apt 3 Phoenix, AZ | 2.0 | 1.0 | 750 | $1,050 | $1.40 | 7d | 1 | 0.28mi |
| 10644 N 15th Way Apt 3 Phoenix, AZ | 2.0 | 1.0 | 750 | $1,050 | $1.40 | 24d | 1 | 0.28mi |
| 10644 N 15th Way Unit 08 Phoenix, AZ | 1.0 | 1.0 | 550 | $925 | $1.68 | 7d | 1 | 0.28mi |
| 9838 N 14th St #3 Phoenix, AZ | 1.0 | 1.0 | 550 | $1,150 | $2.09 | 1d | 1 | 0.30mi |
| 9816 N 15th St Unit 2 Phoenix, AZ | 1.0 | 1.0 | 780 | $1,200 | $1.54 | 1d | 1 | 0.32mi |
| 1346 E Mountain View Rd Unit 208 Phoenix, AZ | 2.0 | 1.0 | 800 | $999 | $1.25 | 1d | 1 | 0.35mi |
| 1336 E Mountain View Rd Phoenix, AZ | 2.0 | 2.0 | 885 | $1,150 | $1.30 | 1d | 2 | 0.36mi |
| 1336 E Mountain View Rd Phoenix, AZ | 2.0 | 2.0 | 885 | $1,250 | $1.41 | 23d | 2 | 0.36mi |
| 1336 E Mountain View Rd Unit 105 Phoenix, AZ | 2.0 | 2.0 | 885 | $1,350 | $1.53 | 17d | 1 | 0.36mi |
| 1247 E Cinnabar Ave Phoenix, AZ | 2.0 | 1.0 | 850 | $999 | $1.18 | 1d | 5 | 0.38mi |
| 1241 E Cinnabar Ave Unit 104A Phoenix, AZ | 2.0 | 1.0 | 848 | $999 | $1.18 | 23d | 1 | 0.38mi |
| 1241 E Cinnabar Ave Unit 102A Phoenix, AZ | 2.0 | 1.0 | 848 | $999 | $1.18 | 1d | 1 | 0.38mi |
| 1168 E Cochise Dr Phoenix, AZ | 2.0 | 2.5 | 1038 | $1,795 | $1.73 | 1d | 1 | 0.40mi |
| 1222 E Mountain View Rd #114 Phoenix, AZ | 2.0 | 1.0 | 783 | $1,099 | $1.40 | 16d | 1 | 0.46mi |
| 1222 E Mountain View Rd Phoenix, AZ | 2.0 | 1.0 | 783 | $1,024 | $1.31 | 1d | 3 | 0.47mi |
| 1230 E Purdue Ave Phoenix, AZ | 2.0 | 1.0 | 1000 | $1,450 | $1.45 | 1d | 1 | 0.49mi |
| 1306 E Purdue Ave Unit 4 Phoenix, AZ | 2.0 | 2.0 | 930 | $1,545 | $1.66 | 1d | 1 | 0.49mi |
| 10420 N 11th St #3 Phoenix, AZ | 2.0 | 1.0 | 1060 | $1,750 | $1.65 | 12d | 1 | 0.50mi |
| 1321 E Carol Ave Apt 3 Phoenix, AZ | 2.0 | 1.0 | 850 | $1,495 | $1.76 | 1d | 1 | 0.57mi |
| 10420 N 10th St #3 Phoenix, AZ | 2.0 | 1.5 | 1060 | $1,625 | $1.53 | 1d | 1 | 0.58mi |
| 10215 N 8th Pl Phoenix, AZ | 2.0 | 1.0 | 882 | $1,349 | $1.53 | 1d | 1 | 0.66mi |
| 9215 N 13th Pl Unit 5 Phoenix, AZ | 2.0 | 1.0 | 670 | $1,200 | $1.79 | 1d | 1 | 0.71mi |
| 731 E North Ln #3 Phoenix, AZ | 2.0 | 1.0 | 1060 | $1,900 | $1.79 | 1d | 1 | 0.79mi |
| 10001 N 7th St Phoenix, AZ | 2.0 | 1.0–2.0 | 604 | $1,229 | $2.03 | 1d | 11 | 0.86mi |
| 1401 E Dunlap Ave Unit 1413-04 Phoenix, AZ | 2.0 | 2.0 | 990 | $1,325 | $1.34 | 1d | 1 | 0.88mi |
| 823 E Carol Ave Unit 2 Phoenix, AZ | 2.0 | 1.0 | 532 | $1,200 | $2.26 | 1d | 1 | 0.89mi |
| 1136 E Eva St Phoenix, AZ | 2.0 | 1.0 | 736 | $1,600 | $2.17 | 1d | 1 | 0.90mi |
| 9514 N 8th St Unit 202 Phoenix, AZ | 2.0 | 1.0 | 724 | $1,050 | $1.45 | 1d | 1 | 0.92mi |
| 9028 N 11th St Unit 2 Phoenix, AZ | 2.0 | 1.0 | 850 | $1,050 | $1.24 | 1d | 1 | 0.95mi |
| 10002 N 7th St Phoenix, AZ | 1.0–3.0 | 1.0–2.0 | 1092 | $1,675 | $1.53 | 1d | 23 | 0.96mi |
| 888 E Clinton St Phoenix, AZ | 1.0–3.0 | 1.0–2.0 | 1024 | $1,559 | $1.52 | 1d | 30 | 0.98mi |
| 1027 E Dunlap Ave Unit 3 Phoenix, AZ | 2.0 | 1.0 | 550 | $1,100 | $2.00 | 1d | 1 | 1.02mi |
| 723 E Sunnyslope Ln Phoenix, AZ | 2.0 | 1.0 | 800 | $1,695 | $2.12 | 2d | 1 | 1.05mi |
| 723 E Sunnyslope Ln Phoenix, AZ | 2.0 | 1.0 | 794 | $1,695 | $2.13 | 1d | 1 | 1.05mi |
| 8916 N 11th St Unit A Phoenix, AZ | 1.0 | 1.0 | 799 | $900 | $1.13 | 2d | 1 | 1.06mi |
| 9603 N 5th St Unit B Phoenix, AZ | 1.0 | 1.0 | 530 | $945 | $1.78 | 10d | 1 | 1.08mi |
Listing history 15 events
-
2026-06-18days on market $14,999 Active 77 DOM
-
2026-06-17pricedays on market $14,999 Active 76 DOM
-
2026-06-16days on market $17,775 Active 75 DOM
-
2026-06-15days on market $17,775 Active 74 DOM
-
2026-06-13days on market $17,775 Active 72 DOM
-
2026-06-09days on market $17,775 Active 68 DOM
-
2026-06-08days on market $17,775 Active 67 DOM
-
2026-06-07days on market $17,775 Active 66 DOM
-
2026-06-04days on market $17,775 Active 63 DOM
-
2026-06-03pricedays on market $17,775 Active 62 DOM
-
2026-06-02days on market $19,999 Active 61 DOM
-
2026-06-01days on market $19,999 Active 60 DOM
-
2026-05-31days on market $19,999 Active 59 DOM
-
2026-05-04price $19,999
-
2026-03-13$23,500 Active
ⓘ Source: listings_history table (triggers on properties + properties_extension) + one-shot
backfill from property_details.listing_events for pre-trigger history.
Climate risk First Street
- Flood 1/10 Low FEMA zone X (shaded) · 0% chance over 30 yrs
- Wildfire 2/10 Low
- Heat 8/10 Severe 6 d/yr ≥110°F today · 15 d/yr by 30 yrs out
- Wind 1/10 Low
- Air quality 3/10 Moderate 3 unhealthy d/yr today · 4 by 30 yrs out
Nearby sold comps map
Loading sold comps map…
Walkable amenities ~0.75 mi
Loading nearby amenities…
Taxation est. · year 1
- Rental income
- $15,136
- − Mortgage interest
- −$840
- − Property taxes
- −$225
- − Insurance
- −$75
- − Repairs & maintenance
- −$1,211
- − Management
- −$1,211
- − Depreciation
- −$436
- Taxable income
- $11,138
- Est. tax owed @ 24.0%
- −$2,673
- After-tax cash flow
- $8,041/yr
For passive investors: Depreciation is non-cash, so a rental often shows a tax loss while cash-flowing — sheltering income. Rental losses are passive: they offset passive income freely, and up to $25,000/yr can offset ordinary (W-2) income if you actively participate and your MAGI is under $100k (phasing out to $0 by $150k); unused losses carry forward. On sale, claimed depreciation is recaptured at up to 25%, and gains may owe capital-gains tax (a 1031 exchange can defer both). Figures are a year-1 estimate at your 24.0% rate — not tax advice; consult a CPA.
Schools (NCES district)
- District
- Glendale Union High School District (4285)
- NCES district ID
- 0403450
- Math proficiency
- 23% ▼ -38.00%
- Reading proficiency
- 31% ▼ -19.00%
- Median HH income
- $40,846
- Composite
- 22.81/100
- National rank
- #8020
- State rank
- #130 of 249 in AZ
Livability — Phoenix
- Score
- 75/100
- State rank
- #16
- US rank
- #3924
Category grades
Schools grade is shown separately in the Schools card above.
Census & demographics
- Census place
- Phoenix, AZ
- County
- Maricopa County · 4,537,380 people
- City population
- 1,500,198
- Metro
- Phoenix-Mesa-Chandler, AZ
- Population (ZIP)
- 34,916
- Household income
- $83,735
- Rent vs Own
- Severe rent burden
- 2104.0
Population outlook (Maricopa County) Hauer SSP2
- Today (2025)
- 4,979,203 people
- By 2030
- 5,378,229 · +8.0%
- By 2040
- 6,156,598 · +23.6%
- By 2050
- 6,872,376 · +38.0%
- By 2075
- 8,401,270 · +68.7%
- By 2100
- 9,247,439 · +85.7%
Race, ethnicity, and origin ACS 2023
- Neighborhood character
- Diverse neighborhood (Simpson 0.57)
- Race & ethnicity
- White 60% Hispanic / Latino 26% Two or more races 12% Native American 5% Black 3% Asian 3%
- Hispanic origin (detail)
- Mexican 23%
- Common ancestry
- Romanian 4% Slovak 2% Portuguese 2%
- Foreign-born
- 13% · Canada, Guatemala, China
- Languages at home
- 79% English-only · Spanish 17% Other Indo-European 1% German/W. Germanic 1%
Political lean MEDSL · Maricopa
- 2024 margin
- Toss-up / Even · D 47.7% · R 51.2% · Other 1.1%
- 2008→2024 swing
- +7.1pp toward D · 2008: -10.6pp · 2024: -3.5pp
- All cycles
- 2024: R+3.5 2020: D+2.2 2016: R+3.5 2012: R+12.0 2008: R+10.6
Not yet ingested
- Civics
- —
Market trends
- HPI YoY
- ▼ -484.20%
- Current HPI
- 305.8855
- Rent YoY
- ▼ -1.77%
- Metro
- Phoenix-Mesa-Chandler, AZ
- State GDP YoY
- ▲ 4.54%
- F500 in state
- 20
Industry mix (Fortune 500 HQ in AZ)
| Industry | F500 HQs | Revenue |
|---|---|---|
| Technology | 2 | $13B |
|
||
| Mining / Metals | 1 | $23B |
|
||
| Environmental Services | 1 | $16B |
|
||
| Metals / Steel | 1 | $14B |
|
||
| Technology Distribution | 1 | $9B |
|
||
| Homebuilding | 1 | $8B |
|
||
Price history
-14.9% since first listed2 events — show timeline
- 2026-05-04 Price Changed $19,999 ARMLS
- 2026-03-13 Listed $23,500 ARMLS
Cash-flow waterfall
monthlySold comps — $/sqft
last 12 mo · ≤1 miLoading sold comps…