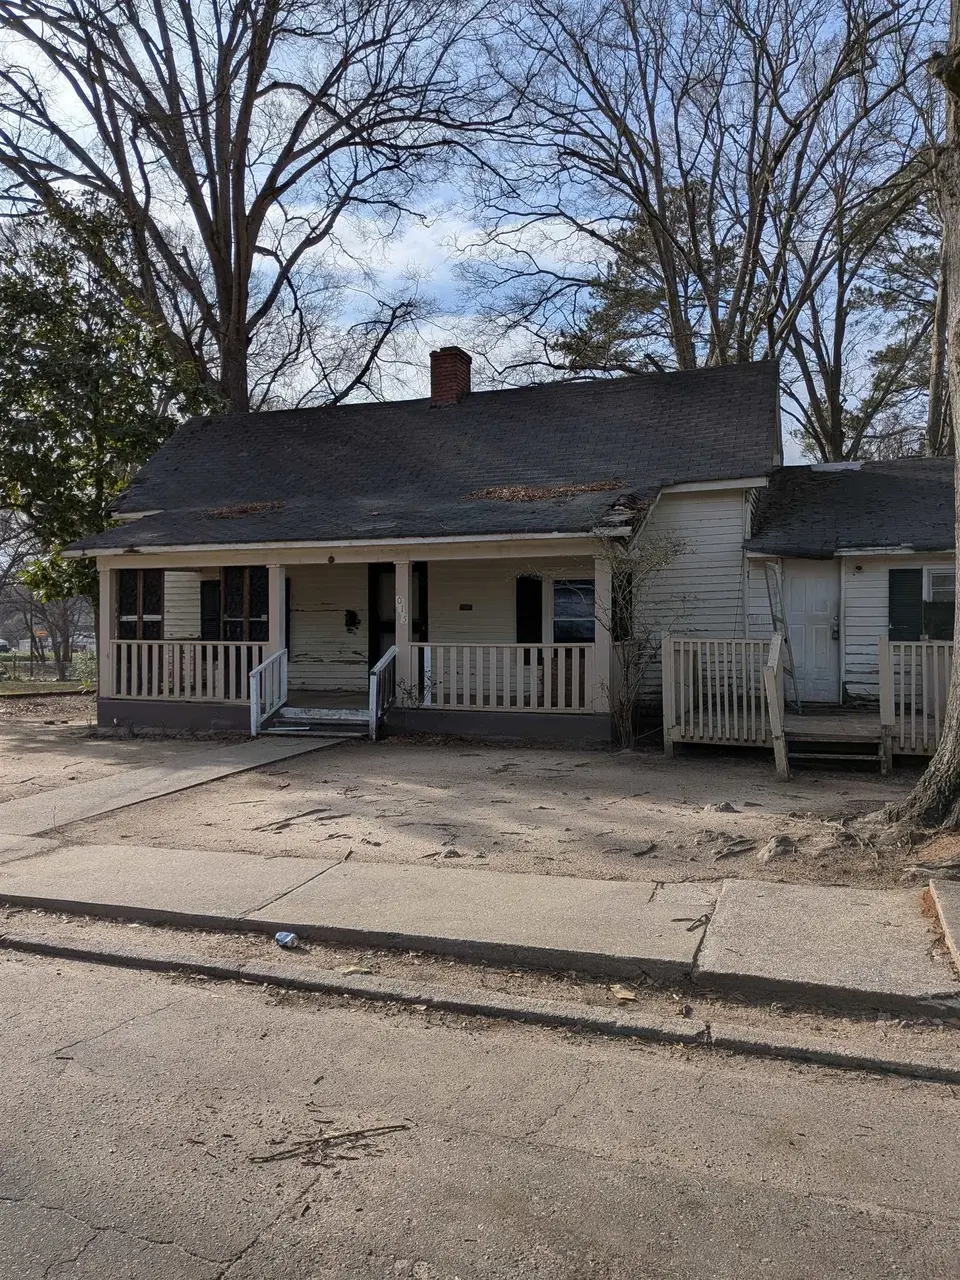
1015 N Granard St · Gaffney, SC
Flood risk 1/10 · Minimal
- FEMA flood zone
- X (unshaded)
- Chance of flooding over 30 yrs
- 0.0%
- Est. flood insurance / yr
- $507 – $1,088
Fire risk 2/10 · Minimal
- Est. fire insurance / yr
- $783 – $1,453
Heat risk 6/10 · Moderate
- Hot days now (above 103°F)
- 7 days/yr
- Hot days in 30 yrs
- 16 days/yr
Wind risk 3/10 · Minor
- Chance of severe wind over 30 yrs
- 4.0%
Air-quality risk 3/10 · Minor
- Unhealthy air days now
- 3 days/yr
- Unhealthy air days in 30 yrs
- 4 days/yr
Risk factors via First Street. Map © Google.
Why this score? — see what drove the B- grade
The composite is a weighted blend of 9 inputs, each scored 0–100. Each bar is that input's sub-score; the figure is the points it added to the 100-point composite (weight × sub-score).
- Cash flow +30.0/30.0
- 1% rule +10.0/10.0
- DSCR +10.0/10.0
- ARV discount +7.5/15.0
- Livability +3.3/5.0
- Schools +2.8/10.0
- Rent growth +2.5/5.0
- Condition / age +2.5/5.0
- Appreciation +0.0/10.0
$33,280
🖨 Deal sheet (PDF) 📄 Offer letter ✓ Due diligence
Listing remarks
Investor special in the heart of downtown Gaffney! This 2-bedroom, 1-bath home sits on a nice, level lot and offers great potential for renovation or rental income. With a little vision and TLC, this property could be transformed into a great investment or starter home. Conveniently located near local shops, dining, and amenities, the location adds to its appeal. Property is being sold as-is. Don’t miss this opportunity to bring your ideas to life!
Key facts
- Near dining
- Level lot
- Near local shops
Tags
Property features AI
Finance
- Other: Property tax listed (not included as financial detail per instructions)
Exterior
- Parking: Driveway
- Utilities: Public water; Public sewer; Cable available
- Home design: Single-family residence; One story; Residential property
- Construction: Wood siding; Composition roof; Built above grade (1,304 finished area)
- Exterior features: Porch; Level lot
Interior
- Kitchen: No appliances included
- Flooring: Carpet; Laminate
- Bathrooms: 1 full bathroom
- Heating & cooling: Has heating (see remarks for details); Has cooling (type listed as other)
- Interior features: Laminate counters; Carpet and laminate flooring; No built-in appliances
- Laundry & utility: Laundry on the main level
Neighborhood map
What this means for you Summary
Snapshot
- This is a 2-bed/1.0-bath single-family listed at $33k.
Deal economics
- At list price, monthly cash flow is $575 ($7k/yr) — positive.
- The deal already cash-flows at list — no discount required.
- Meets the 1% rule at list price ($1k rent vs $33k).
- Recommended offer: $32k (3.0% below list) — sets the bar for market timing.
- Cap rate 27.0% vs local median 2.6% in Gaffney — top-decile yield for the area; either an underpriced asset or a hidden risk that comps aren't pricing in. Stress-test before assuming the spread holds.
Location & tenants
- Location reads 66/100 on livability (#112 in SC) — a middle-class / working-renter tenant base. Strengths: cost of living A+, health & safety A+, housing A-; Watch: amenities D+, crime D, commute F.
- Cherokee 01 (rural): math 29% / reading 40% proficiency, ranked #47 of 80 in SC (top 59%) — families likely to look elsewhere, expect single-tenant / working-renter base with shorter leases; 64% free/reduced lunch — lower-income household profile, screen leases tightly.
- Zoned schools: John E. Ewing Middle (math 18% / reading 30%, grade F, #167 of 229 statewide, top 74%, 486 students, 100% FRL); Gaffney High (math 40% / reading 75%, grade C, #116 of 196 statewide, top 59%, 1,838 students, 84% FRL) — zoned schools average 92% FRL vs 64% district-wide (28 pts higher); higher-poverty schools than district average — tighter screening recommended.
- Market conditions: 196 active listings in the ZIP; 2 comparable units currently listed for rent nearby; 200 units permitted in Cherokee County in 2024 (0 in 5+ unit buildings).
Forward outlook
- Local home prices are declining (-3.0%/yr); year-one equity from $230 of loan paydown is wiped out by about $998 of value loss. Plan a longer hold.
- At projected returns (-3.0% appreciation + 3.0% rent growth), your $9k cash investment doubles in ~2 years — after that, you're playing with house money.
Negotiation context
- It's been on market 43 days — a 3% lower offer ($32k) is reasonable based on typical stale-listing flexibility.
- 2 sale attempts since 2y ago with the ask held roughly flat each time — persistent listings suggest the price (not the market) is what's stuck; bring a comps-based counter.
Risks & watch-outs
- Climate carrying-cost: extreme-heat days projected 7→16/yr by 2055 (HVAC capex compounding) — expect insurance premiums to compound above CPI over the hold.
Questions for the listing agent
- It's been on market 43 days. Have you received any prior offers? Is the seller open to a 3% concession, seller financing, or rate buy-down credit?
- Built in 1965 — when were the roof, HVAC, electrical panel, plumbing, and water heater last replaced?
- Is there a deadline driving the sale (1031 exchange, divorce, estate, relocation)? That informs how much negotiation room exists.
- Schools are D-rated, which usually means shorter tenancies and higher turnover. Who's the typical renter profile here, and what's been the actual vacancy rate?
- Crime grade is D in this area — have there been break-ins, vandalism, or insurance claims at this property in the last 3 years? What carrier currently insures it and at what premium?
- What's the average days-on-market for RENTAL listings here right now (not sales)? A rising rental-DOM trend means longer vacancies and softer asking-rent achievability than the comps imply.
- What's the recent tenant-quality profile in this submarket — average credit score on applications, eviction rate, late-payment / NSF rate, and stable-employment percentage? A property-management company in the area should have these aggregated.
- How much new for-sale + rental construction is in the pipeline within 1–3 miles? Heavy new supply typically softens prices + rents 12–24 months out; constrained supply supports both.
Investment metrics
- 1% rule
- 3.03% ✓
- Cap rate
- 27.01%
- Cash-on-cash
- 73.99%
- DSCR
- 4.29
- GRM
- 2.8
CMA / ARV
- ARV (on-the-fly)
- $166,912
- Comps found
- 12
Show comp detail 12 sales within ~0.75 mi
| Address | Dist | Beds/Ba | Sqft | Sold | Price | $/sf | Match |
|---|---|---|---|---|---|---|---|
| 306 Martin St St | 0.18mi | 3/2.0 (+1) | 1,302 (-0%) | 4mo | $167,000 | $128 | 79 |
| 508 W Frederick St | 0.46mi | 2/1.0 | 1,316 (+1%) | 6mo | $72,000 | $55 | 72 |
| 109 Washington Ave | 0.61mi | 3/1.0 (+1) | 1,300 (-0%) | 1mo | $118,500 | $91 | 65 |
| 608 Littlejohn St | 0.31mi | 3/2.0 (+1) | 1,215 (-7%) | 1mo | $170,000 | $140 | 64 |
| 205 Magnolia St | 0.42mi | 3/2.0 (+1) | 1,199 (-8%) | 1mo | $170,850 | $142 | 57 |
| 401 Elm St | 0.45mi | 3/1.0 (+1) | 1,374 (+5%) | 10mo | $75,000 | $55 | 56 |
| 504 Railroad Ave Ave | 0.44mi | 2/1.0 | 1,110 (-15%) | 3mo | $75,000 | $68 | 52 |
| 224 Hill St | 0.65mi | 2/1.0 | 1,180 (-10%) | 6mo | $65,000 | $55 | 49 |
| 205 E Robinson St | 0.37mi | 3/2.0 (+1) | 1,452 (+11%) | 7mo | $199,900 | $138 | 49 |
| 817 W Smith St | 0.71mi | 3/2.0 (+1) | 1,222 (-6%) | 3mo | $234,900 | $192 | 45 |
| 823 W Smith Street St | 0.73mi | 2/1.0 | 1,440 (+10%) | 11mo | $160,000 | $111 | 40 |
| 317 Sycamore St St | 0.75mi | 3/2.0 (+1) | 1,447 (+11%) | 1mo | $189,000 | $131 | 37 |
Match score weights: distance 35% · size 25% · config 20% · recency 20%. Top-matched comps best support the ARV.
Projected returns pro-forma
-3.0% appreciation · 3.0% rent growth · sell at horizon
- IRR
- 73.8%
- Equity multiple
- 4.35×
- Total profit
- $31,210
- Equity at exit
- $4,962
- IRR
- 77.6%
- Equity multiple
- 8.98×
- Total profit
- $74,338
- Equity at exit
- $2,877
Cash invested: $9,318 (down + closing). Projections, not guarantees.
Landlord ↔ Tenant lean methodology
- Overall (STATE)
- 90 Strongly Landlord-Friendly
- State South Carolina
- 90 Strongly Landlord-Friendly · R+6
- County
- — inherits STATE
- City
- — inherits STATE
ZIP-level market 29341
- Home prices YoY
- -24.1%
- Active inventory
- 196
- Price-to-rent
- 2.8×
Monthly cashflow live
- Estimated rent
- $1,007 medium interval (Pro) →
- Mortgage (P&I)
- −$175
- Tax from tax record
- −$33 /mo · $395/yr
- Insurance
- −$14
- HOA
- −$0
- Vacancy / Maint / Mgmt
- −$212
- Net cashflow
- $575
Break-even live
Sensitivity live
| Price | -10% $593 | -5% $584 | +0% $575 | +5% $565 | +10% $556 |
|---|---|---|---|---|---|
| Rent | -10% $495 | -5% $535 | +0% $575 | +5% $614 | +10% $654 |
| Rate | -1.0pp $591 | -0.5pp $583 | base $575 | +0.5pp $566 | +1.0pp $557 |
UW: 25.0% down · 7.5% · 30yr · 1.5% tax · 5.0% vac · 8.0% maint · 8.0% mgmt
Financing live
Cash to close
- Down payment
- $8,320
- Closing costs
- $998
- Reserves months
- —
- Total cash needed
- —
Loan-product check · same deal, 3 products live
Conventional
25% down · 7.5% · 30yr
- Down + closing
- —
- Monthly P&I
- —
- Monthly cashflow
- —
- DSCR
- —
- Eligible?
- —
Personal DTI + credit; lowest rate.
DSCR
20% down · 8.5% · 30yr
- Down + closing
- —
- Monthly P&I
- —
- Monthly cashflow
- —
- DSCR
- —
- Eligible?
- —
No personal income docs; deal must DSCR.
Hard money
10% down · 12.0% · 12mo
- Down + closing
- —
- Monthly P&I
- —
- Monthly cashflow
- —
- DSCR
- —
- Eligible?
- —
Short-term bridge; refi at stabilization.
Rent comps 2 comps
| Address | Beds | Baths | Sqft | Rent | $/sqft | DOM | Units | Dist |
|---|---|---|---|---|---|---|---|---|
| 506 S Oliver St Gaffney, SC | 1.0–2.0 | 1.0 | 900 | $955 | $1.06 | 17d | 5 | 0.98mi |
| 112 Martin Ln Gaffney, SC | 2.0 | 1.5 | 921 | $975 | $1.06 | 6d | 1 | 1.45mi |
Listing history 5 events
-
2026-05-15status Pending
-
2026-04-01$33,280 Active
-
2024-04-24historical
-
2024-04-21$55,000 Active
-
2005-11-09soldstatus $65,000
ⓘ Source: listings_history table (triggers on properties + properties_extension) + one-shot
backfill from property_details.listing_events for pre-trigger history.
Tax reassessment forecast SC · Resets to sale price
- Current annual tax
- $395 · $33/mo
- Projected year-2 tax
- $395 · $33/mo
- Expected delta
- $0/yr ($0/mo · 0.0%)
ⓘ Screening estimate from a state-policy table — verify with the county assessor before closing.
Climate risk First Street
- Flood 1/10 Low FEMA zone X (unshaded) · 0% chance over 30 yrs
- Wildfire 2/10 Low
- Heat 6/10 Major 7 d/yr ≥103°F today · 16 d/yr by 30 yrs out
- Wind 3/10 Moderate 4% chance of damaging wind over 30 yrs
- Air quality 3/10 Moderate 3 unhealthy d/yr today · 4 by 30 yrs out
Nearby sold comps map
Loading sold comps map…
Walkable amenities ~0.75 mi
Loading nearby amenities…
Taxation est. · year 1
- Rental income
- $12,089
- − Mortgage interest
- −$1,864
- − Property taxes
- −$395
- − Insurance
- −$166
- − Repairs & maintenance
- −$967
- − Management
- −$967
- − Depreciation
- −$968
- Taxable income
- $6,761
- Est. tax owed @ 24.0%
- −$1,623
- After-tax cash flow
- $5,272/yr
For passive investors: Depreciation is non-cash, so a rental often shows a tax loss while cash-flowing — sheltering income. Rental losses are passive: they offset passive income freely, and up to $25,000/yr can offset ordinary (W-2) income if you actively participate and your MAGI is under $100k (phasing out to $0 by $150k); unused losses carry forward. On sale, claimed depreciation is recaptured at up to 25%, and gains may owe capital-gains tax (a 1031 exchange can defer both). Figures are a year-1 estimate at your 24.0% rate — not tax advice; consult a CPA.
Schools (NCES district)
- District
- Cherokee 01
- NCES district ID
- 4501500
- Math proficiency
- 29% ▼ -9.00%
- Reading proficiency
- 40% ▼ -2.00%
- Median HH income
- $34,262
- Composite
- 28.39/100
- National rank
- #6768
- State rank
- #47 of 80 in SC
Livability — Gaffney
- Score
- 66/100
- State rank
- #112
- US rank
- #11549
Category grades
Schools grade is shown separately in the Schools card above.
Census & demographics
- Census place
- Gaffney, SC
- County
- Cherokee County · 41,410 people
- City population
- 41,410
- Metro
- Gaffney, SC
- Population (ZIP)
- 20,647
- Household income
- $58,029
- Rent vs Own
- Severe rent burden
- 452.0
Population outlook (Cherokee County) Hauer SSP2
- Today (2025)
- 58,602 people
- By 2030
- 59,336 · +1.3%
- By 2040
- 60,266 · +2.8%
- By 2050
- 60,314 · +2.9%
- By 2075
- 59,276 · +1.2%
- By 2100
- 53,788 · -8.2%
Race, ethnicity, and origin ACS 2023
- Neighborhood character
- Diverse neighborhood (Simpson 0.58)
- Race & ethnicity
- White 59% Black 26% Two or more races 9% Hispanic / Latino 8%
- Hispanic origin (detail)
- Mexican 4% Puerto Rican 1%
- Common ancestry
- Italian 2% Serbian 2% Slovak 2%
- Foreign-born
- 4% · Canada
- Languages at home
- 93% English-only · Spanish 6% Other Indo-European 1%
Political lean MEDSL · Cherokee
- 2024 margin
- Solid R (+51.4) · D 23.9% · R 75.3%
- 2008→2024 swing
- -22.0pp toward R · 2008: -29.3pp · 2024: -51.4pp
- All cycles
- 2024: R+51.4 2020: R+43.8 2016: R+41.7 2012: R+29.3 2008: R+29.3
Not yet ingested
- Civics
- —
Market trends
- HPI YoY
- ▼ -64.62%
- Current HPI
- 203.8038
- Rent YoY
- —
- Metro
- Gaffney, SC
- State GDP YoY
- ▲ 4.51%
- F500 in state
- 2
Industry mix (Fortune 500 HQ in SC)
| Industry | F500 HQs | Revenue |
|---|---|---|
| Packaging | 1 | $7B |
|
||
Price history
-48.8% since first listed5 events — show timeline
- 2026-05-15 Pending — SPMLS
- 2026-04-01 Listed $33,280 SPMLS
- 2024-04-24 Delisted — SPMLS
- 2024-04-21 Listed $55,000 SPMLS
- 2005-11-09 Sold (Public Records) $65,000 Public Records
Property tax history
+8.5%/yrLatest (2025): $395 · +8.9% YoY. Source: county tax records.
Cash-flow waterfall
monthlySold comps — $/sqft
last 12 mo · ≤1 miLoading sold comps…