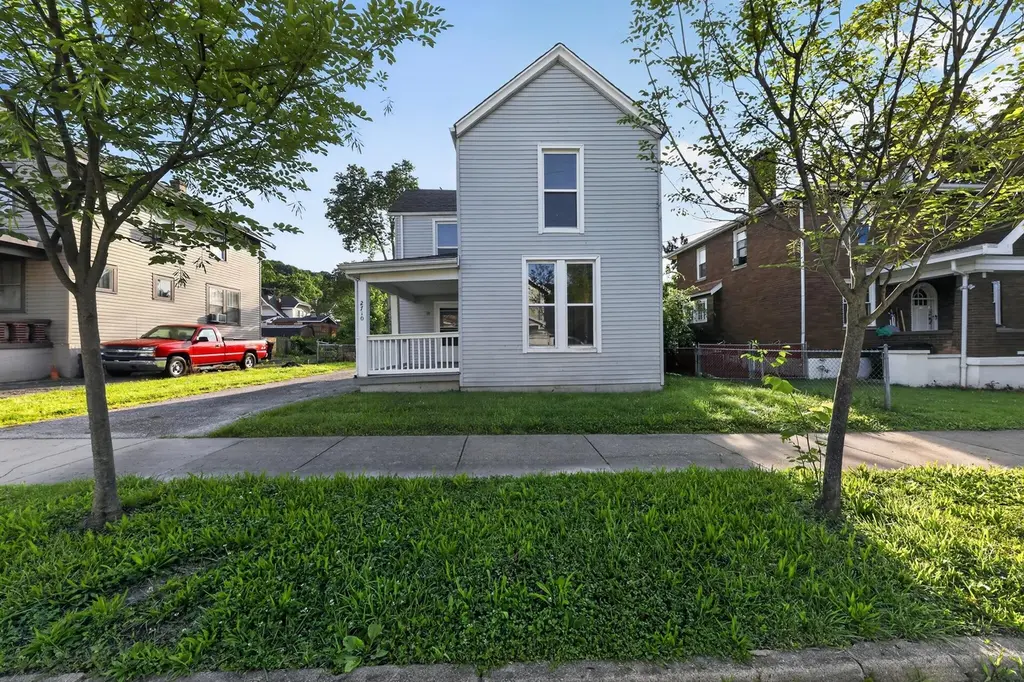
2710 Rosina Ave · Covington, KY
Flood risk 1/10 · Minimal
- FEMA flood zone
- X (unshaded)
- Chance of flooding over 30 yrs
- 0.0%
- Est. flood insurance / yr
- $507 – $1,088
Fire risk 1/10 · Minimal
- Est. fire insurance / yr
- $839 – $1,559
Heat risk 5/10 · Moderate
- Hot days now (above 102°F)
- 7 days/yr
- Hot days in 30 yrs
- 20 days/yr
Wind risk 2/10 · Minimal
- Chance of severe wind over 30 yrs
- 1.0%
Air-quality risk 3/10 · Minor
- Unhealthy air days now
- 2 days/yr
- Unhealthy air days in 30 yrs
- 3 days/yr
Risk factors via First Street. Map © Google.
Why this score? — see what drove the C grade
The composite is a weighted blend of 9 inputs, each scored 0–100. Each bar is that input's sub-score; the figure is the points it added to the 100-point composite (weight × sub-score).
- Cash flow +24.6/30.0
- DSCR +7.9/10.0
- ARV discount +7.6/15.0
- 1% rule +5.9/10.0
- Livability +4.3/5.0
- Rent growth +2.5/5.0
- Condition / age +2.5/5.0
- Schools +1.5/10.0
- Appreciation +0.0/10.0
$264,900
🖨 Deal sheet (PDF) 📄 Offer letter ✓ Due diligence
Listing remarks MLS
Charming 1906 Farmhouse with modern updates. Large rooms flooded with sunlight. Flexible floor plan with 3 bedrooms on second floor and 4th bedroom or family room on first floor. Large lot with 3 car garage on lot. Pre listing inspection report avaiable with list of repairs seller is willing to make. Garage sold as is.
Key facts
- Formal dining room
- Modern updates
- Flexible floor plan
Tags
Property features AI
Exterior
- Parking: Driveway; 3-car garage
- Utilities: Public water; Public sewer; Natural gas available
- Home design: Two-story single family house; Existing structure; Vinyl siding
- Construction: Stone foundation
- Exterior features: Composition/shingle roof; Partially wooded lot (55 x 120 / ~0.15 acre)
Interior
- Kitchen: Electric oven; Refrigerator
- Bedrooms: Primary bedroom (14 x 14); Bedroom 2 (14 x 10); Bedroom 3 (16 x 14); Bedroom 4 (14 x 14)
- Bathrooms: 2 full bathrooms; 1 half bathroom
- Heating & cooling: Forced air heating
- Interior features: Partial basement; Electric oven; Refrigerator; Forced air heating
Neighborhood map
What this means for you Summary
Snapshot
- This is a 5-bed/2.5-bath single-family listed at $265k.
Deal economics
- At list price, monthly cash flow is $546 ($7k/yr) — positive.
- The deal already cash-flows at list — no discount required.
- Meets the 1% rule at list price ($3k rent vs $265k).
- Recommended offer: $261k (1.5% below list) — sets the bar for market timing.
- Cap rate 8.8% vs local median 5.3% in Covington — top-decile yield for the area; either an underpriced asset or a hidden risk that comps aren't pricing in. Stress-test before assuming the spread holds.
Location & tenants
- Location reads 86/100 on livability (#40 in KY, #376 nationally) — a professional / high-income tenant draw. Strengths: amenities A+, commute A+, cost of living A+; Watch: employment D+.
- Covington Independent (suburban): math 10% / reading 27% proficiency, ranked #162 of 165 in KY (top 98%) — low school quality limits family demand, transient renter base, plan for 1-2y turnover; 78% free/reduced lunch — lower-income household profile, screen leases tightly.
- Zoned schools: Ninth District Elementary (math 2% / reading 17%, grade F, #648 of 676 statewide, top 98%, 341 students, 87% FRL); Holmes Middle School (math 8% / reading 26%, grade F, #211 of 217 statewide, top 97%, 656 students, 84% FRL); Holmes High School (math 12% / reading 17%, grade F, #227 of 254 statewide, top 89%, 878 students, 80% FRL).
- Market conditions: 161 active listings in the ZIP; 1 comparable units currently listed for rent nearby; 699 units permitted in Kenton County in 2024 (287 in 5+ unit buildings).
Forward outlook
- Local home prices are declining (-3.0%/yr); year-one equity from $2k of loan paydown is wiped out by about $8k of value loss. Plan a longer hold.
- Kenton County population projected at +5% by 2050 — modest demand growth; plan on rents tracking national, not racing it.
Negotiation context
- It's been on market 20 days — a 2% lower offer ($261k) is reasonable based on typical stale-listing flexibility.
- 7 sale attempts since 20y ago with the ask held roughly flat each time — persistent listings suggest the price (not the market) is what's stuck; bring a comps-based counter.
- Current owner paid $152k; list at $265k implies a 74% gain — meaningful room to come down on a strong offer.
Risks & watch-outs
- Watch-outs: built in 1899 — expect roof / HVAC / electrical / plumbing capex.
- Climate carrying-cost: extreme-heat days projected 7→20/yr by 2055 (HVAC capex compounding) — expect insurance premiums to compound above CPI over the hold.
Questions for the listing agent
- Built in 1899 — when were the roof, HVAC, electrical panel, plumbing, and water heater last replaced?
- Is there a deadline driving the sale (1031 exchange, divorce, estate, relocation)? That informs how much negotiation room exists.
- What's the average days-on-market for RENTAL listings here right now (not sales)? A rising rental-DOM trend means longer vacancies and softer asking-rent achievability than the comps imply.
- What's the recent tenant-quality profile in this submarket — average credit score on applications, eviction rate, late-payment / NSF rate, and stable-employment percentage? A property-management company in the area should have these aggregated.
- How much new for-sale + rental construction is in the pipeline within 1–3 miles? Heavy new supply typically softens prices + rents 12–24 months out; constrained supply supports both.
Investment metrics
- 1% rule
- 1.09% ✓
- Cap rate
- 8.77%
- Cash-on-cash
- 8.84%
- DSCR
- 1.39
- GRM
- 7.7
CMA / ARV
- ARV (on-the-fly)
- $265,236
- Comps found
- 6
Show comp detail 6 sales within ~0.75 mi
| Address | Dist | Beds/Ba | Sqft | Sold | Price | $/sf | Match |
|---|---|---|---|---|---|---|---|
| 3174 Rosina Ave | 0.29mi | 4/2.0 (-1) | 1,842 (-4%) | 6mo | $210,000 | $114 | 67 |
| 2807 Indiana Ave | 0.12mi | 5/2.5 | 2,110 (+10%) | 18mo | $260,000 | $123 | 63 |
| 2729 Rosina Ave | 0.06mi | 4/2.0 (-1) | 1,664 (-13%) | 12mo | $246,000 | $148 | 58 |
| 2251 Diana Pl | 0.50mi | 4/2.0 (-1) | 2,030 (+6%) | 4mo | $317,000 | $156 | 57 |
| 3141 Beech Ave | 0.30mi | 4/2.0 (-1) | 2,078 (+8%) | 11mo | $287,000 | $138 | 56 |
| 13 E 31st St | 0.48mi | 4/3.0 (-1) | 1,800 (-6%) | 20mo | $81,000 | $45 | 44 |
Match score weights: distance 35% · size 25% · config 20% · recency 20%. Top-matched comps best support the ARV.
Projected returns pro-forma
-3.0% appreciation · 3.0% rent growth · sell at horizon
- IRR
- -2.9%
- Equity multiple
- 0.89×
- Total profit
- $-8,158
- Equity at exit
- $39,497
- IRR
- 6.8%
- Equity multiple
- 1.51×
- Total profit
- $37,605
- Equity at exit
- $22,904
Cash invested: $74,172 (down + closing). Projections, not guarantees.
Landlord ↔ Tenant lean methodology
- Overall (STATE)
- 83 Strongly Landlord-Friendly
- State Kentucky
- 83 Strongly Landlord-Friendly · R+16
- County
- — inherits STATE
- City
- — inherits STATE
ZIP-level market 41015
- Active inventory
- 161
- Price-to-rent
- 7.7×
Monthly cashflow live
- Estimated rent
- $2,875 medium interval (Pro) →
- Mortgage (P&I)
- −$1,389
- Tax from tax record
- −$225 /mo · $2,706/yr
- Insurance
- −$110
- HOA
- −$0
- Vacancy / Maint / Mgmt
- −$604
- Net cashflow
- $546
Break-even live
Sensitivity live
| Price | -10% $696 | -5% $621 | +0% $546 | +5% $471 | +10% $396 |
|---|---|---|---|---|---|
| Rent | -10% $319 | -5% $433 | +0% $546 | +5% $660 | +10% $773 |
| Rate | -1.0pp $680 | -0.5pp $614 | base $546 | +0.5pp $478 | +1.0pp $408 |
UW: 25.0% down · 7.5% · 30yr · 1.5% tax · 5.0% vac · 8.0% maint · 8.0% mgmt
Financing live
Cash to close
- Down payment
- $66,225
- Closing costs
- $7,947
- Reserves months
- —
- Total cash needed
- —
Loan-product check · same deal, 3 products live
Conventional
25% down · 7.5% · 30yr
- Down + closing
- —
- Monthly P&I
- —
- Monthly cashflow
- —
- DSCR
- —
- Eligible?
- —
Personal DTI + credit; lowest rate.
DSCR
20% down · 8.5% · 30yr
- Down + closing
- —
- Monthly P&I
- —
- Monthly cashflow
- —
- DSCR
- —
- Eligible?
- —
No personal income docs; deal must DSCR.
Hard money
10% down · 12.0% · 12mo
- Down + closing
- —
- Monthly P&I
- —
- Monthly cashflow
- —
- DSCR
- —
- Eligible?
- —
Short-term bridge; refi at stabilization.
Rent comps 1 comps
| Address | Beds | Baths | Sqft | Rent | $/sqft | DOM | Units | Dist |
|---|---|---|---|---|---|---|---|---|
| 1808 Holman Ave Covington, KY | 6.0 | 2.5 | 2600 | $2,875 | $1.11 | 3d | 1 | 1.04mi |
Listing history 11 events
-
2026-06-21days on market $264,900 Active 20 DOM
-
2026-06-18days on market $264,900 Active 17 DOM
-
2026-06-17days on market $264,900 Active 16 DOM
-
2026-06-16days on market $264,900 Active 15 DOM
-
2026-06-15days on market $264,900 Active 14 DOM
-
2026-06-09days on market $264,900 Active 8 DOM
-
2026-06-08days on market $264,900 Active 7 DOM
-
2026-06-07days on market $264,900 Active 6 DOM
-
2026-06-03days on market $264,900 Active 2 DOM
-
2026-06-02remarks 693-char remark
-
2026-06-02$264,900 Active 1 DOM
ⓘ Source: listings_history table (triggers on properties + properties_extension) + one-shot
backfill from property_details.listing_events for pre-trigger history.
Tax reassessment forecast KY · Resets to sale price
- Current annual tax
- $2,706 · $225/mo
- Projected year-2 tax
- $2,706 · $225/mo
- Expected delta
- $0/yr ($0/mo · 0.0%)
ⓘ Screening estimate from a state-policy table — verify with the county assessor before closing.
Climate risk First Street
- Flood 1/10 Low FEMA zone X (unshaded) · 0% chance over 30 yrs
- Wildfire 1/10 Low
- Heat 5/10 Major 7 d/yr ≥102°F today · 20 d/yr by 30 yrs out
- Wind 2/10 Low 100% chance of damaging wind over 30 yrs
- Air quality 3/10 Moderate 2 unhealthy d/yr today · 3 by 30 yrs out
Nearby sold comps map
Loading sold comps map…
Walkable amenities ~0.75 mi
Loading nearby amenities…
Taxation est. · year 1
- Rental income
- $34,500
- − Mortgage interest
- −$14,839
- − Property taxes
- −$2,706
- − Insurance
- −$1,324
- − Repairs & maintenance
- −$2,760
- − Management
- −$2,760
- − Depreciation
- −$7,706
- Taxable income
- $2,405
- Est. tax owed @ 24.0%
- −$577
- After-tax cash flow
- $5,977/yr
For passive investors: Depreciation is non-cash, so a rental often shows a tax loss while cash-flowing — sheltering income. Rental losses are passive: they offset passive income freely, and up to $25,000/yr can offset ordinary (W-2) income if you actively participate and your MAGI is under $100k (phasing out to $0 by $150k); unused losses carry forward. On sale, claimed depreciation is recaptured at up to 25%, and gains may owe capital-gains tax (a 1031 exchange can defer both). Figures are a year-1 estimate at your 24.0% rate — not tax advice; consult a CPA.
Schools (NCES district)
- District
- Covington Independent
- NCES district ID
- 2101350
- Math proficiency
- 10% ▼ -20.00%
- Reading proficiency
- 27% ▼ -14.00%
- Median HH income
- $33,681
- Composite
- 15.04/100
- National rank
- #9353
- State rank
- #162 of 165 in KY
Livability — Covington
- Score
- 86/100
- State rank
- #40
- US rank
- #376
Category grades
Schools grade is shown separately in the Schools card above.
Census & demographics
- Census place
- Covington, KY
- City population
- 34,373
- Population (ZIP)
- 20,396
Population outlook (Kenton County) Hauer SSP2
- Today (2025)
- 174,205 people
- By 2030
- 177,897 · +2.1%
- By 2040
- 182,671 · +4.9%
- By 2050
- 183,543 · +5.4%
- By 2075
- 178,977 · +2.7%
- By 2100
- 159,920 · -8.2%
Race, ethnicity, and origin ACS 2023
- Neighborhood character
- Predominantly White (90%)
- Race & ethnicity
- White 90% Two or more races 6% Black 3% Hispanic / Latino 2%
- Common ancestry
- Lithuanian 2% Romanian 2% Slovak 2%
- Foreign-born
- 2% · Canada
- Languages at home
- 97% English-only · Arabic 1% French/Haitian/Cajun 1%
Political lean MEDSL · Kenton
- 2024 margin
- Strong R (+21.7) · D 38.2% · R 59.9% · Other 1.9%
- 2008→2024 swing
- -0.9pp no change · 2008: -20.9pp · 2024: -21.7pp
- All cycles
- 2024: R+21.7 2020: R+19.3 2016: R+26.1 2012: R+24.3 2008: R+20.9
Not yet ingested
- Civics
- —
Market trends
- HPI YoY
- ▼ -110.37%
- Current HPI
- 203.7263
- Rent YoY
- —
- Metro
- —
- State GDP YoY
- ▲ 1.81%
- F500 in state
- 4
Industry mix (Fortune 500 HQ in KY)
| Industry | F500 HQs | Revenue |
|---|---|---|
| Healthcare | 1 | $118B |
|
||
| Food / Beverage | 1 | $7B |
|
||
Price history
+783.0% since first listed18 events — show timeline
- 2026-06-01 Listed $264,900 NKMLS
- 2021-08-05 Sold (MLS) $152,000 NKMLS
- 2021-07-22 Pending — NKMLS
- 2021-07-22 Sold (MLS) $152,000 NKMLS
- 2021-07-18 Listed $159,000 NKMLS
- 2015-01-26 Sold (MLS) $36,000 NKMLS
- 2014-12-31 Listed $49,900 NKMLS
- 2014-12-12 Listing Removed — NKMLS
- 2014-01-26 Listed $102,000 NKMLS
- 2008-01-18 Listing Removed — NKMLS
- 2007-07-18 Listed $150,000 NKMLS
- 2006-12-26 Sold (MLS) $40,000 NKMLS
- 2006-12-26 Sold (MLS) $40,000 ImagineMLS
- 2006-09-28 Listed $38,900 NKMLS
- 2006-09-28 Listed $38,900 ImagineMLS
- 2002-10-24 Sold (Public Records) $71,000 Public Records
- 1991-03-25 Sold (Public Records) $53,500 Public Records
- 1985-01-28 Sold (Public Records) $30,000 Public Records
Property tax history
+4.7%/yrLatest (2025): $2,706 · +0.7% YoY. Source: county tax records.
Cash-flow waterfall
monthlySold comps — $/sqft
last 12 mo · ≤1 miLoading sold comps…