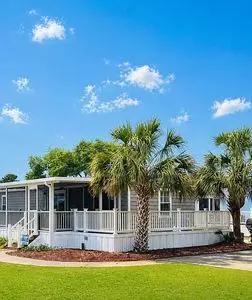
209 Goose Creek Blvd · Bogue, NC
Flood risk 3/10 · Minor
- FEMA flood zone
- X (unshaded)
- Chance of flooding over 30 yrs
- 0.2%
- Est. flood insurance / yr
- $507 – $1,088
Fire risk 4/10 · Minor
- Est. fire insurance / yr
- $906 – $1,684
Heat risk 9/10 · Severe
- Hot days now (above 103°F)
- 7 days/yr
- Hot days in 30 yrs
- 21 days/yr
Wind risk 8/10 · Major
- Chance of severe wind over 30 yrs
- 99.0%
Air-quality risk 2/10 · Minimal
- Unhealthy air days now
- 2 days/yr
- Unhealthy air days in 30 yrs
- 2 days/yr
Risk factors via First Street. Map © Google.
Why this score? — see what drove the B grade
The composite is a weighted blend of 9 inputs, each scored 0–100. Each bar is that input's sub-score; the figure is the points it added to the 100-point composite (weight × sub-score).
- Cash flow +30.0/30.0
- 1% rule +10.0/10.0
- DSCR +10.0/10.0
- ARV discount +7.5/15.0
- Schools +5.1/10.0
- Livability +3.2/5.0
- Rent growth +2.5/5.0
- Condition / age +2.5/5.0
- Appreciation +0.0/10.0
$425,000
🖨 Deal sheet (PDF) 📄 Offer letter ✓ Due diligence
Listing remarks MLS
EXCEPTIONAL ENERGY EFFICIENT 16 WIDE MH WITH MANY EXTRAS INCLUDES SCREEN PORCH & STORAGE BUILDING 2X6 EXTERIOR WALLSLOCATED IN WATERFRONT MOBILE HOME COMMUNITY WITH 2 CONCRETE BOAT RAMPS, 250 FT. DAYDOCK/PIER, LARGE SWIMMING POOL,COVERED PICNIC AREA,LARGE WATERFRONT AREA. Appliances: SURFACE STOVE Construction: 2X6 EXTERIOR WALLS Foundation: TO COUNTY CODE Sewer: SEPTIC TANK Water: WEST CARTERET
Key facts
- Direct icw access
- Community pool
- Waterfront park
Tags
Neighborhood map
What this means for you Summary
Snapshot
- This is a 3-bed/2.0-bath manufactured listed at $425k.
Deal economics
- At list price, monthly cash flow is $7k ($90k/yr) — positive.
- The deal already cash-flows at list — no discount required.
- Meets the 1% rule at list price ($13k rent vs $425k).
- Recommended offer: $412k (3.0% below list) — sets the bar for market timing.
Location & tenants
- Location reads 65/100 on livability (#311 in NC) — a middle-class / working-renter tenant base. Strengths: employment A+, housing A+, cost of living A; Watch: amenities F, commute F, health & safety D-.
- Carteret County Public Schools (rural): math 59% / reading 61% proficiency, ranked #31 of 178 in NC (top 17%) — acceptable for families but not a draw, mixed tenant base, ~2y average lease.
- Zoned schools: White Oak Elementary (math 76% / reading 65%, grade A-, #88 of 1,410 statewide, top 6%, 772 students, 100% FRL); Broad Creek Middle (math 63% / reading 68%, grade A-, #28 of 475 statewide, top 6%, 710 students, 100% FRL); Croatan High (math 82% / reading 78%, grade A, #73 of 535 statewide, top 13%, 974 students, 26% FRL) — zoned schools average 75% FRL vs 39% district-wide (36 pts higher); higher-poverty schools than district average — tighter screening recommended.
- Zoned-school proficiency averages 72% at this address vs 60% district-wide (+12 pts) — the actual schools serving this property are materially stronger than the Carteret County Public Schools average implies; a family-tenant draw the district grade alone would hide.
- Market conditions: 216 active listings in the ZIP; 935 units permitted in Carteret County in 2024 (360 in 5+ unit buildings).
- At $12,635/mo this rent would consume 216% of the median local household income ($70k/yr) (locally 461% of renters already pay >50% of income on rent) — very limited rent-growth headroom before tenants either downsize or default.
Forward outlook
- Local home prices are declining (-3.0%/yr); year-one equity from $3k of loan paydown is wiped out by about $13k of value loss. Plan a longer hold.
- Carteret County population projected at +9% by 2050 — modest demand growth; plan on rents tracking national, not racing it.
- At projected returns (-3.0% appreciation + 3.0% rent growth), your $119k cash investment doubles in ~2 years — after that, you're playing with house money.
Negotiation context
- It's been on market 38 days — a 3% lower offer ($412k) is reasonable based on typical stale-listing flexibility.
- 3 sale attempts since 15y ago with the ask held roughly flat each time — persistent listings suggest the price (not the market) is what's stuck; bring a comps-based counter.
- Current owner paid $340k; 25% above their basis — modest negotiation headroom, anchor on the comps not their cost.
Risks & watch-outs
- Climate carrying-cost: severe wind risk, 99% chance of damaging wind over 30y; extreme-heat days projected 7→21/yr by 2055 (HVAC capex compounding) — expect insurance premiums to compound above CPI over the hold.
Questions for the listing agent
- It's been on market 38 days. Have you received any prior offers? Is the seller open to a 3% concession, seller financing, or rate buy-down credit?
- Is there a deadline driving the sale (1031 exchange, divorce, estate, relocation)? That informs how much negotiation room exists.
- Schools are F-rated, which usually means shorter tenancies and higher turnover. Who's the typical renter profile here, and what's been the actual vacancy rate?
- What's the average days-on-market for RENTAL listings here right now (not sales)? A rising rental-DOM trend means longer vacancies and softer asking-rent achievability than the comps imply.
- What's the recent tenant-quality profile in this submarket — average credit score on applications, eviction rate, late-payment / NSF rate, and stable-employment percentage? A property-management company in the area should have these aggregated.
- How much new for-sale + rental construction is in the pipeline within 1–3 miles? Heavy new supply typically softens prices + rents 12–24 months out; constrained supply supports both.
Investment metrics
- 1% rule
- 2.97% ✓
- Cap rate
- 27.44%
- Cash-on-cash
- 75.51%
- DSCR
- 4.36
- GRM
- 2.8
CMA / ARV
- ARV (on-the-fly)
- $282,048
- Comps found
- 5
Show comp detail 5 sales within ~0.75 mi
| Address | Dist | Beds/Ba | Sqft | Sold | Price | $/sf | Match |
|---|---|---|---|---|---|---|---|
| 315 Blue Goose Ln | 0.20mi | 3/2.0 | 1,325 (+6%) | 2mo | $300,000 | $226 | 79 |
| 405 Snow Goose Ln | 0.28mi | 2/2.0 (-1) | 1,189 (-5%) | 1mo | $350,000 | $294 | 74 |
| 222 Blue Goose Ln | 0.10mi | 3/2.0 | 1,423 (+14%) | 6mo | $404,000 | $284 | 67 |
| 192 Bogue Forest Dr | 0.53mi | 3/2.0 | 1,308 (+5%) | 16mo | $292,500 | $224 | 54 |
| 219 Goose Creek Blvd | 0.05mi | 2/2.0 (-1) | 1,064 (-15%) | 20mo | $150,000 | $141 | 52 |
Match score weights: distance 35% · size 25% · config 20% · recency 20%. Top-matched comps best support the ARV.
Projected returns pro-forma
-3.0% appreciation · 3.0% rent growth · sell at horizon
- IRR
- 75.4%
- Equity multiple
- 4.43×
- Total profit
- $407,969
- Equity at exit
- $63,369
- IRR
- 79.1%
- Equity multiple
- 9.14×
- Total profit
- $969,029
- Equity at exit
- $36,746
Cash invested: $119,000 (down + closing). Projections, not guarantees.
Landlord ↔ Tenant lean methodology
- Overall (STATE)
- 85 Strongly Landlord-Friendly
- State North Carolina
- 85 Strongly Landlord-Friendly · R+3
- County
- — inherits STATE
- City
- — inherits STATE
ZIP-level market 28570
- Home prices YoY
- -16.2%
- Active inventory
- 216
- Price-to-rent
- 2.8×
Monthly cashflow live
- Estimated rent
- $12,635 medium interval (Pro) →
- Mortgage (P&I)
- −$2,229
- Tax from tax record
- −$88 /mo · $1,052/yr
- Insurance
- −$177
- HOA
- −$0
- Vacancy / Maint / Mgmt
- −$2,653
- Net cashflow
- $7,488
Break-even live
Sensitivity live
| Price | -10% $7,729 | -5% $7,608 | +0% $7,488 | +5% $7,368 | +10% $7,247 |
|---|---|---|---|---|---|
| Rent | -10% $6,490 | -5% $6,989 | +0% $7,488 | +5% $7,987 | +10% $8,486 |
| Rate | -1.0pp $7,702 | -0.5pp $7,596 | base $7,488 | +0.5pp $7,378 | +1.0pp $7,266 |
UW: 25.0% down · 7.5% · 30yr · 1.5% tax · 5.0% vac · 8.0% maint · 8.0% mgmt
Financing live
Cash to close
- Down payment
- $106,250
- Closing costs
- $12,750
- Reserves months
- —
- Total cash needed
- —
Loan-product check · same deal, 3 products live
Conventional
25% down · 7.5% · 30yr
- Down + closing
- —
- Monthly P&I
- —
- Monthly cashflow
- —
- DSCR
- —
- Eligible?
- —
Personal DTI + credit; lowest rate.
DSCR
20% down · 8.5% · 30yr
- Down + closing
- —
- Monthly P&I
- —
- Monthly cashflow
- —
- DSCR
- —
- Eligible?
- —
No personal income docs; deal must DSCR.
Hard money
10% down · 12.0% · 12mo
- Down + closing
- —
- Monthly P&I
- —
- Monthly cashflow
- —
- DSCR
- —
- Eligible?
- —
Short-term bridge; refi at stabilization.
Listing history 23 events
-
2026-06-19days on market $425,000 Active 38 DOM
-
2026-06-18days on market $425,000 Active 37 DOM
-
2026-06-17days on market $425,000 Active 36 DOM
-
2026-06-16days on market $425,000 Active 35 DOM
-
2026-06-15days on market $425,000 Active 34 DOM
-
2026-06-14days on market $425,000 Active 32 DOM
-
2026-06-12days on market $425,000 Active 31 DOM
-
2026-06-09days on market $425,000 Active 28 DOM
-
2026-06-08days on market $425,000 Active 27 DOM
-
2026-06-07days on market $425,000 Active 26 DOM
-
2026-06-05days on market $425,000 Active 23 DOM
-
2026-06-03days on market $425,000 Active 22 DOM
-
2026-06-02days on market $425,000 Active 21 DOM
-
2026-06-01days on market $425,000 Active 20 DOM
-
2026-05-31days on market $425,000 Active 19 DOM
-
2026-05-30days on market $425,000 Active 18 DOM
-
2026-05-12$425,000 Active
-
2023-04-26soldstatus $340,000
-
2012-06-15soldstatus $135,000 402-char remark
Show marketing remark (402 chars)
EXCEPTIONAL ENERGY EFFICIENT 16 WIDE MH WITH MANY EXTRAS INCLUDES SCREEN PORCH & STORAGE BUILDING 2X6 EXTERIOR WALLSLOCATED IN WATERFRONT MOBILE HOME COMMUNITY WITH 2 CONCRETE BOAT RAMPS, 250 FT. DAYDOCK/PIER, LARGE SWIMMING POOL,COVERED PICNIC AREA,LARGE WATERFRONT AREA. Appliances: SURFACE STOVE Construction: 2X6 EXTERIOR WALLS Foundation: TO COUNTY CODE Sewer: SEPTIC TANK Water: WEST CARTERET
-
2012-06-15soldstatus $135,000
Show marketing remark (402 chars)
EXCEPTIONAL ENERGY EFFICIENT 16 WIDE MH WITH MANY EXTRAS INCLUDES SCREEN PORCH & STORAGE BUILDING 2X6 EXTERIOR WALLSLOCATED IN WATERFRONT MOBILE HOME COMMUNITY WITH 2 CONCRETE BOAT RAMPS, 250 FT. DAYDOCK/PIER, LARGE SWIMMING POOL,COVERED PICNIC AREA,LARGE WATERFRONT AREA. Appliances: SURFACE STOVE Construction: 2X6 EXTERIOR WALLS Foundation: TO COUNTY CODE Sewer: SEPTIC TANK Water: WEST CARTERET
-
2012-06-02$189,900 402-char remark
Show marketing remark (402 chars)
EXCEPTIONAL ENERGY EFFICIENT 16 WIDE MH WITH MANY EXTRAS INCLUDES SCREEN PORCH & STORAGE BUILDING 2X6 EXTERIOR WALLSLOCATED IN WATERFRONT MOBILE HOME COMMUNITY WITH 2 CONCRETE BOAT RAMPS, 250 FT. DAYDOCK/PIER, LARGE SWIMMING POOL,COVERED PICNIC AREA,LARGE WATERFRONT AREA. Appliances: SURFACE STOVE Construction: 2X6 EXTERIOR WALLS Foundation: TO COUNTY CODE Sewer: SEPTIC TANK Water: WEST CARTERET
-
2011-12-04historical
-
2011-06-04$184,900
ⓘ Source: listings_history table (triggers on properties + properties_extension) + one-shot
backfill from property_details.listing_events for pre-trigger history.
Tax reassessment forecast NC · Resets to sale price
- Current annual tax
- $1,052 · $88/mo
- Projected year-2 tax
- $3,485 · $290/mo
- Expected delta
- +$2,433/yr (+$203/mo · 231.3%)
ⓘ Screening estimate from a state-policy table — verify with the county assessor before closing.
Climate risk First Street
- Flood 3/10 Moderate FEMA zone X (unshaded) · 20% chance over 30 yrs
- Wildfire 4/10 Moderate
- Heat 9/10 Extreme 7 d/yr ≥103°F today · 21 d/yr by 30 yrs out
- Wind 8/10 Severe 99% chance of damaging wind over 30 yrs
- Air quality 2/10 Low 2 unhealthy d/yr today · 2 by 30 yrs out
Nearby sold comps map
Loading sold comps map…
Walkable amenities ~0.75 mi
Loading nearby amenities…
Taxation est. · year 1
- Rental income
- $151,619
- − Mortgage interest
- −$23,807
- − Property taxes
- −$1,052
- − Insurance
- −$2,125
- − Repairs & maintenance
- −$12,129
- − Management
- −$12,129
- − Depreciation
- −$12,364
- Taxable income
- $88,013
- Est. tax owed @ 24.0%
- −$21,123
- After-tax cash flow
- $68,734/yr
For passive investors: Depreciation is non-cash, so a rental often shows a tax loss while cash-flowing — sheltering income. Rental losses are passive: they offset passive income freely, and up to $25,000/yr can offset ordinary (W-2) income if you actively participate and your MAGI is under $100k (phasing out to $0 by $150k); unused losses carry forward. On sale, claimed depreciation is recaptured at up to 25%, and gains may owe capital-gains tax (a 1031 exchange can defer both). Figures are a year-1 estimate at your 24.0% rate — not tax advice; consult a CPA.
Schools (NCES district)
- District
- Carteret County Public Schools
- NCES district ID
- 3700630
- Math proficiency
- 59% ▲ 5.00%
- Reading proficiency
- 61% ▲ 2.00%
- Median HH income
- $48,330
- Composite
- 50.92/100
- National rank
- #1786
- State rank
- #31 of 178 in NC
Livability — Bogue
- Score
- 65/100
- State rank
- #311
- US rank
- #13024
Category grades
Schools grade is shown separately in the Schools card above.
Census & demographics
- County
- Carteret County · 52,389 people
- Metro
- Morehead City, NC
- Population (ZIP)
- 22,197
- Household income
- $70,229
- Rent vs Own
- Severe rent burden
- 461.0
Population outlook (Carteret County) Hauer SSP2
- Today (2025)
- 73,443 people
- By 2030
- 75,344 · +2.6%
- By 2040
- 78,142 · +6.4%
- By 2050
- 80,091 · +9.1%
- By 2075
- 86,120 · +17.3%
- By 2100
- 89,408 · +21.7%
Race, ethnicity, and origin ACS 2023
- Neighborhood character
- Predominantly White (82%)
- Race & ethnicity
- White 82% Hispanic / Latino 7% Two or more races 6% Black 3% Asian 1%
- Hispanic origin (detail)
- Mexican 4%
- Common ancestry
- Slovak 3% Romanian 3% Lithuanian 2%
- Foreign-born
- 5% · Canada, Dominican Republic
- Languages at home
- 92% English-only · Spanish 6% German/W. Germanic 1%
Political lean MEDSL · Carteret
- 2024 margin
- Solid R (+43.1) · D 28.0% · R 71.1%
- 2008→2024 swing
- -8.4pp toward R · 2008: -34.7pp · 2024: -43.1pp
- All cycles
- 2024: R+43.1 2020: R+42.0 2016: R+44.5 2012: R+41.0 2008: R+34.7
Not yet ingested
- Civics
- —
Market trends
- HPI YoY
- ▼ -53.54%
- Current HPI
- 276.6589
- Rent YoY
- —
- Metro
- Morehead City, NC
- State GDP YoY
- ▲ 3.28%
- F500 in state
- 26
Industry mix (Fortune 500 HQ in NC)
| Industry | F500 HQs | Revenue |
|---|---|---|
| Financial Services | 2 | $213B |
|
||
| Retail | 2 | $95B |
|
||
| Industrial Conglomerate | 1 | $38B |
|
||
| Metals / Steel | 1 | $35B |
|
||
| Utilities | 1 | $30B |
|
||
| Industrial Machinery | 1 | $19B |
|
||
Price history
+129.9% since first listed7 events — show timeline
- 2026-05-12 Listed $425,000 FSBO.com
- 2023-04-26 Sold (Public Records) $340,000 Public Records
- 2012-06-15 Sold (Public Records) $135,000 Public Records
- 2012-06-15 Sold (MLS) $135,000 Hive MLS
- 2012-06-02 Listed $189,900 Hive MLS
- 2011-12-04 Listing Removed — Hive MLS
- 2011-06-04 Listed $184,900 Hive MLS
Property tax history
+20.0%/yrLatest (2025): $1,052 · +528.6% YoY. Source: county tax records.
Cash-flow waterfall
monthlySold comps — $/sqft
last 12 mo · ≤1 miLoading sold comps…