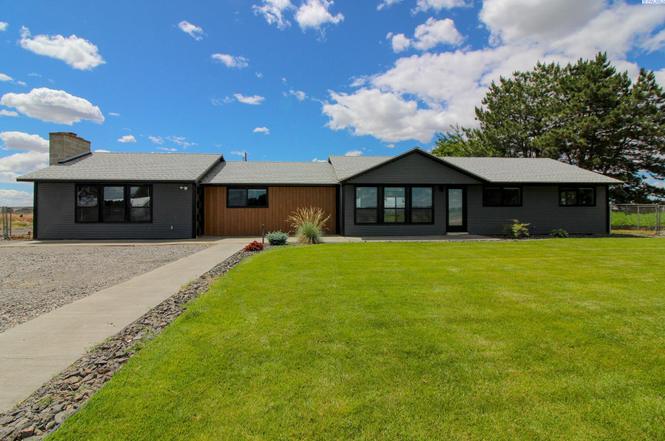
4151 Columbia River Rd · Pasco, WA
Flood risk No data
- FEMA flood zone
- —
- Chance of flooding over 30 yrs
- —
- Est. flood insurance / yr
- —
Fire risk No data
- Est. fire insurance / yr
- —
Heat risk No data
- Hot days now (above threshold)
- —
- Hot days in 30 yrs
- —
Wind risk No data
- Chance of severe wind over 30 yrs
- —
Air-quality risk No data
- Unhealthy air days now
- —
- Unhealthy air days in 30 yrs
- —
Risk factors via First Street. Map © Google.
Why this score? — see what drove the D+ grade
The composite is a weighted blend of 9 inputs, each scored 0–100. Each bar is that input's sub-score; the figure is the points it added to the 100-point composite (weight × sub-score).
- Cash flow +15.0/30.0
- ARV discount +7.5/15.0
- 1% rule +5.0/10.0
- DSCR +5.0/10.0
- Livability +4.0/5.0
- Schools +3.4/10.0
- Rent growth +3.0/5.0
- Condition / age +2.5/5.0
- Appreciation +0.0/10.0
$2,795
🖨 Deal sheet 📄 Offer letter ✓ Due diligence
Listing remarks
We do not accept 3rd party applications or viewing requests. 4 Bedroom, 3.5 Bath 1,943 sqft Home in Pasco Exceptional 4-bedroom, 3.5 bath home in Pasco available now. The stunning main kitchen boasts wood cabinets, stainless appliances and open shelving. With beautiful flooring throughout this home all feels spacious and welcoming. The primary suite has a private ensuite bathroom with dual vessel sinks. 2 additional bedrooms offer additional space and options. On the other end of the house is a complete ADU with a kitchen, living room, bedroom, & bathroom/laundry room. A large bonus room connects the two spaces seamlessly. Every detail has been well curated throughout. You are going t
Key facts
- Main kitchen
- Dual vessel sinks
- Stainless appliances
Tags
Property features AI
Exterior
- Parking: Two total parking spaces; Two covered parking spaces; Two-car garage
- Home design: Single-family residence; Site-built on owned lot; One level / single-story; New construction
- Construction: Built as site-built construction
- Exterior features: Lot is approximately 1.35 acres; Zoned for single-family residential
Interior
- Bathrooms: Three full bathrooms; One half bathroom
- Interior features: No basement
Neighborhood map
What this means for you Summary
Snapshot
- This is a 3-bed/2.0-bath single-family listed at $3k.
Deal economics
- At list price, monthly cash flow is $2k ($20k/yr) — positive.
- The deal already cash-flows at list — no discount required.
- Meets the 1% rule at list price ($2k rent vs $3k).
- Cap rate 718.6% vs local median 3.0% in Pasco — top-decile yield for the area; either an underpriced asset or a hidden risk that comps aren't pricing in. Stress-test before assuming the spread holds.
Location & tenants
- Location reads 79/100 on livability (#104 in WA, #1,999 nationally) — a middle-class / working-renter tenant base. Strengths: commute A+, housing A+, health & safety A+; Watch: crime D+, schools D-.
- Pasco School District (suburban): math 31% / reading 40% proficiency, ranked #242 of 291 in WA (top 83%) — families likely to look elsewhere, expect single-tenant / working-renter base with shorter leases; 61% free/reduced lunch — lower-income household profile, screen leases tightly.
- Market conditions: Rents rising (+2.0%/yr); 705 active listings in the ZIP; solid renter incomes; 981 units permitted in Franklin County in 2024 (517 in 5+ unit buildings).
Forward outlook
- Local home prices are declining (-3.0%/yr); year-one equity from $19 of loan paydown is wiped out by about $84 of value loss. Plan a longer hold.
- Franklin County population projected at +50% by 2050 — long-run rental-demand tailwind backs the buy-and-hold thesis.
- At projected returns (-3.0% appreciation + 2.0% rent growth), your $783 cash investment doubles in ~1 year — after that, you're playing with house money.
Negotiation context
- Only 3 days on market — expect competitive offers; lowballing is unlikely to land.
- 2 sale attempts with the ask held roughly flat each time — persistent listings suggest the price (not the market) is what's stuck; bring a comps-based counter.
Risks & watch-outs
- Watch-outs: built in 1954 — expect roof / HVAC / electrical / plumbing capex.
Questions for the listing agent
- Built in 1954 — when were the roof, HVAC, electrical panel, plumbing, and water heater last replaced?
- Is there a deadline driving the sale (1031 exchange, divorce, estate, relocation)? That informs how much negotiation room exists.
- Schools are D-rated, which usually means shorter tenancies and higher turnover. Who's the typical renter profile here, and what's been the actual vacancy rate?
- Crime grade is D in this area — have there been break-ins, vandalism, or insurance claims at this property in the last 3 years? What carrier currently insures it and at what premium?
- The area grade is low — what's the realistic commute time and amenity access for the typical tenant pool here? Any planned neighborhood developments (good or bad) we should know about?
- What's the average days-on-market for RENTAL listings here right now (not sales)? A rising rental-DOM trend means longer vacancies and softer asking-rent achievability than the comps imply.
- What's the recent tenant-quality profile in this submarket — average credit score on applications, eviction rate, late-payment / NSF rate, and stable-employment percentage? A property-management company in the area should have these aggregated.
- How much new for-sale + rental construction is in the pipeline within 1–3 miles? Heavy new supply typically softens prices + rents 12–24 months out; constrained supply supports both.
Investment metrics
- 1% rule
- 76.01% ✓
- Cap rate
- 718.62%
- Cash-on-cash
- 2544.02%
- DSCR
- 114.19
- GRM
- 0.1
CMA / ARV
No comps found within radius.
Projected returns pro-forma
-3.0% appreciation · 1.99% rent growth · sell at horizon
- IRR
- —
- Equity multiple
- 132.76×
- Total profit
- $103,112
- Equity at exit
- $417
- IRR
- —
- Equity multiple
- 278.78×
- Total profit
- $217,391
- Equity at exit
- $242
Cash invested: $783 (down + closing). Projections, not guarantees.
Landlord ↔ Tenant lean methodology
- Overall (STATE)
- 28 Tenant-Leaning
- State Washington
- 28 Tenant-Leaning · D+8
- County
- — inherits STATE
- City
- — inherits STATE
ZIP-level market 99301
- Rents YoY
- 2.0%
- Active inventory
- 705
- Price-to-rent
- 0.1×
Monthly cashflow live
- Estimated rent
- $2,125 medium interval (Pro) →
- Mortgage (P&I)
- −$15
- Tax est. 1.5%
- −$3 /mo · $42/yr
- Insurance
- −$1
- HOA
- −$0
- Vacancy / Maint / Mgmt
- −$446
- Net cashflow
- $1,659
Break-even live
UW: 25.0% down · 7.5% · 30yr · 1.5% tax · 5.0% vac · 8.0% maint · 8.0% mgmt
Financing live
Cash to close
- Down payment
- $699
- Closing costs
- $84
- Reserves months
- —
- Total cash needed
- —
Loan-product check · same deal, 3 products live
Conventional
25% down · 7.5% · 30yr
- Down + closing
- —
- Monthly P&I
- —
- Monthly cashflow
- —
- DSCR
- —
- Eligible?
- —
Personal DTI + credit; lowest rate.
DSCR
20% down · 8.5% · 30yr
- Down + closing
- —
- Monthly P&I
- —
- Monthly cashflow
- —
- DSCR
- —
- Eligible?
- —
No personal income docs; deal must DSCR.
Hard money
10% down · 12.0% · 12mo
- Down + closing
- —
- Monthly P&I
- —
- Monthly cashflow
- —
- DSCR
- —
- Eligible?
- —
Short-term bridge; refi at stabilization.
Listing history 4 events
-
2026-06-18days on market $2,795 Active 3 DOM
-
2026-06-17days on market $2,795 Active 2 DOM
-
2026-06-15remarks 695-char remark
-
2026-06-15$2,795 Active 1 DOM
ⓘ Source: listings_history table (triggers on properties + properties_extension) + one-shot
backfill from property_details.listing_events for pre-trigger history.
Nearby sold comps map
Loading sold comps map…
Walkable amenities ~0.75 mi
Loading nearby amenities…
Taxation est. · year 1
- Rental income
- $25,495
- − Mortgage interest
- −$157
- − Property taxes
- −$42
- − Insurance
- −$14
- − Repairs & maintenance
- −$2,040
- − Management
- −$2,040
- − Depreciation
- −$81
- Taxable income
- $21,122
- Est. tax owed @ 24.0%
- −$5,069
- After-tax cash flow
- $14,840/yr
For passive investors: Depreciation is non-cash, so a rental often shows a tax loss while cash-flowing — sheltering income. Rental losses are passive: they offset passive income freely, and up to $25,000/yr can offset ordinary (W-2) income if you actively participate and your MAGI is under $100k (phasing out to $0 by $150k); unused losses carry forward. On sale, claimed depreciation is recaptured at up to 25%, and gains may owe capital-gains tax (a 1031 exchange can defer both). Figures are a year-1 estimate at your 24.0% rate — not tax advice; consult a CPA.
Schools (NCES district)
- District
- Pasco School District
- NCES district ID
- 5306570
- Math proficiency
- 31% ▬ 0.00%
- Reading proficiency
- 40% ▬ 0.00%
- Median HH income
- $54,454
- Composite
- 33.78/100
- National rank
- #10401
- State rank
- #242 of 291 in WA
Livability — Pasco
- Score
- 79/100
- State rank
- #104
- US rank
- #1999
Category grades
Schools grade is shown separately in the Schools card above.
Census & demographics
- County
- Franklin County · 87,044 people
- City population
- 87,044
- Metro
- Kennewick-Richland, WA
- Population (ZIP)
- 87,044
- Household income
- $87,951
- Rent vs Own
- Severe rent burden
- 1556.0
Population outlook (Franklin County) Hauer SSP2
- Today (2025)
- 108,530 people
- By 2030
- 118,705 · +9.4%
- By 2040
- 140,053 · +29.0%
- By 2050
- 162,360 · +49.6%
- By 2075
- 217,667 · +100.6%
- By 2100
- 264,533 · +143.7%
Race, ethnicity, and origin ACS 2023
- Neighborhood character
- Diverse neighborhood (Simpson 0.56)
- Race & ethnicity
- Hispanic / Latino 55% White 37% Two or more races 22% Black 2% Asian 2% Native American 2%
- Hispanic origin (detail)
- Mexican 51%
- Common ancestry
- Lithuanian 2% Italian 2% Portuguese 2%
- Foreign-born
- 21% · Canada, Vietnam
- Languages at home
- 49% English-only · Spanish 47% Russian/Polish/Slavic 2% Other Asian/Pacific 0%
Political lean MEDSL · Franklin
- 2024 margin
- Strong R (+22.7) · D 37.4% · R 60.1% · Other 2.4%
- 2008→2024 swing
- +1.0pp toward D · 2008: -23.7pp · 2024: -22.7pp
- All cycles
- 2024: R+22.7 2020: R+14.5 2016: R+17.1 2012: R+25.2 2008: R+23.7
Not yet ingested
- Civics
- —
Market trends
- HPI YoY
- ▼ -331.74%
- Current HPI
- 284.481
- Rent YoY
- ▲ 1.99%
- Metro
- Kennewick-Richland, WA
- State GDP YoY
- ▲ 4.65%
- F500 in state
- 22
Industry mix (Fortune 500 HQ in WA)
| Industry | F500 HQs | Revenue |
|---|---|---|
| Retail | 2 | $269B |
|
||
| Technology / Retail | 1 | $638B |
|
||
| Technology | 1 | $245B |
|
||
| Telecommunications | 1 | $38B |
|
||
| Food / Beverage | 1 | $36B |
|
||
| Automotive / Trucks | 1 | $34B |
|
||
Price history
+11.8% since first listed3 events — show timeline
- 2026-06-15 Listed $2,795 PACMLS
- 2026-06-14 Price Changed $2,795 APPFOLIO
- 2026-06-13 Listed for Rent $2,500 APPFOLIO
Property tax history
-2.4%/yrLatest (2021): $2,825 · +14.3% YoY. Source: county tax records.
Cash-flow waterfall
monthlySold comps — $/sqft
last 12 mo · ≤1 miLoading sold comps…