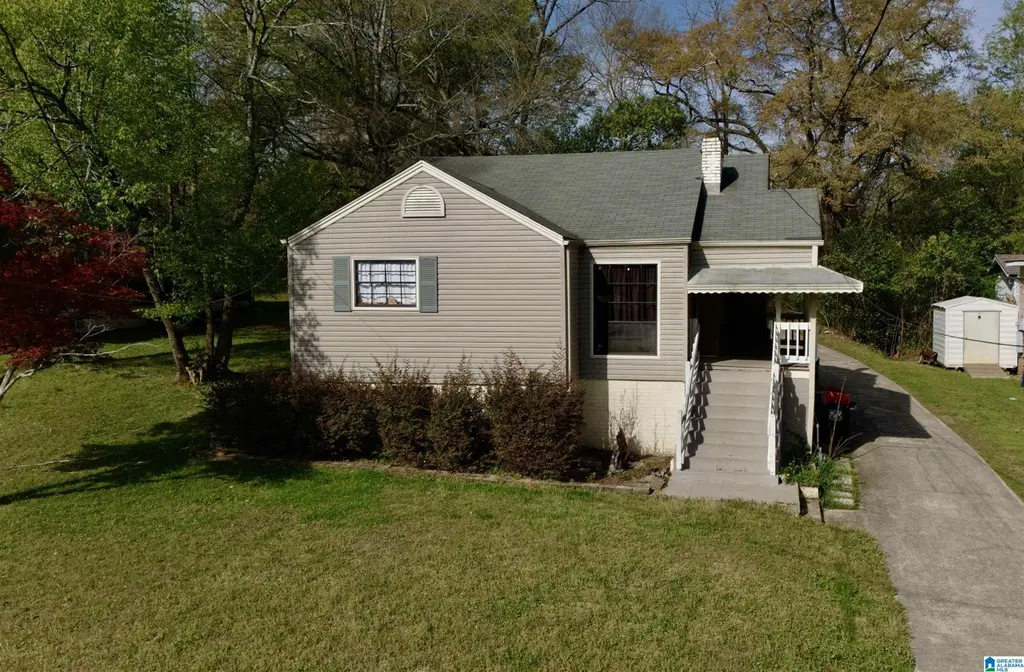
152 22nd St · Hueytown, AL
Flood risk 1/10 · Minimal
- FEMA flood zone
- X (unshaded)
- Chance of flooding over 30 yrs
- 0.0%
- Est. flood insurance / yr
- $473 – $860
Fire risk 3/10 · Minor
- Est. fire insurance / yr
- $916 – $1,700
Heat risk 6/10 · Moderate
- Hot days now (above 109°F)
- 7 days/yr
- Hot days in 30 yrs
- 20 days/yr
Wind risk 6/10 · Moderate
- Chance of severe wind over 30 yrs
- 27.0%
Air-quality risk 3/10 · Minor
- Unhealthy air days now
- 2 days/yr
- Unhealthy air days in 30 yrs
- 5 days/yr
Risk factors via First Street. Map © Google.
Why this score? — see what drove the B- grade
The composite is a weighted blend of 9 inputs, each scored 0–100. Each bar is that input's sub-score; the figure is the points it added to the 100-point composite (weight × sub-score).
- Cash flow +22.8/30.0
- ARV discount +15.0/15.0
- DSCR +7.3/10.0
- 1% rule +6.0/10.0
- Appreciation +4.7/10.0
- Rent growth +2.9/5.0
- Livability +2.9/5.0
- Condition / age +2.5/5.0
- Schools +1.8/10.0
$99,900
🖨 Deal sheet 📄 Offer letter ✓ Due diligence
Listing remarks MLS
Great investment opportunity! This 2-bedroom, 1-bath home at 152 2nd Street in Hueytown offers consistent monthly rental income. Ideal for investors looking to expand their portfolio with a cash-flowing property.
Key facts
- 8,712 sq ft lot
- Built 1949
- Listed 79 days
Neighborhood map
What this means for you Summary
Snapshot
- This is a 2-bed/1.0-bath single-family listed at $100k.
Deal economics
- At list price, monthly cash flow is $173 ($2k/yr) — positive.
- The deal already cash-flows at list — no discount required.
- Meets the 1% rule at list price ($1k rent vs $100k).
- Recommended offer: $94k (6.0% below list) — sets the bar for market timing.
- Cap rate 8.4% vs local median 5.9% in Hueytown — top-decile yield for the area; either an underpriced asset or a hidden risk that comps aren't pricing in. Stress-test before assuming the spread holds.
Location & tenants
- Location reads 57/100 on livability (#378 in AL) — a working-class tenant base; expect higher turnover. Strengths: cost of living A+, housing A+; Watch: employment D, schools F, crime F.
- Jefferson County (suburban): math 9% / reading 32% proficiency, ranked #104 of 129 in AL (top 81%) — low school quality limits family demand, transient renter base, plan for 1-2y turnover.
- Market conditions: Rents rising (+1.6%/yr); 250 active listings in the ZIP; 18 comparable units currently listed for rent nearby; rentals at typical pace (median 24d on market — plan ~3-4 weeks tenant-placement turnaround); 44% of comp listings sitting > 30 days — soft ceiling on asking rent; 2,114 units permitted in Jefferson County in 2024 (556 in 5+ unit buildings).
Forward outlook
- In year one you build about $92 of equity ($691 loan paydown + $-599 appreciation (-0.6% local appreciation)).
- Jefferson County population projected to shrink 4% by 2050 — rents likely to lag national; underwrite the cash flow, not the appreciation.
- At projected returns (-0.6% appreciation + 1.6% rent growth), your $28k cash investment doubles in ~10 years — after that, you're playing with house money.
Negotiation context
- It's been on market 79 days — a 6% lower offer ($94k) is reasonable based on typical stale-listing flexibility.
- Current owner paid $79k; 27% above their basis — modest negotiation headroom, anchor on the comps not their cost.
Risks & watch-outs
- Watch-outs: built in 1949 — expect roof / HVAC / electrical / plumbing capex.
- Climate carrying-cost: major wind risk, 27% chance of damaging wind over 30y; extreme-heat days projected 7→20/yr by 2055 (HVAC capex compounding) — expect insurance premiums to compound above CPI over the hold.
Questions for the listing agent
- It's been on market 79 days. Have you received any prior offers? Is the seller open to a 6% concession, seller financing, or rate buy-down credit?
- Built in 1949 — when were the roof, HVAC, electrical panel, plumbing, and water heater last replaced?
- Why hasn't it sold? Are there any deal-killer items the seller is aware of (foundation, flood, title, zoning, code violations)?
- Is there a deadline driving the sale (1031 exchange, divorce, estate, relocation)? That informs how much negotiation room exists.
- Schools are F-rated, which usually means shorter tenancies and higher turnover. Who's the typical renter profile here, and what's been the actual vacancy rate?
- Crime grade is F in this area — have there been break-ins, vandalism, or insurance claims at this property in the last 3 years? What carrier currently insures it and at what premium?
- What's the average days-on-market for RENTAL listings here right now (not sales)? A rising rental-DOM trend means longer vacancies and softer asking-rent achievability than the comps imply.
- What's the recent tenant-quality profile in this submarket — average credit score on applications, eviction rate, late-payment / NSF rate, and stable-employment percentage? A property-management company in the area should have these aggregated.
- How much new for-sale + rental construction is in the pipeline within 1–3 miles? Heavy new supply typically softens prices + rents 12–24 months out; constrained supply supports both.
Investment metrics
- 1% rule
- 1.10% ✓
- Cap rate
- 8.38%
- Cash-on-cash
- 7.44%
- DSCR
- 1.33
- GRM
- 7.6
CMA / ARV
- ARV (median comp)
- $144,343
- List price
- $99,900
- Delta
- -30.79%
- Verdict
- UNDERPRICED
- Comps
- 20 within 1.0 mi
Show comp detail 12 sales within ~0.75 mi
| Address | Dist | Beds/Ba | Sqft | Sold | Price | $/sf | Match |
|---|---|---|---|---|---|---|---|
| 117 Walker Ave | 0.43mi | 2/1.0 | 947 (+0%) | 12mo | $155,000 | $164 | 70 |
| 1261 Hueytown Rd | 0.22mi | 2/1.0 | 810 (-14%) | 2mo | $120,000 | $148 | 65 |
| 158 21st St S | 0.08mi | 2/2.0 | 1,064 (+13%) | 15mo | $165,000 | $155 | 58 |
| 103 Virginia Dr | 0.25mi | 2/1.0 | 1,050 (+11%) | 18mo | $159,000 | $151 | 54 |
| 122 June Ave | 0.58mi | 2/1.0 | 866 (-8%) | 8mo | $63,000 | $73 | 53 |
| 116 Ivy Ave | 0.64mi | 2/1.0 | 851 (-10%) | 4mo | $80,000 | $94 | 50 |
| 207 June Ave | 0.53mi | 2/1.0 | 851 (-10%) | 12mo | $130,000 | $153 | 49 |
| 121 Meadowood Ave | 0.61mi | 3/1.0 (+1) | 1,053 (+12%) | 2mo | $155,670 | $148 | 46 |
| 3219 Circle Dr | 0.72mi | 2/1.0 | 1,064 (+13%) | 4mo | $135,000 | $127 | 41 |
| 116 June Ave | 0.61mi | 3/1.0 (+1) | 1,054 (+12%) | 10mo | $159,500 | $151 | 39 |
| 205 Webster Ln | 0.72mi | 3/1.0 (+1) | 1,051 (+12%) | 9mo | $135,000 | $128 | 35 |
| 117 Gwin Ave | 0.69mi | 2/1.5 | 1,084 (+15%) | 11mo | $144,100 | $133 | 32 |
Match score weights: distance 35% · size 25% · config 20% · recency 20%. Top-matched comps best support the ARV.
Projected returns pro-forma
-0.6% appreciation · 1.6% rent growth · sell at horizon
- IRR
- 3.0%
- Equity multiple
- 1.14×
- Total profit
- $3,835
- Equity at exit
- $26,047
- IRR
- 8.0%
- Equity multiple
- 1.77×
- Total profit
- $21,598
- Equity at exit
- $29,034
Cash invested: $27,972 (down + closing). Projections, not guarantees.
Landlord ↔ Tenant lean methodology
- Overall (STATE)
- 90 Strongly Landlord-Friendly
- State Alabama
- 90 Strongly Landlord-Friendly · R+15
- County
- — inherits STATE
- City
- — inherits STATE
ZIP-level market 35023
- Home prices YoY
- -0.1%
- Rents YoY
- 1.6%
- Active inventory
- 250
- Price-to-rent
- 7.6×
Monthly cashflow live
- Estimated rent
- $1,100 high interval (Pro) →
- Mortgage (P&I)
- −$524
- Tax from tax record
- −$130 /mo · $1,557/yr
- Insurance
- −$42
- HOA
- −$0
- Vacancy / Maint / Mgmt
- −$231
- Net cashflow
- $173
Break-even live
UW: 25.0% down · 7.5% · 30yr · 1.5% tax · 5.0% vac · 8.0% maint · 8.0% mgmt
Financing live
Cash to close
- Down payment
- $24,975
- Closing costs
- $2,997
- Reserves months
- —
- Total cash needed
- —
Loan-product check · same deal, 3 products live
Conventional
25% down · 7.5% · 30yr
- Down + closing
- —
- Monthly P&I
- —
- Monthly cashflow
- —
- DSCR
- —
- Eligible?
- —
Personal DTI + credit; lowest rate.
DSCR
20% down · 8.5% · 30yr
- Down + closing
- —
- Monthly P&I
- —
- Monthly cashflow
- —
- DSCR
- —
- Eligible?
- —
No personal income docs; deal must DSCR.
Hard money
10% down · 12.0% · 12mo
- Down + closing
- —
- Monthly P&I
- —
- Monthly cashflow
- —
- DSCR
- —
- Eligible?
- —
Short-term bridge; refi at stabilization.
Rent comps 18 comps
| Address | Beds | Baths | Sqft | Rent | $/sqft | DOM | Units | Dist |
|---|---|---|---|---|---|---|---|---|
| 309 Sunrise Blvd Bessemer, AL | 2.0 | 1.0 | 1105 | $1,160 | $1.05 | 11d | 1 | 0.03mi |
| 110 Ray Ave Apt 7 Hueytown, AL | 2.0 | 2.0 | 900 | $875 | $0.97 | 2d | 1 | 0.56mi |
| 119 Lakeland Ave Bessemer, AL | 3.0 | 1.0 | 1042 | $1,125 | $1.08 | 23d | 1 | 0.58mi |
| 116 Vail Ave Bessemer, AL | 2.0 | 1.0 | 1008 | $975 | $0.97 | 19d | 1 | 0.68mi |
| 2822 Brooklane Dr Bessemer, AL | 2.0 | 1.0 | 975 | $1,000 | $1.03 | 43d | 1 | 0.83mi |
| 2020 High School Rd Unit C Bessemer, AL | 2.0 | 1.0 | 733 | $750 | $1.02 | 14d | 1 | 0.85mi |
| 1409 Hueytown Rd Unit 76 Bessemer, AL | 2.0 | 1.0 | 876 | $995 | $1.14 | 2d | 1 | 0.91mi |
| 1409 Hueytown Rd Apt 63 Bessemer, AL | 2.0 | 1.0 | 876 | $995 | $1.14 | 43d | 1 | 0.91mi |
| 1409 Hueytown Rd Unit 09 Bessemer, AL | 1.0 | 1.0 | 695 | $850 | $1.22 | 43d | 1 | 0.91mi |
| 622 S Parkell Ave Bessemer, AL | 3.0 | 1.0 | 963 | $1,200 | $1.25 | 43d | 1 | 1.00mi |
| 109 Oak Ave Bessemer, AL | 3.0 | 1.0 | 1120 | $1,200 | $1.07 | 2d | 1 | 1.09mi |
| 1444 Hueytown Rd Unit B Hueytown, AL | 2.0 | 1.0 | 725 | $945 | $1.30 | 23d | 1 | 1.13mi |
| 301 Autumn Brook Ter Unit 401 Hueytown, AL | 1.0 | 1.0 | 695 | $850 | $1.22 | 21d | 1 | 1.24mi |
| 2423 Circle Dr Bessemer, AL | 2.0 | 1.0 | 732 | $1,050 | $1.43 | 43d | 1 | 1.25mi |
| 107 Wheeler Dr Bessemer, AL | 2.0 | 1.0 | 950 | $950 | $1.00 | 43d | 1 | 1.30mi |
| 200 Love St Bessemer, AL | 2.0 | 1.0 | 675 | $1,100 | $1.63 | 43d | 1 | 1.31mi |
| 105 Louis Ave Bessemer, AL | 2.0 | 1.0 | 1073 | $1,100 | $1.03 | 43d | 1 | 1.37mi |
| 1623 26th Ave N Bessemer, AL | 2.0 | 1.0 | 1004 | $1,095 | $1.09 | 11d | 1 | 1.49mi |
Listing history 18 events
-
2026-06-18days on market $99,900 Active 79 DOM
-
2026-06-17days on market $99,900 Active 78 DOM
-
2026-06-16days on market $99,900 Active 77 DOM
-
2026-06-15days on market $99,900 Active 76 DOM
-
2026-06-13days on market $99,900 Active 74 DOM
-
2026-06-10days on market $99,900 Active 71 DOM
-
2026-06-09days on market $99,900 Active 70 DOM
-
2026-06-08days on market $99,900 Active 69 DOM
-
2026-06-07days on market $99,900 Active 68 DOM
-
2026-06-03days on market $99,900 Active 64 DOM
-
2026-06-02days on market $99,900 Active 63 DOM
-
2026-06-01days on market $99,900 Active 62 DOM
-
2026-05-31days on market $99,900 Active 61 DOM
-
2026-05-12price $99,900 212-char remark
Show marketing remark (212 chars)
Great investment opportunity! This 2-bedroom, 1-bath home at 152 2nd Street in Hueytown offers consistent monthly rental income. Ideal for investors looking to expand their portfolio with a cash-flowing property.
-
2026-03-31$110,000 Active 212-char remark
Show marketing remark (212 chars)
Great investment opportunity! This 2-bedroom, 1-bath home at 152 2nd Street in Hueytown offers consistent monthly rental income. Ideal for investors looking to expand their portfolio with a cash-flowing property.
-
2006-01-18soldstatus $78,556
-
1988-06-30soldstatus $38,500
-
1979-06-01soldstatus $30,000
ⓘ Source: listings_history table (triggers on properties + properties_extension) + one-shot
backfill from property_details.listing_events for pre-trigger history.
Tax reassessment forecast AL · Resets to sale price
- Current annual tax
- $1,557 · $130/mo
- Projected year-2 tax
- $1,557 · $130/mo
- Expected delta
- $0/yr ($0/mo · 0.0%)
ⓘ Screening estimate from a state-policy table — verify with the county assessor before closing.
Climate risk First Street
- Flood 1/10 Low FEMA zone X (unshaded) · 0% chance over 30 yrs
- Wildfire 3/10 Moderate
- Heat 6/10 Major 7 d/yr ≥109°F today · 20 d/yr by 30 yrs out
- Wind 6/10 Major 27% chance of damaging wind over 30 yrs
- Air quality 3/10 Moderate 2 unhealthy d/yr today · 5 by 30 yrs out
Nearby sold comps map
Loading sold comps map…
Walkable amenities ~0.75 mi
Loading nearby amenities…
Taxation est. · year 1
- Rental income
- $13,196
- − Mortgage interest
- −$5,596
- − Property taxes
- −$1,557
- − Insurance
- −$500
- − Repairs & maintenance
- −$1,056
- − Management
- −$1,056
- − Depreciation
- −$2,906
- Taxable income
- $526
- Est. tax owed @ 24.0%
- −$126
- After-tax cash flow
- $1,956/yr
For passive investors: Depreciation is non-cash, so a rental often shows a tax loss while cash-flowing — sheltering income. Rental losses are passive: they offset passive income freely, and up to $25,000/yr can offset ordinary (W-2) income if you actively participate and your MAGI is under $100k (phasing out to $0 by $150k); unused losses carry forward. On sale, claimed depreciation is recaptured at up to 25%, and gains may owe capital-gains tax (a 1031 exchange can defer both). Figures are a year-1 estimate at your 24.0% rate — not tax advice; consult a CPA.
Schools (NCES district)
- District
- Jefferson County
- NCES district ID
- 0101920
- Math proficiency
- 9% ▼ -24.00%
- Reading proficiency
- 32% ▼ -5.00%
- Median HH income
- $51,712
- Composite
- 18.4/100
- National rank
- #8937
- State rank
- #104 of 129 in AL
Livability — Hueytown
- Score
- 57/100
- State rank
- #378
- US rank
- #21611
Category grades
Schools grade is shown separately in the Schools card above.
Census & demographics
- Census place
- Hueytown, AL
- County
- Jefferson County · 527,445 people
- Metro
- Birmingham-Hoover, AL
- Population (ZIP)
- 25,533
- Household income
- $69,863
- Rent vs Own
- Severe rent burden
- 247.0
Population outlook (Jefferson County) Hauer SSP2
- Today (2025)
- 669,185 people
- By 2030
- 669,694 · +0.1%
- By 2040
- 661,388 · -1.2%
- By 2050
- 643,086 · -3.9%
- By 2075
- 577,267 · -13.7%
- By 2100
- 474,758 · -29.1%
Race, ethnicity, and origin ACS 2023
- Neighborhood character
- Diverse neighborhood (Simpson 0.56)
- Race & ethnicity
- White 58% Black 30% Hispanic / Latino 7% Two or more races 3%
- Hispanic origin (detail)
- Mexican 5%
- Common ancestry
- Slovak 1% Lithuanian 1% Serbian 1%
- Foreign-born
- 4% · Canada
- Languages at home
- 93% English-only · Spanish 7%
Political lean MEDSL · Jefferson
- 2024 margin
- D (+10.4) · D 54.6% · R 44.2% · Other 1.2%
- 2008→2024 swing
- +5.4pp toward D · 2008: 5.1pp · 2024: 10.4pp
- All cycles
- 2024: D+10.4 2020: D+13.2 2016: D+7.2 2012: D+6.0 2008: D+5.1
Not yet ingested
- Civics
- —
Market trends
- HPI YoY
- ▼ -0.60%
- Current HPI
- 389.38
- Rent YoY
- ▲ 1.60%
- Metro
- Birmingham-Hoover, AL
- State GDP YoY
- ▲ 2.94%
- F500 in state
- 4
Industry mix (Fortune 500 HQ in AL)
| Industry | F500 HQs | Revenue |
|---|---|---|
| Financial Services | 1 | $8B |
|
||
| Healthcare | 1 | $5B |
|
||
Price history
+233.0% since first listed5 events — show timeline
- 2026-05-12 Price Changed $99,900 Greater Alabama MLS
- 2026-03-31 Listed $110,000 Greater Alabama MLS
- 2006-01-18 Sold (Public Records) $78,556 Public Records
- 1988-06-30 Sold (Public Records) $38,500 Public Records
- 1979-06-01 Sold (Public Records) $30,000 Public Records
Property tax history
+4.7%/yrLatest (2025): $1,557 · +0.0% YoY. Source: county tax records.
Cash-flow waterfall
monthlySold comps — $/sqft
last 12 mo · ≤1 miLoading sold comps…