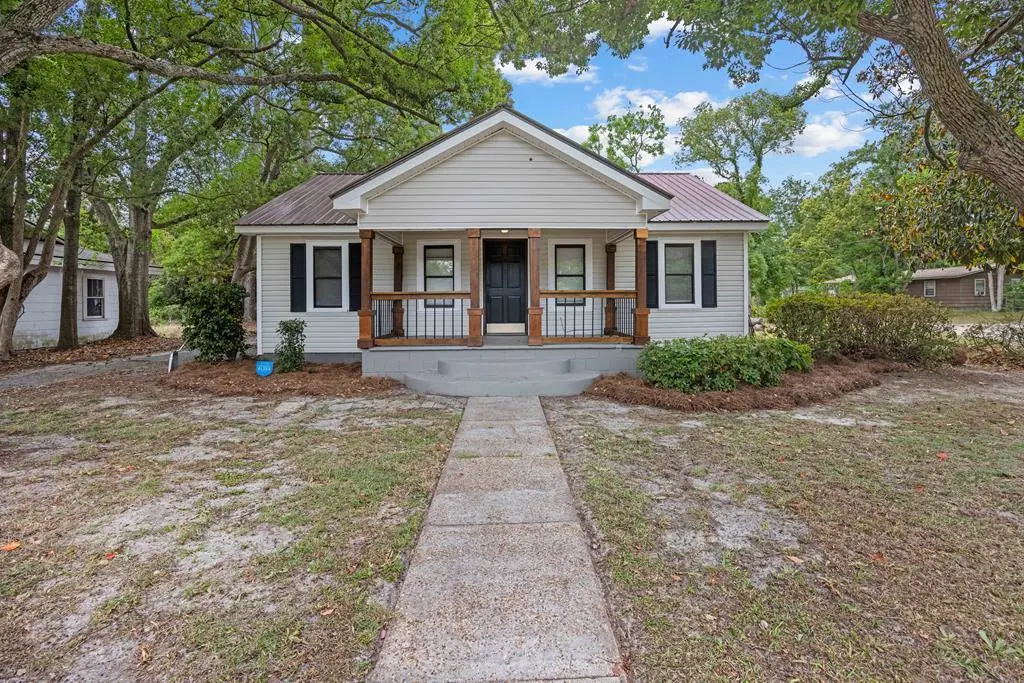
71 W Thigpen Ave · Lakeland, GA
Flood risk 1/10 · Minimal
- FEMA flood zone
- X (unshaded)
- Chance of flooding over 30 yrs
- 0.0%
- Est. flood insurance / yr
- $507 – $1,088
Fire risk 6/10 · Moderate
- Est. fire insurance / yr
- $963 – $1,789
Heat risk 8/10 · Major
- Hot days now (above 107°F)
- 7 days/yr
- Hot days in 30 yrs
- 20 days/yr
Wind risk 8/10 · Major
- Chance of severe wind over 30 yrs
- 99.0%
Air-quality risk 7/10 · Major
- Unhealthy air days now
- 16 days/yr
- Unhealthy air days in 30 yrs
- 17 days/yr
Risk factors via First Street. Map © Google.
Why this score? — see what drove the D grade
The composite is a weighted blend of 9 inputs, each scored 0–100. Each bar is that input's sub-score; the figure is the points it added to the 100-point composite (weight × sub-score).
- ARV discount +15.0/15.0
- Cash flow +7.7/30.0
- Appreciation +7.2/10.0
- Schools +3.0/10.0
- Livability +3.0/5.0
- Rent growth +2.5/5.0
- Condition / age +2.5/5.0
- DSCR +1.8/10.0
- 1% rule +1.5/10.0
$179,900
🖨 Deal sheet (PDF) 📄 Offer letter ✓ Due diligence
Listing remarks MLS
Good-sized home located on a large shaded lot with mature pecan trees. Recently painted; numerous upgrades throughout the home. It has a metal roof, vinyl siding, and a separate workshop adjacent to a huge carport. Land is actually four separate lots.
Key facts
- 0.43 acre lot
- Listed 45 days
Property features AI
Finance
- Other:
- Financial info:
- HOA & community:
Exterior
- Parking:
- Security:
- Utilities: Public water; Public sewer
- Home design: Single-family residence (house); One-story
- Construction: Vinyl siding; Metal roof
- Exterior features: Irregular-shaped lot; Zoned RA
Interior
- Kitchen: Includes dishwasher and refrigerator
- Bedrooms:
- Flooring:
- Bathrooms: 2 full bathrooms
- Heating & cooling: Heat pump heating
- Interior features: Dishwasher; Refrigerator
- Laundry & utility:
Neighborhood map
What this means for you Summary
Snapshot
- This is a 3-bed/2.0-bath single-family listed at $180k.
Deal economics
- At list price, monthly cash flow is $-209 ($-3k/yr) — negative.
- To cash-flow at today's rent, offer at most $143k (20.6% below list).
- To meet the 1% rule (rent ≥ 1% of price), the offer needs to be $117k (35.1% below list).
- Recommended offer: $117k (35.1% below list) — sets the bar for 1% rule.
Location & tenants
- Location reads 60/100 on livability (#379 in GA) — a middle-class / working-renter tenant base. Strengths: cost of living A+, crime B+, housing B+; Watch: health & safety D, amenities F, commute F.
- Lanier County (rural): math 33% / reading 38% proficiency, ranked #67 of 174 in GA (top 38%) — families likely to look elsewhere, expect single-tenant / working-renter base with shorter leases; 65% free/reduced lunch — lower-income household profile, screen leases tightly.
- Zoned schools: Lanier County Primary School (498 students, 86% FRL); Lanier County Middle School (math 27% / reading 41%, grade F, #201 of 470 statewide, top 44%, 413 students, 86% FRL); Lanier County High School (math 37% / reading 22%, grade F, #140 of 424 statewide, top 35%, 451 students, 86% FRL) — zoned schools average 86% FRL vs 65% district-wide (21 pts higher); higher-poverty schools than district average — tighter screening recommended.
- Market conditions: 69 active listings in the ZIP; 3 comparable units currently listed for rent nearby; rentals at typical pace (median 23d on market — plan ~3-4 weeks tenant-placement turnaround); 35 units permitted in Lanier County in 2024 (0 in 5+ unit buildings).
Forward outlook
- In year one you build about $9k of equity ($1k loan paydown + $8k appreciation (4.4% local appreciation)).
- By year 4, paydown + projected appreciation supports a ~$31k cash-out refi (75% LTV) — recoverable capital for the next deal without selling this one.
Negotiation context
- It's been on market 45 days — a 3% lower offer ($175k) is reasonable based on typical stale-listing flexibility.
- 3 sale attempts since 5y ago; this cycle's ask has dropped $10k (5%) from the opening price — seller is motivated, your offer sets the floor, not the list.
- Current owner paid $57k; list at $180k implies a 216% gain — meaningful room to come down on a strong offer.
Risks & watch-outs
- Watch-outs: built in 1945 — expect roof / HVAC / electrical / plumbing capex.
- Climate carrying-cost: severe wind risk, 99% chance of damaging wind over 30y; major wildfire risk; extreme-heat days projected 7→20/yr by 2055 (HVAC capex compounding) — expect insurance premiums to compound above CPI over the hold.
Questions for the listing agent
- What do current leases actually rent for vs. the listed asking? Can we see a recent rent roll and the last 12 months of T-12 income?
- It's been on market 45 days. Have you received any prior offers? Is the seller open to a 35% concession, seller financing, or rate buy-down credit?
- Built in 1945 — when were the roof, HVAC, electrical panel, plumbing, and water heater last replaced?
- Is there a deadline driving the sale (1031 exchange, divorce, estate, relocation)? That informs how much negotiation room exists.
- Schools are D-rated, which usually means shorter tenancies and higher turnover. Who's the typical renter profile here, and what's been the actual vacancy rate?
- The area grade is low — what's the realistic commute time and amenity access for the typical tenant pool here? Any planned neighborhood developments (good or bad) we should know about?
- What's the average days-on-market for RENTAL listings here right now (not sales)? A rising rental-DOM trend means longer vacancies and softer asking-rent achievability than the comps imply.
- What's the recent tenant-quality profile in this submarket — average credit score on applications, eviction rate, late-payment / NSF rate, and stable-employment percentage? A property-management company in the area should have these aggregated.
- How much new for-sale + rental construction is in the pipeline within 1–3 miles? Heavy new supply typically softens prices + rents 12–24 months out; constrained supply supports both.
Investment metrics
- 1% rule
- 0.65% ✗
- Cap rate
- 4.90%
- Cash-on-cash
- -4.99%
- DSCR
- 0.78
- GRM
- 12.8
CMA / ARV
- ARV (median comp)
- $217,025
- List price
- $179,900
- Delta
- -17.11%
- Verdict
- UNDERPRICED
- Comps
- 20 within 1.0 mi
Show comp detail 12 sales within ~0.75 mi
| Address | Dist | Beds/Ba | Sqft | Sold | Price | $/sf | Match |
|---|---|---|---|---|---|---|---|
| 19 W Lee Ave | 0.17mi | 3/2.0 | 1,504 (-13%) | 7mo | $227,500 | $151 | 65 |
| 15 Studstill St | 0.07mi | 4/1.5 (+1) | 1,554 (-10%) | 10mo | $86,900 | $56 | 65 |
| 39 N Pecan St | 0.26mi | 4/2.0 (+1) | 1,558 (-10%) | 4mo | $179,900 | $115 | 63 |
| 56 N Temple St | 0.59mi | 4/2.0 (+1) | 1,721 (-0%) | 7mo | $287,000 | $167 | 61 |
| 83 E Howell Dr | 0.57mi | 3/2.5 | 1,620 (-6%) | 3mo | $165,250 | $102 | 59 |
| 12 Herndon Xing | 0.19mi | 4/2.0 (+1) | 1,537 (-11%) | 14mo | $255,000 | $166 | 56 |
| 79 W Thigpen Ave | 0.04mi | 3/2.0 | 1,479 (-14%) | 24mo | $236,500 | $160 | 54 |
| 43 W Howell Dr | 0.35mi | 3/2.0 | 1,513 (-12%) | 14mo | $189,500 | $125 | 52 |
| 58 S Lakeshore Dr | 0.51mi | 3/2.0 | 1,575 (-9%) | 12mo | $183,000 | $116 | 51 |
| 13 Pine Breeze Ct | 0.37mi | 3/2.0 | 1,477 (-14%) | 13mo | $199,000 | $135 | 48 |
| 68 W Patten Ave | 0.26mi | 3/2.0 | 1,961 (+14%) | 24mo | $193,000 | $98 | 45 |
| 50 S Lakeshore Dr | 0.47mi | 3/2.0 | 1,926 (+12%) | 24mo | $310,000 | $161 | 39 |
Match score weights: distance 35% · size 25% · config 20% · recency 20%. Top-matched comps best support the ARV.
Projected returns pro-forma
4.42% appreciation · 3.0% rent growth · sell at horizon
- IRR
- 7.1%
- Equity multiple
- 1.44×
- Total profit
- $22,199
- Equity at exit
- $95,693
- IRR
- 9.3%
- Equity multiple
- 2.62×
- Total profit
- $81,547
- Equity at exit
- $160,201
Cash invested: $50,372 (down + closing). Projections, not guarantees.
Landlord ↔ Tenant lean methodology
- Overall (STATE)
- 90 Strongly Landlord-Friendly
- State Georgia
- 90 Strongly Landlord-Friendly · R+3
- County
- — inherits STATE
- City
- — inherits STATE
ZIP-level market 31635
- Home prices YoY
- 2.2%
- Active inventory
- 69
- Price-to-rent
- 12.8×
Monthly cashflow live
- Estimated rent
- $1,168 medium interval (Pro) →
- Mortgage (P&I)
- −$943
- Tax from tax record
- −$114 /mo · $1,368/yr
- Insurance
- −$75
- HOA
- −$0
- Vacancy / Maint / Mgmt
- −$245
- Net cashflow
- $-209
Break-even live
Sensitivity live
| Price | -10% $-108 | -5% $-158 | +0% $-209 | +5% $-260 | +10% $-311 |
|---|---|---|---|---|---|
| Rent | -10% $-302 | -5% $-256 | +0% $-209 | +5% $-163 | +10% $-117 |
| Rate | -1.0pp $-119 | -0.5pp $-164 | base $-209 | +0.5pp $-256 | +1.0pp $-303 |
UW: 25.0% down · 7.5% · 30yr · 1.5% tax · 5.0% vac · 8.0% maint · 8.0% mgmt
Financing live
Cash to close
- Down payment
- $44,975
- Closing costs
- $5,397
- Reserves months
- —
- Total cash needed
- —
Loan-product check · same deal, 3 products live
Conventional
25% down · 7.5% · 30yr
- Down + closing
- —
- Monthly P&I
- —
- Monthly cashflow
- —
- DSCR
- —
- Eligible?
- —
Personal DTI + credit; lowest rate.
DSCR
20% down · 8.5% · 30yr
- Down + closing
- —
- Monthly P&I
- —
- Monthly cashflow
- —
- DSCR
- —
- Eligible?
- —
No personal income docs; deal must DSCR.
Hard money
10% down · 12.0% · 12mo
- Down + closing
- —
- Monthly P&I
- —
- Monthly cashflow
- —
- DSCR
- —
- Eligible?
- —
Short-term bridge; refi at stabilization.
Rent comps 3 comps
| Address | Beds | Baths | Sqft | Rent | $/sqft | DOM | Units | Dist |
|---|---|---|---|---|---|---|---|---|
| 4 E Howell Dr Lakeland, GA | 3.0 | 2.0 | 1320 | $1,100 | $0.83 | 23d | 1 | 0.18mi |
| 149 W Main St Unit 149-E MAIN-1 Lakeland, GA | 2.0 | 2.5 | 1156 | $980 | $0.85 | 23d | 1 | 0.19mi |
| 10 W Howell Dr Lakeland, GA | 3.0 | 2.0 | 1605 | $1,395 | $0.87 | 23d | 1 | 0.22mi |
Listing history 22 events
-
2026-06-21days on market $179,900 Active 45 DOM
-
2026-06-19days on market $179,900 Active 43 DOM
-
2026-06-18days on market $179,900 Active 42 DOM
-
2026-06-17status $179,900 Active 41 DOM
-
2026-06-15statusdays on market $179,900 Pending 41 DOM
-
2026-06-14days on market $179,900 Active 40 DOM
-
2026-06-13days on market $179,900 Active 39 DOM
-
2026-06-10days on market $179,900 Active 37 DOM
-
2026-06-09days on market $179,900 Active 36 DOM
-
2026-06-08days on market $179,900 Active 35 DOM
-
2026-06-07days on market $179,900 Active 34 DOM
-
2026-06-05days on market $179,900 Active 31 DOM
-
2026-06-03days on market $179,900 Active 30 DOM
-
2026-06-02days on market $179,900 Active 29 DOM
-
2026-06-01days on market $179,900 Active 28 DOM
-
2026-05-31days on market $179,900 Active 27 DOM
-
2026-05-30days on market $179,900 Active 26 DOM
-
2026-05-04$189,900 Active 543-char remark
-
2021-02-09soldstatus $57,000
-
2021-02-08soldstatus $57,000
Show marketing remark (251 chars)
Good-sized home located on a large shaded lot with mature pecan trees. Recently painted; numerous upgrades throughout the home. It has a metal roof, vinyl siding, and a separate workshop adjacent to a huge carport. Land is actually four separate lots.
-
2021-01-07$59,900
Show marketing remark (251 chars)
Good-sized home located on a large shaded lot with mature pecan trees. Recently painted; numerous upgrades throughout the home. It has a metal roof, vinyl siding, and a separate workshop adjacent to a huge carport. Land is actually four separate lots.
-
2020-03-20soldstatus $1,000
ⓘ Source: listings_history table (triggers on properties + properties_extension) + one-shot
backfill from property_details.listing_events for pre-trigger history.
Tax reassessment forecast GA · Resets to sale price
- Current annual tax
- $1,368 · $114/mo
- Projected year-2 tax
- $1,655 · $138/mo
- Expected delta
- +$287/yr (+$24/mo · 21.0%)
ⓘ Screening estimate from a state-policy table — verify with the county assessor before closing.
Climate risk First Street
- Flood 1/10 Low FEMA zone X (unshaded) · 0% chance over 30 yrs
- Wildfire 6/10 Major
- Heat 8/10 Severe 7 d/yr ≥107°F today · 20 d/yr by 30 yrs out
- Wind 8/10 Severe 99% chance of damaging wind over 30 yrs
- Air quality 7/10 Severe 16 unhealthy d/yr today · 17 by 30 yrs out
Nearby sold comps map
Loading sold comps map…
Walkable amenities ~0.75 mi
Loading nearby amenities…
Taxation est. · year 1
- Rental income
- $14,019
- − Mortgage interest
- −$10,077
- − Property taxes
- −$1,368
- − Insurance
- −$900
- − Repairs & maintenance
- −$1,122
- − Management
- −$1,122
- − Depreciation
- −$5,233
- Taxable loss
- −$5,801
- Est. tax savings @ 24.0%
- +$1,392
- After-tax cash flow
- $-1,120/yr
For passive investors: Depreciation is non-cash, so a rental often shows a tax loss while cash-flowing — sheltering income. Rental losses are passive: they offset passive income freely, and up to $25,000/yr can offset ordinary (W-2) income if you actively participate and your MAGI is under $100k (phasing out to $0 by $150k); unused losses carry forward. On sale, claimed depreciation is recaptured at up to 25%, and gains may owe capital-gains tax (a 1031 exchange can defer both). Figures are a year-1 estimate at your 24.0% rate — not tax advice; consult a CPA.
Schools (NCES district)
- District
- Lanier County
- NCES district ID
- 1303240
- Math proficiency
- 33% ▼ -8.00%
- Reading proficiency
- 38% ▼ -2.00%
- Median HH income
- $38,019
- Composite
- 29.6/100
- National rank
- #6476
- State rank
- #67 of 174 in GA
Livability — Lakeland
- Score
- 60/100
- State rank
- #379
- US rank
- #19151
Category grades
Schools grade is shown separately in the Schools card above.
Census & demographics
- Census place
- Lakeland, GA
- Population (ZIP)
- 6,978
Population outlook (Lanier County) Hauer SSP2
- Today (2025)
- 10,743 people
- By 2030
- 10,892 · +1.4%
- By 2040
- 10,975 · +2.2%
- By 2050
- 10,764 · +0.2%
- By 2075
- 9,418 · -12.3%
- By 2100
- 7,419 · -30.9%
Race, ethnicity, and origin ACS 2023
- Neighborhood character
- Majority White (65%)
- Race & ethnicity
- White 65% Black 29% Hispanic / Latino 4% Two or more races 3%
- Common ancestry
- Iranian 2% Italian 1% Romanian 1%
- Foreign-born
- 2% · Canada, Jamaica
- Languages at home
- 95% English-only · Spanish 3% German/W. Germanic 1% Korean 1%
Political lean MEDSL · Lanier
- 2024 margin
- Solid R (+46.3) · D 26.6% · R 73.0%
- 2008→2024 swing
- -21.1pp toward R · 2008: -25.2pp · 2024: -46.3pp
- All cycles
- 2024: R+46.3 2020: R+41.7 2016: R+41.2 2012: R+23.8 2008: R+25.2
Not yet ingested
- Civics
- —
Market trends
- HPI YoY
- ▲ 4.42%
- Current HPI
- 201.1664
- Rent YoY
- —
- Metro
- —
- State GDP YoY
- ▲ 2.66%
- F500 in state
- 28
Industry mix (Fortune 500 HQ in GA)
| Industry | F500 HQs | Revenue |
|---|---|---|
| Paper / Packaging | 2 | $29B |
|
||
| Retail | 1 | $160B |
|
||
| Transportation / Logistics | 1 | $91B |
|
||
| Airlines | 1 | $62B |
|
||
| Consumer Goods | 1 | $47B |
|
||
| Utilities | 1 | $25B |
|
||
Price history
+17890.0% since first listed8 events — show timeline
- 2026-06-17 Relisted — SGMLS
- 2026-06-14 Pending — SGMLS
- 2026-05-20 Price Changed $179,900 SGMLS
- 2026-05-04 Listed $189,900 SGMLS
- 2021-02-09 Sold (Public Records) $57,000 Public Records
- 2021-02-08 Sold (MLS) $57,000 SGMLS
- 2021-01-07 Listed $59,900 SGMLS
- 2020-03-20 Sold (Public Records) $1,000 Public Records
Property tax history
+0.4%/yrLatest (2025): $1,368 · -9.4% YoY. Source: county tax records.
Cash-flow waterfall
monthlySold comps — $/sqft
last 12 mo · ≤1 miLoading sold comps…