819 Cator Ave · Baltimore, MD
Flood risk 1/10 · Minimal
- FEMA flood zone
- X (unshaded)
- Chance of flooding over 30 yrs
- 0.0%
- Est. flood insurance / yr
- $473 – $860
Fire risk 1/10 · Minimal
- Est. fire insurance / yr
- $755 – $1,403
Heat risk 7/10 · Major
- Hot days now (above 103°F)
- 7 days/yr
- Hot days in 30 yrs
- 15 days/yr
Wind risk 6/10 · Moderate
- Chance of severe wind over 30 yrs
- 27.0%
Air-quality risk 4/10 · Minor
- Unhealthy air days now
- 6 days/yr
- Unhealthy air days in 30 yrs
- 7 days/yr
Risk factors via First Street. Map © Google.
Why this score? — see what drove the C- grade
The composite is a weighted blend of 9 inputs, each scored 0–100. Each bar is that input's sub-score; the figure is the points it added to the 100-point composite (weight × sub-score).
- Cash flow +16.8/30.0
- ARV discount +13.7/15.0
- DSCR +5.2/10.0
- 1% rule +4.1/10.0
- Livability +3.8/5.0
- Rent growth +2.9/5.0
- Condition / age +2.5/5.0
- Schools +1.0/10.0
- Appreciation +0.0/10.0
$208,000
🖨 Deal sheet (PDF) 📄 Offer letter ✓ Due diligence
Listing remarks
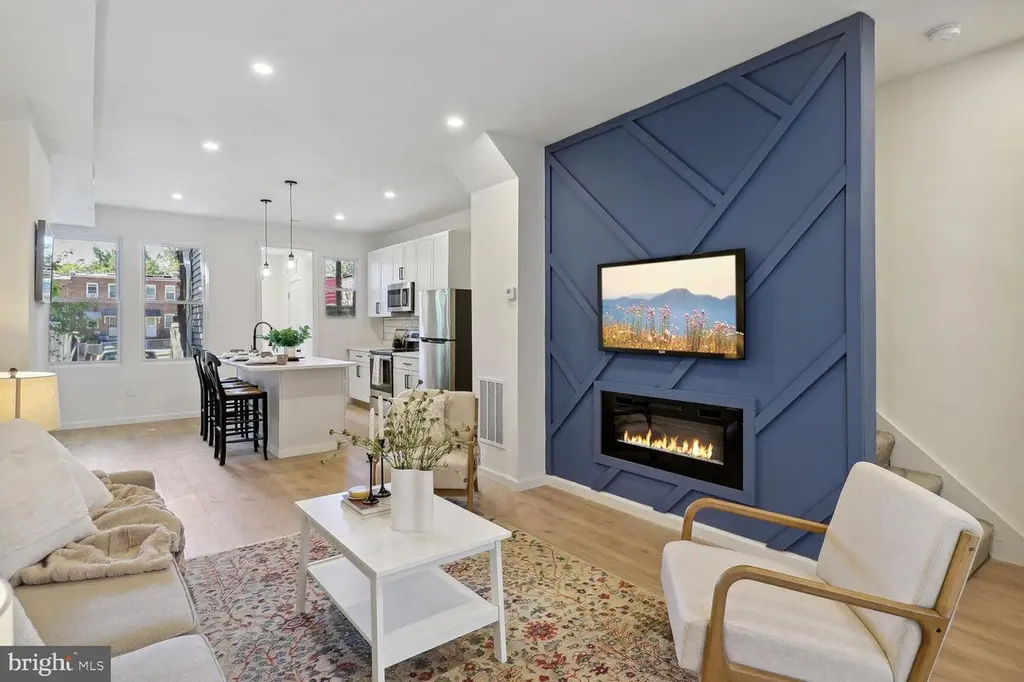
Welcome to this beautiful 3 bedroom, 2 bathroom home in the charming Penn Lucy neighborhood. The main floor boasts a sunroom drenched in natural light, hardwood floors, high ceilings, and a stunning 5-seat kitchen island. The open kitchen showcases Quartz countertops, stainless steel appliances, and pendant lighting. Upstairs, 3 bedrooms offer comfort, while the basement provides a spacious living room and full bath. With stainless steel appliances, central HVAC system, and water heater, plus a generous backyard. Ask about the $10,000 Grant for eligible 1st Time Homebuyers.
Key facts
- Quartz countertops
- Sunroom
- Generous backyard
Tags
Property features AI
Finance
- Other: Fee simple ownership; Estimated finished area above grade and below grade (above grade finished approx. 1,104; below grade finished approx. 592); Total below-grade area approx. 592
- HOA & community: Ground rent paid annually
Exterior
- Parking: On-street parking
- Utilities: Public water; Public sewer; Electric service
- Home design: Interior townhouse/rowhouse; Located in city limits (Baltimore City)
- Construction: Brick exterior; Concrete perimeter foundation; Estimated year built
- Exterior features: Brick construction; Concrete perimeter foundation; Above-grade and below-grade structures; Two or more access exits
Interior
- Bedrooms: Three bedrooms on the first upper level
- Bathrooms: Two full bathrooms (one on the first upper level, one on the first lower level)
- Heating & cooling: Radiator heat (electric); Central air conditioning (electric); Electric hot water
- Interior features: Fully finished basement; One fireplace
Neighborhood map
What this means for you Summary
Snapshot
- This is a 3-bed/2.0-bath townhouse listed at $208k.
Deal economics
- At list price, monthly cash flow is $134 ($2k/yr) — positive.
- The deal already cash-flows at list — no discount required.
- To meet the 1% rule (rent ≥ 1% of price), the offer needs to be $188k (9.4% below list).
- Recommended offer: $188k (9.4% below list) — sets the bar for 1% rule.
Location & tenants
- Location reads 76/100 on livability (#90 in MD, #3,396 nationally) — a middle-class / working-renter tenant base. Strengths: amenities A+, commute A+, housing A+; Watch: crime F.
- Baltimore City Public Schools (urban): math 7% / reading 16% proficiency, ranked #24 of 24 in MD (top 100%) — low school quality limits family demand, transient renter base, plan for 1-2y turnover; 79% free/reduced lunch — lower-income household profile, screen leases tightly.
- Zoned schools: Elmer A. Henderson: A Johns Hopkins Partnership (math 2% / reading 16%, grade F, #650 of 860 statewide, top 77%, 642 students, 80% FRL); Baltimore Polytechnic Institute (math 71% / reading 84%, grade A-, #22 of 222 statewide, top 10%, 1,555 students, 43% FRL) — zoned schools average 62% FRL vs 79% district-wide (17 pts lower); this property's tenant base skews higher-income than the district average.
- Zoned-school proficiency averages 43% at this address vs 12% district-wide (+32 pts) — the actual schools serving this property are materially stronger than the Baltimore City Public Schools average implies; a family-tenant draw the district grade alone would hide.
- Market conditions: Rents rising (+1.6%/yr); 330 active listings in the ZIP; 40 comparable units currently listed for rent nearby; rentals at typical pace (median 26d on market — plan ~3-4 weeks tenant-placement turnaround); 45% of comp listings sitting > 30 days — soft ceiling on asking rent; 1,273 units permitted in Baltimore city in 2024 (1,104 in 5+ unit buildings).
- This rent runs 36% of the median local income ($62k/yr) — at the standard rent-burdened threshold; future hikes will face affordability resistance.
Forward outlook
- Local home prices are declining (-3.0%/yr); year-one equity from $1k of loan paydown is wiped out by about $6k of value loss. Plan a longer hold.
- Baltimore County population projected to shrink 4% by 2050 — rents likely to lag national; underwrite the cash flow, not the appreciation.
Negotiation context
- Only 4 days on market — expect competitive offers; lowballing is unlikely to land.
- 2 sale attempts since 4y ago with the ask held roughly flat each time — persistent listings suggest the price (not the market) is what's stuck; bring a comps-based counter.
- Current owner paid $46k; list at $208k implies a 352% gain — meaningful room to come down on a strong offer.
Risks & watch-outs
- Watch-outs: built in 1924 — expect roof / HVAC / electrical / plumbing capex.
- Climate carrying-cost: major wind risk, 27% chance of damaging wind over 30y; extreme-heat days projected 7→15/yr by 2055 (HVAC capex compounding) — expect insurance premiums to compound above CPI over the hold.
Questions for the listing agent
- Built in 1924 — when were the roof, HVAC, electrical panel, plumbing, and water heater last replaced?
- Is there a deadline driving the sale (1031 exchange, divorce, estate, relocation)? That informs how much negotiation room exists.
- Schools are D-rated, which usually means shorter tenancies and higher turnover. Who's the typical renter profile here, and what's been the actual vacancy rate?
- Crime grade is F in this area — have there been break-ins, vandalism, or insurance claims at this property in the last 3 years? What carrier currently insures it and at what premium?
- What's the average days-on-market for RENTAL listings here right now (not sales)? A rising rental-DOM trend means longer vacancies and softer asking-rent achievability than the comps imply.
- What's the recent tenant-quality profile in this submarket — average credit score on applications, eviction rate, late-payment / NSF rate, and stable-employment percentage? A property-management company in the area should have these aggregated.
- How much new for-sale + rental construction is in the pipeline within 1–3 miles? Heavy new supply typically softens prices + rents 12–24 months out; constrained supply supports both.
Investment metrics
- 1% rule
- 0.91% ✗
- Cap rate
- 7.07%
- Cash-on-cash
- 2.77%
- DSCR
- 1.12
- GRM
- 9.2
CMA / ARV
- ARV (on-the-fly)
- $241,056
- Comps found
- 12
Show comp detail 12 sales within ~0.75 mi
| Address | Dist | Beds/Ba | Sqft | Sold | Price | $/sf | Match |
|---|---|---|---|---|---|---|---|
| 1101 Andover Rd | 0.27mi | 4/2.0 (+1) | 1,500 (+1%) | 2mo | $257,000 | $171 | 80 |
| 3825 Elkader Rd | 0.30mi | 4/2.0 (+1) | 1,352 (-9%) | 1mo | $275,000 | $203 | 65 |
| 3807 Elkader Rd | 0.33mi | 4/2.0 (+1) | 1,352 (-9%) | 0mo | $235,000 | $174 | 64 |
| 617 Willow Ave | 0.39mi | 3/2.0 | 1,641 (+10%) | 2mo | $235,000 | $143 | 63 |
| 5019 Midwood Ave | 0.71mi | 3/2.0 | 1,455 (-2%) | 2mo | $198,000 | $136 | 62 |
| 646 E 37th St | 0.38mi | 3/2.0 | 1,284 (-14%) | 0mo | $94,000 | $73 | 59 |
| 609 Melville Ave | 0.54mi | 4/2.0 (+1) | 1,364 (-8%) | 1mo | $120,000 | $88 | 54 |
| 3628 Elkader Rd | 0.41mi | 3/1.0 | 1,675 (+13%) | 2mo | $272,000 | $162 | 54 |
| 715 Radnor Ave | 0.57mi | 4/2.0 (+1) | 1,600 (+8%) | 2mo | $249,900 | $156 | 54 |
| 3633 Elkader Rd | 0.42mi | 2/1.5 (-1) | 1,304 (-12%) | 1mo | $265,000 | $203 | 52 |
| 4662 Kernwood Ave | 0.60mi | 3/1.5 | 1,652 (+11%) | 1mo | $240,000 | $145 | 51 |
| 1510 Medford Rd | 0.61mi | 3/2.0 | 1,700 (+14%) | 2mo | $285,000 | $168 | 46 |
Match score weights: distance 35% · size 25% · config 20% · recency 20%. Top-matched comps best support the ARV.
Projected returns pro-forma
-3.0% appreciation · 1.63% rent growth · sell at horizon
- IRR
- -13.4%
- Equity multiple
- 0.52×
- Total profit
- $-27,744
- Equity at exit
- $31,013
- IRR
- -6.7%
- Equity multiple
- 0.60×
- Total profit
- $-23,476
- Equity at exit
- $17,984
Cash invested: $58,240 (down + closing). Projections, not guarantees.
Landlord ↔ Tenant lean methodology
- Overall (CITY)
- 12 Strongly Tenant-Friendly
- State Maryland
- 27 Tenant-Leaning · D+14
- County
- — inherits STATE
- City Baltimore
- 12 Strongly Tenant-Friendly · D+58
ZIP-level market 21218
- Rents YoY
- 1.6%
- Active inventory
- 330
- Price-to-rent
- 9.2×
Monthly cashflow live
- Estimated rent
- $1,885 high interval (Pro) →
- Mortgage (P&I)
- −$1,091
- Tax from tax record
- −$177 /mo · $2,128/yr
- Insurance
- −$87
- HOA
- −$0
- Vacancy / Maint / Mgmt
- −$396
- Net cashflow
- $134
Break-even live
Sensitivity live
| Price | -10% $252 | -5% $193 | +0% $134 | +5% $75 | +10% $16 |
|---|---|---|---|---|---|
| Rent | -10% $-15 | -5% $60 | +0% $134 | +5% $209 | +10% $283 |
| Rate | -1.0pp $239 | -0.5pp $187 | base $134 | +0.5pp $80 | +1.0pp $25 |
UW: 25.0% down · 7.5% · 30yr · 1.5% tax · 5.0% vac · 8.0% maint · 8.0% mgmt
Financing live
Cash to close
- Down payment
- $52,000
- Closing costs
- $6,240
- Reserves months
- —
- Total cash needed
- —
Loan-product check · same deal, 3 products live
Conventional
25% down · 7.5% · 30yr
- Down + closing
- —
- Monthly P&I
- —
- Monthly cashflow
- —
- DSCR
- —
- Eligible?
- —
Personal DTI + credit; lowest rate.
DSCR
20% down · 8.5% · 30yr
- Down + closing
- —
- Monthly P&I
- —
- Monthly cashflow
- —
- DSCR
- —
- Eligible?
- —
No personal income docs; deal must DSCR.
Hard money
10% down · 12.0% · 12mo
- Down + closing
- —
- Monthly P&I
- —
- Monthly cashflow
- —
- DSCR
- —
- Eligible?
- —
Short-term bridge; refi at stabilization.
Rent comps 40 comps
| Address | Beds | Baths | Sqft | Rent | $/sqft | DOM | Units | Dist |
|---|---|---|---|---|---|---|---|---|
| 815 Gilrubin Ct Baltimore, MD | 2.0 | 1.0 | 900 | $1,695 | $1.88 | 45d | 1 | 0.17mi |
| 812 Nat Ct Apt 12 Baltimore, MD | 2.0 | 1.0 | 900 | $1,295 | $1.44 | 45d | 1 | 0.18mi |
| 720 Springfield Ave Baltimore, MD | 3.0 | 1.0 | 1160 | $2,000 | $1.72 | 45d | 1 | 0.19mi |
| 513 E 41st St Baltimore, MD | 4.0 | 1.5 | 1620 | $1,900 | $1.17 | 45d | 1 | 0.24mi |
| 706 E 43rd St Baltimore, MD | 4.0 | 1.5 | 1596 | $1,899 | $1.19 | 3d | 1 | 0.24mi |
| 3721 Ellerslie Ave Baltimore, MD | 1.0–3.0 | 1.0–2.0 | 924 | $1,603 | $1.73 | 0d | 1 | 0.28mi |
| 4033 Greenmount Ave Baltimore, MD | 2.0 | 2.5 | 1860 | $2,550 | $1.37 | 25d | 1 | 0.29mi |
| 4303 York Rd #3 Baltimore, MD | 2.0 | 1.0 | 1680 | $1,400 | $0.83 | 45d | 1 | 0.32mi |
| 612 Chestnut Hill Ave Unit 1 Baltimore, MD | 2.0 | 1.0 | 900 | $1,999 | $2.22 | 45d | 1 | 0.35mi |
| 925 Chestnut Hill Ave Baltimore, MD | 3.0 | 1.0 | 1280 | $1,895 | $1.48 | 0d | 1 | 0.36mi |
| 4407 Old York Rd Baltimore, MD | 3.0 | 1.5 | 1356 | $1,574 | $1.16 | 22d | 1 | 0.38mi |
| 4407 Old York Rd Baltimore, MD | 3.0 | 1.5 | 1356 | $1,574 | $1.16 | 45d | 1 | 0.38mi |
| 835 E Cold Spring Ln Baltimore, MD | 2.0 | 1.5 | 997 | $1,400 | $1.40 | 25d | 1 | 0.44mi |
| 531 Willow Ave Unit Na Baltimore, MD | 4.0 | 1.0 | 1300 | $1,800 | $1.38 | 22d | 1 | 0.45mi |
| 3616 Yolando Rd Baltimore, MD | 3.0 | 2.0 | 1360 | $1,900 | $1.40 | 0d | 1 | 0.48mi |
| 721 E 36th St Unit Na Baltimore, MD | 2.0 | 1.0 | 1156 | $1,650 | $1.43 | 45d | 1 | 0.49mi |
| 724 E 35th St Baltimore, MD | 3.0 | 1.5 | 1368 | $2,000 | $1.46 | 16d | 1 | 0.57mi |
| 804 Radnor Ave Baltimore, MD | 3.0 | 1.0 | 1654 | $2,000 | $1.21 | 45d | 1 | 0.58mi |
| 3529 Greenmount Ave Baltimore, MD | 3.0 | 2.0 | 1316 | $1,575 | $1.20 | 45d | 1 | 0.58mi |
| 1504 Upshire Rd Unit 1E Baltimore, MD | 2.0 | 1.0 | 1000 | $1,400 | $1.40 | 45d | 1 | 0.61mi |
| 1040 E 33rd St Baltimore, MD | 1.0–2.0 | 1.0–2.0 | 775 | $1,525 | $1.97 | 0d | 9 | 0.61mi |
| 1539 Ralworth Rd Baltimore, MD | 3.0 | 2.0 | 1580 | $1,950 | $1.23 | 16d | 1 | 0.66mi |
| 514 Radnor Ave Baltimore, MD | 3.0 | 1.5 | 1575 | $1,500 | $0.95 | 46d | 1 | 0.67mi |
| 1260 Rossiter Ave Baltimore, MD | 2.0 | 1.0 | 710 | $1,250 | $1.76 | 0d | 36 | 0.71mi |
| 1617 Argonne Dr Baltimore, MD | 4.0 | 2.0 | 1200 | $2,550 | $2.12 | 45d | 1 | 0.72mi |
| 1502 Fernley Rd Baltimore, MD | 3.0 | 2.0 | 1350 | $2,800 | $2.07 | 45d | 1 | 0.75mi |
| 3222 Ellerslie Ave Baltimore, MD | 4.0 | 1.5 | 1550 | $1,950 | $1.26 | 45d | 1 | 0.78mi |
| 1224 Winston Ave Baltimore, MD | 3.0 | 2.0 | 1248 | $2,100 | $1.68 | 19d | 1 | 0.80mi |
| 3601 Greenway #101 Baltimore, MD | 2.0 | 2.0 | 1470 | $2,700 | $1.84 | 6d | 1 | 0.80mi |
| 1543 Northwick Rd Unit 2 Baltimore, MD | 2.0 | 1.0 | 1160 | $1,100 | $0.95 | 0d | 1 | 0.80mi |
| 348 E University Pkwy Baltimore, MD | 4.0 | 2.0 | 1809 | $2,400 | $1.33 | 45d | 1 | 0.80mi |
| 543 Chateau Ave Baltimore, MD | 3.0 | 2.0 | 1152 | $1,900 | $1.65 | 6d | 1 | 0.82mi |
| 510 Winston Ave Baltimore, MD | 4.0 | 2.0 | 1600 | $2,800 | $1.75 | 22d | 1 | 0.82mi |
| 1275 Kitmore Rd Unit 1245K-T Baltimore, MD | 3.0 | 1.0 | 935 | $1,895 | $2.03 | 6d | 1 | 0.86mi |
| 1275 Kitmore Rd Unit 1262B-A Baltimore, MD | 2.0 | 1.0 | 923 | $1,320 | $1.43 | 3d | 1 | 0.86mi |
| 1 E University Pkwy Baltimore, MD | 1.0–3.0 | 1.0–2.0 | 1045 | $2,500 | $2.39 | 6d | 2 | 0.87mi |
| 416 Winston Ave Unit 426-01 Baltimore, MD | 2.0 | 1.0 | 890 | $1,250 | $1.40 | 45d | 1 | 0.87mi |
| 3501 Saint Paul St Baltimore, MD | 2.0 | 1.0 | 673 | $2,030 | $3.02 | 0d | 186 | 0.88mi |
| 3811 Canterbury Rd Baltimore, MD | 2.0 | 1.0–2.0 | 975 | $2,495 | $2.56 | 14d | 5 | 0.88mi |
| 1545 E Cold Spring Ln Baltimore, MD | 4.0 | 2.0 | 1240 | $2,000 | $1.61 | 45d | 1 | 0.89mi |
Listing history 8 events
-
2026-06-21days on market $208,000 Active 4 DOM
-
2026-06-18remarks 580-char remark
-
2026-06-18statusdays on market $208,000 Active 1 DOM
-
2026-06-17days on market $208,000 Coming Soon 7 DOM
-
2026-06-16days on market $208,000 Coming Soon 6 DOM
-
2026-06-15days on market $208,000 Coming Soon 5 DOM
-
2026-06-13remarks 564-char remark
-
2026-06-13$208,000 Coming Soon 3 DOM
ⓘ Source: listings_history table (triggers on properties + properties_extension) + one-shot
backfill from property_details.listing_events for pre-trigger history.
Tax reassessment forecast MD · Partial reset (capped growth)
- Current annual tax
- $2,128 · $177/mo
- Projected year-2 tax
- $2,198 · $183/mo
- Expected delta
- +$70/yr (+$6/mo · 3.3%)
ⓘ Screening estimate from a state-policy table — verify with the county assessor before closing.
Climate risk First Street
- Flood 1/10 Low FEMA zone X (unshaded) · 0% chance over 30 yrs
- Wildfire 1/10 Low
- Heat 7/10 Severe 7 d/yr ≥103°F today · 15 d/yr by 30 yrs out
- Wind 6/10 Major 27% chance of damaging wind over 30 yrs
- Air quality 4/10 Moderate 6 unhealthy d/yr today · 7 by 30 yrs out
Nearby sold comps map
Loading sold comps map…
Walkable amenities ~0.75 mi
Loading nearby amenities…
Taxation est. · year 1
- Rental income
- $22,617
- − Mortgage interest
- −$11,651
- − Property taxes
- −$2,128
- − Insurance
- −$1,040
- − Repairs & maintenance
- −$1,809
- − Management
- −$1,809
- − Depreciation
- −$6,051
- Taxable loss
- −$1,872
- Est. tax savings @ 24.0%
- +$449
- After-tax cash flow
- $2,060/yr
For passive investors: Depreciation is non-cash, so a rental often shows a tax loss while cash-flowing — sheltering income. Rental losses are passive: they offset passive income freely, and up to $25,000/yr can offset ordinary (W-2) income if you actively participate and your MAGI is under $100k (phasing out to $0 by $150k); unused losses carry forward. On sale, claimed depreciation is recaptured at up to 25%, and gains may owe capital-gains tax (a 1031 exchange can defer both). Figures are a year-1 estimate at your 24.0% rate — not tax advice; consult a CPA.
Schools (NCES district)
- District
- Baltimore City Public Schools
- NCES district ID
- 2400090
- Math proficiency
- 7% ▼ -9.00%
- Reading proficiency
- 16% ▼ -5.00%
- Median HH income
- $42,108
- Composite
- 10.08/100
- National rank
- #9805
- State rank
- #24 of 24 in MD
Livability — Baltimore
- Score
- 76/100
- State rank
- #90
- US rank
- #3396
Category grades
Schools grade is shown separately in the Schools card above.
Census & demographics
- Census place
- Baltimore, MD
- County
- Baltimore City · 558,601 people
- City population
- 588,727
- Metro
- Baltimore-Columbia-Towson, MD
- Population (ZIP)
- 44,014
- Household income
- $62,488
- Rent vs Own
- Severe rent burden
- 2564.0
Population outlook (Baltimore County) Hauer SSP2
- Today (2025)
- 624,249 people
- By 2030
- 621,541 · -0.4%
- By 2040
- 609,756 · -2.3%
- By 2050
- 597,249 · -4.3%
- By 2075
- 552,236 · -11.5%
- By 2100
- 513,934 · -17.7%
Race, ethnicity, and origin ACS 2023
- Neighborhood character
- Diverse neighborhood (Simpson 0.58)
- Race & ethnicity
- Black 60% White 26% Two or more races 6% Hispanic / Latino 5% Asian 5%
- Hispanic origin (detail)
- Common ancestry
- Romanian 2% Italian 1% Scotch-Irish 1%
- Foreign-born
- 10% · Canada, China, South Korea
- Languages at home
- 87% English-only · Spanish 4% French/Haitian/Cajun 2% Chinese 2%
Political lean MEDSL · Baltimore
- 2024 margin
- Solid D (+73.0) · D 85.2% · R 12.2% · Other 2.6%
- 2008→2024 swing
- -2.5pp toward R · 2008: 75.5pp · 2024: 73.0pp
- All cycles
- 2024: D+73.0 2020: D+76.6 2016: D+74.6 2012: D+76.4 2008: D+75.5
Not yet ingested
- Civics
- —
Market trends
- HPI YoY
- ▼ -463.14%
- Current HPI
- 292.3986
- Rent YoY
- ▲ 1.63%
- Metro
- Baltimore-Columbia-Towson, MD
- State GDP YoY
- ▲ 2.97%
- F500 in state
- 12
Industry mix (Fortune 500 HQ in MD)
| Industry | F500 HQs | Revenue |
|---|---|---|
| Aerospace / Defense | 1 | $71B |
|
||
| Utilities | 1 | $25B |
|
||
| Hotels | 1 | $24B |
|
||
| Consumer Goods | 1 | $7B |
|
||
| Real Estate | 1 | $6B |
|
||
| Chemicals | 1 | $2B |
|
||
Price history
+642.9% since first listed12 events — show timeline
- 2026-06-13 Price Changed $208,000 BRIGHT MLS
- 2026-06-10 Coming Soon $205,000 BRIGHT MLS
- 2023-10-07 Listing Removed — BRIGHT MLS
- 2023-09-11 Price Changed $209,999 BRIGHT MLS
- 2023-08-31 Price Changed $212,999 BRIGHT MLS
- 2023-08-17 Listed $214,999 BRIGHT MLS
- 2023-08-15 Coming Soon — BRIGHT MLS
- 2022-09-28 Listing Removed — BRIGHT MLS
- 2022-09-14 Price Changed $92,500 BRIGHT MLS
- 2022-09-13 Listed $97,500 BRIGHT MLS
- 1999-07-09 Sold (Public Records) $46,000 Public Records
- 1986-03-03 Sold (Public Records) $28,000 Public Records
Property tax history
+0.5%/yrLatest (2025): $2,128 · +5.3% YoY. Source: county tax records.
Cash-flow waterfall
monthlySold comps — $/sqft
last 12 mo · ≤1 miLoading sold comps…