 🌊 Lakefront
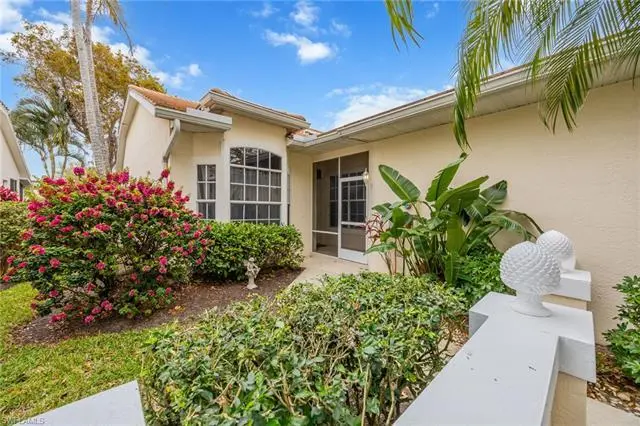
6541 Ilex Cir · Pelican Marsh, FL
Flood risk 1/10 · Minimal
- FEMA flood zone
- X (unshaded)
- Chance of flooding over 30 yrs
- 0.0%
- Est. flood insurance / yr
- $507 – $1,088
Fire risk 1/10 · Minimal
- Est. fire insurance / yr
- $947 – $1,759
Heat risk 10/10 · Severe
- Hot days now (above 107°F)
- 7 days/yr
- Hot days in 30 yrs
- 29 days/yr
Wind risk 10/10 · Severe
- Chance of severe wind over 30 yrs
- 99.0%
Air-quality risk 2/10 · Minimal
- Unhealthy air days now
- 2 days/yr
- Unhealthy air days in 30 yrs
- 2 days/yr
Risk factors via First Street. Map © Google.
Why this score? — see what drove the C- grade
The composite is a weighted blend of 9 inputs, each scored 0–100. Each bar is that input's sub-score; the figure is the points it added to the 100-point composite (weight × sub-score).
- Cash flow +18.8/30.0
- ARV discount +7.5/15.0
- DSCR +5.9/10.0
- Appreciation +5.1/10.0
- Schools +5.0/10.0
- 1% rule +4.8/10.0
- Rent growth +2.7/5.0
- Livability +2.5/5.0
- Condition / age +2.5/5.0
$479,000
🖨 Deal sheet 📄 Offer letter ✓ Due diligence
Listing remarks
Discover Tranquility at Walden Oaks. If a quiet location and quality is what you are looking for, this one is for you! In a world that never seems to stop, finding a place where the noise of busy streets are not heard was near impossible until this villa was placed on the market. Nestled in a tranquil community on a quiet street is where you’ll discover this hidden gem with reasonable HOA fees. The charming villa features 2 bedrooms, 2 baths and a den, providing ample space for comfortable living. The split bedroom layout ensures a sense of privacy and making it perfect for guest. The den, equipped with 2 closets, offers additional storage space and can be adapted to suit your needs
Key facts
- Den with 2 closets
- Split bedroom layout
- New refrigerator
Tags
Property features AI
Finance
- HOA & community: Mandatory HOA; Quarterly HOA fees ($425 quarterly; $605 master HOA quarterly); Total annual recurring fees approximately $4,120; One-time fees approximately $1,100; Professional management; Community amenities include clubhouse, community pool, internet access, pickleball and tennis courts; HOA maintenance covers cable, internet/WiFi access, irrigation water, lawn/land maintenance, manager, exterior pest control, street lights and street maintenance; Non-gated community
Exterior
- Parking: Attached 2-car garage; Paved driveway
- Utilities: Central water; Central sewer; Cable available
- Home design: Attached villa; 1-story / ranch; Rear exposure facing north; Residential property in Walden Oaks / Wellington at Lone Oak
- Construction: Concrete block construction; Stucco exterior finish; Tile roof; Built in 1996; Single-hung windows
- Exterior features: Automatic sprinkler system; Lake view / waterfront on a lake; Paved road access
Interior
- Kitchen: Dishwasher; Range; Refrigerator; Disposal
- Bedrooms: 2 bedrooms plus den; Master bedroom on ground floor; First-floor bedroom; Split bedroom floor plan
- Flooring: Laminate flooring
- Bathrooms: 2 full bathrooms; Master bath with dual sinks and shower (no tub)
- Heating & cooling: Central electric heat; Central electric air conditioning; Ceiling fans
- Interior features: Built-in cabinets; Pantry; Eat-in kitchen; Den / study; Screened lanai/porch; Laundry in residence; Auto garage door; Self-cleaning oven
- Laundry & utility: Washer and dryer included / washer-dryer hookup
Neighborhood map
What this means for you Summary
Snapshot
- This is a 2-bed/2.0-bath single-family listed at $479k.
Deal economics
- At list price, monthly cash flow is $480 ($6k/yr) — positive.
- The deal already cash-flows at list — no discount required.
- To meet the 1% rule (rent ≥ 1% of price), the offer needs to be $468k (2.3% below list).
- Recommended offer: $436k (9.0% below list) — sets the bar for market timing.
Location & tenants
- Location reads: area grade C — affects rentability + tenant quality, not the cash-flow math above.
- Collier (suburban): math 60% / reading 56% proficiency, ranked #16 of 73 in FL (top 22%) — acceptable for families but not a draw, mixed tenant base, ~2y average lease.
- Zoned schools: Pelican Marsh Elementary School (math 87% / reading 83%, grade A+, #35 of 2,144 statewide, top 2%, 709 students, 29% FRL); Barron Collier High School (math 62% / reading 68%, grade B, #76 of 667 statewide, top 11%, 1,650 students, 26% FRL) — zoned schools average 28% FRL vs 55% district-wide (27 pts lower); this property's tenant base skews higher-income than the district average.
- Zoned-school proficiency averages 75% at this address vs 58% district-wide (+17 pts) — the actual schools serving this property are materially stronger than the Collier average implies; a family-tenant draw the district grade alone would hide.
- Market conditions: Rents flat; 424 active listings in the ZIP; 40 comparable units currently listed for rent nearby; rentals at typical pace (median 23d on market — plan ~3-4 weeks tenant-placement turnaround); solid renter incomes; 3,520 units permitted in Collier County in 2024 (959 in 5+ unit buildings).
- At $4,680/mo this rent would consume 61% of the median local household income ($92k/yr) (locally 1712% of renters already pay >50% of income on rent) — very limited rent-growth headroom before tenants either downsize or default.
Forward outlook
- In year one you build about $5k of equity ($3k loan paydown + $1k appreciation (0.3% local appreciation)).
- Collier County population projected at +30% by 2050 — long-run rental-demand tailwind backs the buy-and-hold thesis.
- By year 6, paydown + projected appreciation supports a ~$31k cash-out refi (75% LTV) — recoverable capital for the next deal without selling this one.
Negotiation context
- It's been on market 91 days — a 9% lower offer ($436k) is reasonable based on typical stale-listing flexibility.
- Current owner paid $175k; list at $479k implies a 174% gain — meaningful room to come down on a strong offer.
Risks & watch-outs
- Climate carrying-cost: severe wind risk, 99% chance of damaging wind over 30y; extreme-heat days projected 7→29/yr by 2055 (HVAC capex compounding) — expect insurance premiums to compound above CPI over the hold.
Questions for the listing agent
- It's been on market 91 days. Have you received any prior offers? Is the seller open to a 9% concession, seller financing, or rate buy-down credit?
- What does the HOA fee cover, when was the last increase, and are there any pending special assessments or reserve-fund shortfalls?
- Why hasn't it sold? Are there any deal-killer items the seller is aware of (foundation, flood, title, zoning, code violations)?
- Is there a deadline driving the sale (1031 exchange, divorce, estate, relocation)? That informs how much negotiation room exists.
- This sits on a lake — are riparian / water-frontage rights deeded with the parcel? Any dock permits, shoreline easements, or HOA water-use restrictions?
- What's the documented flood / surge / shoreline-erosion history here (FEMA AND non-FEMA — e.g., storm surge, creek backup, septic-field saturation)?
- Any water-quality or seasonal algae-bloom issues that affect tenant satisfaction or short-term-rental demand?
- What's the average days-on-market for RENTAL listings here right now (not sales)? A rising rental-DOM trend means longer vacancies and softer asking-rent achievability than the comps imply.
- What's the recent tenant-quality profile in this submarket — average credit score on applications, eviction rate, late-payment / NSF rate, and stable-employment percentage? A property-management company in the area should have these aggregated.
- How much new for-sale + rental construction is in the pipeline within 1–3 miles? Heavy new supply typically softens prices + rents 12–24 months out; constrained supply supports both.
Investment metrics
- 1% rule
- 0.98% ✗
- Cap rate
- 7.50%
- Cash-on-cash
- 4.30%
- DSCR
- 1.19
- GRM
- 8.5
CMA / ARV
No comps found within radius.
Projected returns pro-forma
0.29% appreciation · 0.92% rent growth · sell at horizon
- IRR
- 2.1%
- Equity multiple
- 1.10×
- Total profit
- $13,676
- Equity at exit
- $146,191
- IRR
- 5.9%
- Equity multiple
- 1.63×
- Total profit
- $84,073
- Equity at exit
- $181,504
Cash invested: $134,120 (down + closing). Projections, not guarantees.
Landlord ↔ Tenant lean methodology
- Overall (STATE)
- 87 Strongly Landlord-Friendly
- State Florida
- 87 Strongly Landlord-Friendly · R+3
- County
- — inherits STATE
- City
- — inherits STATE
ZIP-level market 34109
- Home prices YoY
- 0.1%
- Rents YoY
- 0.9%
- Active inventory
- 424
- Price-to-rent
- 8.5×
Monthly cashflow live
- Estimated rent
- $4,680 high interval (Pro) →
- Mortgage (P&I)
- −$2,512
- Tax from tax record
- −$162 /mo · $1,944/yr
- Insurance
- −$200
- HOA
- −$343
- Vacancy / Maint / Mgmt
- −$983
- Net cashflow
- $480
Break-even live
UW: 25.0% down · 7.5% · 30yr · 1.5% tax · 5.0% vac · 8.0% maint · 8.0% mgmt
Financing live
Cash to close
- Down payment
- $119,750
- Closing costs
- $14,370
- Reserves months
- —
- Total cash needed
- —
Loan-product check · same deal, 3 products live
Conventional
25% down · 7.5% · 30yr
- Down + closing
- —
- Monthly P&I
- —
- Monthly cashflow
- —
- DSCR
- —
- Eligible?
- —
Personal DTI + credit; lowest rate.
DSCR
20% down · 8.5% · 30yr
- Down + closing
- —
- Monthly P&I
- —
- Monthly cashflow
- —
- DSCR
- —
- Eligible?
- —
No personal income docs; deal must DSCR.
Hard money
10% down · 12.0% · 12mo
- Down + closing
- —
- Monthly P&I
- —
- Monthly cashflow
- —
- DSCR
- —
- Eligible?
- —
Short-term bridge; refi at stabilization.
Rent comps 40 comps
| Address | Beds | Baths | Sqft | Rent | $/sqft | DOM | Units | Dist |
|---|---|---|---|---|---|---|---|---|
| 7030 Lone Oak Blvd Naples, FL | 3.0 | 2.0 | 1700 | $6,400 | $3.76 | 13d | 1 | 0.11mi |
| 3035 Horizon Ln #2206 Naples, FL | 2.0 | 2.0 | 1246 | $6,000 | $4.82 | 23d | 1 | 0.22mi |
| 3051 Horizon Ln #1803 Naples, FL | 2.0 | 2.0 | 1482 | $5,100 | $3.44 | 23d | 1 | 0.28mi |
| 2880 Citrus Lake Dr Unit Q201 Naples, FL | 3.0 | 2.0 | 1590 | $2,495 | $1.57 | 13d | 1 | 0.28mi |
| 2860 Citrus Lake Dr Unit R202 Naples, FL | 3.0 | 2.0 | 1590 | $5,000 | $3.14 | 23d | 1 | 0.28mi |
| 2860 Citrus Lake Dr Unit R-202 Naples, FL | 3.0 | 2.0 | 1590 | $5,000 | $3.14 | 13d | 1 | 0.28mi |
| 3048 Horizon Ln #1104 Naples, FL | 3.0 | 2.5 | 1818 | $5,150 | $2.83 | 23d | 1 | 0.30mi |
| 3015 Horizon Ln #2702 Naples, FL | 3.0 | 2.0 | 1399 | $1,790 | $1.28 | 23d | 1 | 0.32mi |
| 6654 Tannin Ln Unit B Naples, FL | 2.0 | 2.0 | 1441 | $3,100 | $2.15 | 23d | 1 | 0.33mi |
| 2731 Citrus Lake Dr #202 Naples, FL | 2.0 | 2.0 | 1260 | $2,500 | $1.98 | 13d | 1 | 0.34mi |
| 2711 Citrus Lake Dr Unit F302 Naples, FL | 2.0 | 2.0 | 1272 | $4,500 | $3.54 | 13d | 1 | 0.36mi |
| 2711 Citrus Lake Dr Unit F305 Naples, FL | 3.0 | 2.0 | 1480 | $5,500 | $3.72 | 13d | 1 | 0.36mi |
| 3009 Driftwood Way #2802 Naples, FL | 3.0 | 2.0 | 1399 | $2,000 | $1.43 | 23d | 1 | 0.38mi |
| 2671 Citrus Lake Dr Unit E-303 Naples, FL | 2.0 | 2.0 | 1380 | $3,500 | $2.54 | 13d | 1 | 0.39mi |
| 2671 Citrus Lake Dr Unit E-201 Naples, FL | 3.0 | 2.0 | 1380 | $5,250 | $3.80 | 13d | 1 | 0.39mi |
| 3017 Driftwood Way #3001 Naples, FL | 3.0 | 2.0 | 1385 | $5,000 | $3.61 | 23d | 1 | 0.40mi |
| 2651 Citrus Lake Dr Unit D302 Naples, FL | 2.0 | 2.0 | 1250 | $5,000 | $4.00 | 13d | 1 | 0.40mi |
| 2885 Citrus Lake Dr Unit N103 Naples, FL | 2.0 | 2.0 | 1249 | $5,250 | $4.20 | 13d | 1 | 0.40mi |
| 13466 Sumter Ln Naples, FL | 3.0 | 2.0 | 1837 | $8,700 | $4.74 | 23d | 1 | 0.42mi |
| 2611 Citrus Lake Dr Unit C-203 Naples, FL | 3.0 | 2.0 | 1710 | $5,500 | $3.22 | 13d | 1 | 0.43mi |
| 3057 Driftwood Way #4004 Naples, FL | 3.0 | 2.5 | 1818 | $6,400 | $3.52 | 23d | 1 | 0.43mi |
| 3062 Driftwood Way #4301 Naples, FL | 3.0 | 2.0 | 1573 | $6,500 | $4.13 | 23d | 1 | 0.44mi |
| 3025 Driftwood Way #3203 Naples, FL | 2.0 | 2.0 | 1248 | $3,900 | $3.12 | 23d | 1 | 0.44mi |
| 13441 Coronado Dr Naples, FL | 3.0 | 2.0 | 1837 | $10,000 | $5.44 | 23d | 1 | 0.45mi |
| 3029 Driftwood Way #3303 Naples, FL | 2.0 | 2.0 | 1248 | $4,000 | $3.21 | 23d | 1 | 0.46mi |
| 2864 Mizzen Way Unit Y106 Naples, FL | 2.0 | 2.0 | 1350 | $5,200 | $3.85 | 13d | 1 | 0.47mi |
| 3049 Driftwood Way #3806 Naples, FL | 3.0 | 2.5 | 1818 | $4,700 | $2.59 | 23d | 1 | 0.48mi |
| 13435 Silktail Dr Naples, FL | 2.0 | 2.0 | 1837 | $8,950 | $4.87 | 23d | 1 | 0.49mi |
| 13423 Silktail Dr Naples, FL | 2.0 | 2.0 | 1831 | $2,200 | $1.20 | 23d | 1 | 0.49mi |
| 2730 Sailors Way Naples, FL | 3.0 | 3.0 | 1700 | $9,000 | $5.29 | 23d | 1 | 0.50mi |
| 2541 Citrus Lake Dr Unit A-205 Naples, FL | 3.0 | 2.0 | 1590 | $5,250 | $3.30 | 13d | 1 | 0.50mi |
| 3037 Driftwood Way #3505 Naples, FL | 2.0 | 2.0 | 1248 | $2,500 | $2.00 | 23d | 1 | 0.51mi |
| 13379 Silktail Dr Naples, FL | 3.0 | 2.0 | 1837 | $4,400 | $2.40 | 23d | 1 | 0.53mi |
| 7710 Ahoy Ave Naples, FL | 3.0 | 2.0 | 1580 | $2,950 | $1.87 | 23d | 1 | 0.54mi |
| 2835 Mizzen Way Naples, FL | 3.0 | 2.0 | 1641 | $2,900 | $1.77 | 23d | 1 | 0.55mi |
| 2608 Sailors Way #122 Naples, FL | 2.0 | 2.0 | 1387 | $5,500 | $3.97 | 23d | 1 | 0.61mi |
| 7416 Plumbago Bridge Rd #103 Naples, FL | 2.0 | 2.0 | 1223 | $2,400 | $1.96 | 13d | 1 | 0.63mi |
| 2277 Arbour Walk Cir Naples, FL | 1.0–2.0 | 1.0–2.0 | 937 | $2,540 | $2.71 | 13d | 25 | 0.64mi |
| 2602 Fountain View Cir Naples, FL | 1.0–2.0 | 1.0–2.0 | 995 | $2,277 | $2.29 | 13d | 41 | 0.64mi |
| 2516 Orchid Bay Dr #203 Naples, FL | 2.0 | 2.0 | 1360 | $4,750 | $3.49 | 23d | 1 | 0.67mi |
HOA detail
- Monthly dues
- $343 · $4,116/yr
Listing history 18 events
-
2026-06-18days on market $479,000 Active 91 DOM
-
2026-06-17days on market $479,000 Active 90 DOM
-
2026-06-16days on market $479,000 Active 89 DOM
-
2026-06-15days on market $479,000 Active 88 DOM
-
2026-06-14days on market $479,000 Active 86 DOM
-
2026-06-10days on market $479,000 Active 83 DOM
-
2026-06-09days on market $479,000 Active 82 DOM
-
2026-06-08days on market $479,000 Active 81 DOM
-
2026-06-07days on market $479,000 Active 80 DOM
-
2026-06-03days on market $479,000 Active 76 DOM
-
2026-06-02pricedays on market $479,000 Active 75 DOM
-
2026-06-01days on market $489,000 Active 74 DOM
-
2026-05-31days on market $489,000 Active 73 DOM
-
2026-05-30days on market $489,000 Active 72 DOM
-
2026-03-19$489,000 Active
-
2001-09-18soldstatus $175,000
-
1999-09-27soldstatus $144,500
-
1996-03-01soldstatus $139,900
ⓘ Source: listings_history table (triggers on properties + properties_extension) + one-shot
backfill from property_details.listing_events for pre-trigger history.
Tax reassessment forecast FL · Resets to sale price
- Current annual tax
- $1,944 · $162/mo
- Projected year-2 tax
- $3,976 · $331/mo
- Expected delta
- +$2,032/yr (+$169/mo · 104.5%)
ⓘ Screening estimate from a state-policy table — verify with the county assessor before closing.
Climate risk First Street
- Flood 1/10 Low FEMA zone X (unshaded) · 0% chance over 30 yrs
- Wildfire 1/10 Low
- Heat 10/10 Extreme 7 d/yr ≥107°F today · 29 d/yr by 30 yrs out
- Wind 10/10 Extreme 99% chance of damaging wind over 30 yrs
- Air quality 2/10 Low 2 unhealthy d/yr today · 2 by 30 yrs out
Nearby sold comps map
Loading sold comps map…
Walkable amenities ~0.75 mi
Loading nearby amenities…
Taxation est. · year 1
- Rental income
- $56,154
- − Mortgage interest
- −$26,831
- − Property taxes
- −$1,944
- − Insurance
- −$2,395
- − Repairs & maintenance
- −$4,492
- − Management
- −$4,492
- − HOA
- −$4,116
- − Depreciation
- −$13,935
- Taxable loss
- −$2,051
- Est. tax savings @ 24.0%
- +$492
- After-tax cash flow
- $6,256/yr
For passive investors: Depreciation is non-cash, so a rental often shows a tax loss while cash-flowing — sheltering income. Rental losses are passive: they offset passive income freely, and up to $25,000/yr can offset ordinary (W-2) income if you actively participate and your MAGI is under $100k (phasing out to $0 by $150k); unused losses carry forward. On sale, claimed depreciation is recaptured at up to 25%, and gains may owe capital-gains tax (a 1031 exchange can defer both). Figures are a year-1 estimate at your 24.0% rate — not tax advice; consult a CPA.
Schools (NCES district)
- District
- Collier
- NCES district ID
- 1200330
- Math proficiency
- 60% ▼ -4.00%
- Reading proficiency
- 56% ▼ -2.00%
- Median HH income
- $58,275
- Composite
- 50.23/100
- National rank
- #1892
- State rank
- #16 of 73 in FL
Livability — Pelican Marsh
No livability data for this city. (Only ~50 U.S. cities are tracked.)
Census & demographics
- County
- Collier County · 396,295 people
- Metro
- Naples-Marco Island, FL
- Population (ZIP)
- 27,273
- Household income
- $92,259
- Rent vs Own
- Severe rent burden
- 1712.0
Population outlook (Collier County) Hauer SSP2
- Today (2025)
- 420,858 people
- By 2030
- 450,054 · +6.9%
- By 2040
- 502,232 · +19.3%
- By 2050
- 544,932 · +29.5%
- By 2075
- 627,203 · +49.0%
- By 2100
- 659,015 · +56.6%
Race, ethnicity, and origin ACS 2023
- Neighborhood character
- Predominantly White (78%)
- Race & ethnicity
- White 78% Hispanic / Latino 11% Two or more races 9% Black 4% Asian 4%
- Hispanic origin (detail)
- Mexican 1% Puerto Rican 1% Cuban 3%
- Common ancestry
- Romanian 5% Scotch-Irish 3% Lithuanian 2%
- Foreign-born
- 20% · Canada, Jamaica, Vietnam
- Languages at home
- 77% English-only · Spanish 10% Other Indo-European 5% Russian/Polish/Slavic 3%
Political lean MEDSL · Collier
- 2024 margin
- Solid R (+33.1) · D 33.1% · R 66.2%
- 2008→2024 swing
- -10.6pp toward R · 2008: -22.5pp · 2024: -33.1pp
- All cycles
- 2024: R+33.1 2020: R+24.7 2016: R+26.0 2012: R+30.1 2008: R+22.5
Not yet ingested
- Civics
- —
Market trends
- HPI YoY
- ▲ 0.29%
- Current HPI
- 279.357
- Rent YoY
- ▲ 0.92%
- Metro
- Naples-Marco Island, FL
- State GDP YoY
- ▲ 3.28%
- F500 in state
- 36
Industry mix (Fortune 500 HQ in FL)
| Industry | F500 HQs | Revenue |
|---|---|---|
| Industrial Technology | 2 | $29B |
|
||
| Insurance | 2 | $17B |
|
||
| Retail | 1 | $60B |
|
||
| Technology Distribution | 1 | $58B |
|
||
| Homebuilding | 1 | $35B |
|
||
| Technology Manufacturing | 1 | $35B |
|
||
Price history
+249.5% since first listed4 events — show timeline
- 2026-03-19 Listed $489,000 NAPLESMLS
- 2001-09-18 Sold (Public Records) $175,000 Public Records
- 1999-09-27 Sold (Public Records) $144,500 Public Records
- 1996-03-01 Sold (Public Records) $139,900 Public Records
Property tax history
+3.8%/yrLatest (2025): $1,944 · +2.6% YoY. Source: county tax records.
Cash-flow waterfall
monthlySold comps — $/sqft
last 12 mo · ≤1 miLoading sold comps…