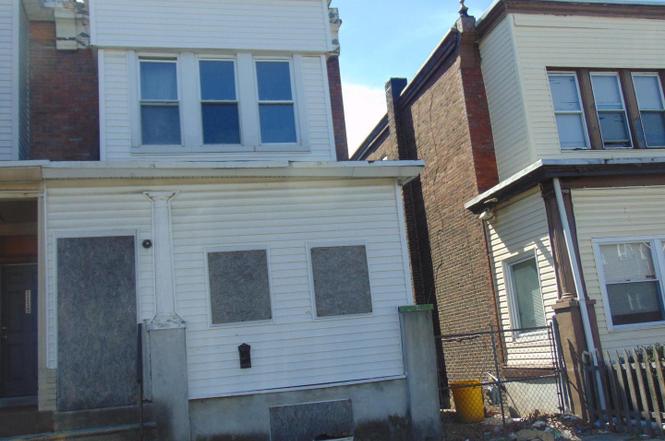
1113 Empire Ave · Camden, NJ
Flood risk 1/10 · Minimal
- FEMA flood zone
- X (unshaded)
- Chance of flooding over 30 yrs
- 0.0%
- Est. flood insurance / yr
- $507 – $1,088
Fire risk 1/10 · Minimal
- Est. fire insurance / yr
- $526 – $976
Heat risk 7/10 · Major
- Hot days now (above 103°F)
- 7 days/yr
- Hot days in 30 yrs
- 15 days/yr
Wind risk 6/10 · Moderate
- Chance of severe wind over 30 yrs
- 27.0%
Air-quality risk 4/10 · Minor
- Unhealthy air days now
- 5 days/yr
- Unhealthy air days in 30 yrs
- 6 days/yr
Risk factors via First Street. Map © Google.
Why this score? — see what drove the B grade
The composite is a weighted blend of 9 inputs, each scored 0–100. Each bar is that input's sub-score; the figure is the points it added to the 100-point composite (weight × sub-score).
- Cash flow +30.0/30.0
- 1% rule +10.0/10.0
- DSCR +10.0/10.0
- ARV discount +7.5/15.0
- Appreciation +3.8/10.0
- Livability +3.5/5.0
- Rent growth +2.5/5.0
- Condition / age +2.5/5.0
- Schools +0.7/10.0
$49,900
🖨 Deal sheet 📄 Offer letter ✓ Due diligence
Listing remarks
The house stands at a tightly packed row of aging urban homes, its once-proud facade now marred by years of neglect. The brick exterior, faded and cracked, reveals patches where mortar has crumbled away, leaving jagged gaps like missing teeth. On the first floor, grimy windows are clouded with dust and grime, their glass slightly warped from years of exposure. The wood framing around them is chipped and splintering, paint curling off in dried strips like old parchment. A sagging porch juts out from the entrance, its once-sturdy beams now brittle and warped. Rusted metal railings groan under the slightest touch, their black paint mostly eroded to reveal patches of orange corrosion. The secon
Key facts
- New roof
- Built 1920
- Listed 164 days
Tags
Neighborhood map
What this means for you Summary
Snapshot
- This is a 3-bed/1.0-bath single-family listed at $50k.
Deal economics
- At list price, monthly cash flow is $1k ($14k/yr) — positive.
- The deal already cash-flows at list — no discount required.
- Meets the 1% rule at list price ($2k rent vs $50k).
- Recommended offer: $44k (12.0% below list) — sets the bar for market timing.
- Cap rate 33.4% vs local median 7.1% in Camden — top-decile yield for the area; either an underpriced asset or a hidden risk that comps aren't pricing in. Stress-test before assuming the spread holds.
Location & tenants
- Location reads 70/100 on livability (#262 in NJ) — a middle-class / working-renter tenant base. Strengths: amenities A+, commute A+, cost of living A; Watch: schools F, crime F, employment F.
- Camden City School District (urban): math 3% / reading 16% proficiency, ranked #472 of 472 in NJ (top 100%) — low school quality limits family demand, transient renter base, plan for 1-2y turnover; 86% free/reduced lunch — lower-income household profile, screen leases tightly.
- Market conditions: 64 active listings in the ZIP; 19 comparable units currently listed for rent nearby; rentals at typical pace (median 19d on market — plan ~3-4 weeks tenant-placement turnaround); lower-income renter base — watch delinquency; 1,018 units permitted in Camden County in 2024 (509 in 5+ unit buildings).
- At $1,861/mo this rent would consume 61% of the median local household income ($37k/yr) (locally 1141% of renters already pay >50% of income on rent) — very limited rent-growth headroom before tenants either downsize or default.
Forward outlook
- Local home prices are declining (-2.4%/yr); year-one equity from $345 of loan paydown is wiped out by about $1k of value loss. Plan a longer hold.
- Camden County population projected to shrink 8% by 2050 — rents likely to lag national; underwrite the cash flow, not the appreciation.
- At projected returns (-2.4% appreciation + 3.0% rent growth), your $14k cash investment doubles in ~2 years — after that, you're playing with house money.
Negotiation context
- It's been on market 164 days — a 12% lower offer ($44k) is reasonable based on typical stale-listing flexibility.
- 10 sale attempts since 25y ago; this cycle's ask has dropped $39k (44%) from the opening price — seller is motivated, your offer sets the floor, not the list.
Risks & watch-outs
- Watch-outs: built in 1920 — expect roof / HVAC / electrical / plumbing capex.
- Climate carrying-cost: major wind risk, 27% chance of damaging wind over 30y; extreme-heat days projected 7→15/yr by 2055 (HVAC capex compounding) — expect insurance premiums to compound above CPI over the hold.
Questions for the listing agent
- It's been on market 164 days. Have you received any prior offers? Is the seller open to a 12% concession, seller financing, or rate buy-down credit?
- Built in 1920 — when were the roof, HVAC, electrical panel, plumbing, and water heater last replaced?
- Why hasn't it sold? Are there any deal-killer items the seller is aware of (foundation, flood, title, zoning, code violations)?
- Is there a deadline driving the sale (1031 exchange, divorce, estate, relocation)? That informs how much negotiation room exists.
- Schools are F-rated, which usually means shorter tenancies and higher turnover. Who's the typical renter profile here, and what's been the actual vacancy rate?
- Crime grade is F in this area — have there been break-ins, vandalism, or insurance claims at this property in the last 3 years? What carrier currently insures it and at what premium?
- What's the average days-on-market for RENTAL listings here right now (not sales)? A rising rental-DOM trend means longer vacancies and softer asking-rent achievability than the comps imply.
- What's the recent tenant-quality profile in this submarket — average credit score on applications, eviction rate, late-payment / NSF rate, and stable-employment percentage? A property-management company in the area should have these aggregated.
- How much new for-sale + rental construction is in the pipeline within 1–3 miles? Heavy new supply typically softens prices + rents 12–24 months out; constrained supply supports both.
Investment metrics
- 1% rule
- 3.73% ✓
- Cap rate
- 33.36%
- Cash-on-cash
- 96.67%
- DSCR
- 5.30
- GRM
- 2.2
CMA / ARV
- ARV (on-the-fly)
- $181,263
- Comps found
- 12
Show comp detail 12 sales within ~0.75 mi
| Address | Dist | Beds/Ba | Sqft | Sold | Price | $/sf | Match |
|---|---|---|---|---|---|---|---|
| 1114 Langham Ave | 0.02mi | 4/1.5 (+1) | 1,688 (+3%) | 0mo | $305,000 | $181 | 86 |
| 1353 Park Blvd | 0.10mi | 4/1.0 (+1) | 1,638 (+0%) | 15mo | $210,000 | $128 | 78 |
| 1243 Magnolia Ave | 0.16mi | 3/1.0 | 1,460 (-11%) | 6mo | $115,000 | $79 | 70 |
| 1553 Wildwood Ave | 0.14mi | 3/2.0 | 1,440 (-12%) | 10mo | $128,000 | $89 | 62 |
| 1460 Belleview Ave | 0.32mi | 3/1.0 | 1,483 (-9%) | 12mo | $194,000 | $131 | 59 |
| 1128 Everett St | 0.58mi | 3/1.5 | 1,575 (-4%) | 12mo | $175,000 | $111 | 55 |
| 1240 Chase Street St S | 0.68mi | 4/1.5 (+1) | 1,500 (-8%) | 2mo | $143,000 | $95 | 46 |
| 1306 Thurman St | 0.58mi | 3/1.0 | 1,398 (-14%) | 4mo | $140,000 | $100 | 45 |
| 1340 Atlantic Ave | 0.40mi | 3/1.0 | 1,472 (-10%) | 24mo | $165,000 | $112 | 45 |
| 634 Walnut St | 0.73mi | 3/2.0 | 1,462 (-10%) | 8mo | $225,000 | $154 | 38 |
| 1466 Kenwood Ave | 0.47mi | 3/2.5 | 1,872 (+15%) | 23mo | $129,000 | $69 | 29 |
| 820 Atlantic Ave | 0.64mi | 4/1.5 (+1) | 1,480 (-9%) | 24mo | $60,000 | $41 | 27 |
Match score weights: distance 35% · size 25% · config 20% · recency 20%. Top-matched comps best support the ARV.
Projected returns pro-forma
-2.36% appreciation · 3.0% rent growth · sell at horizon
- IRR
- 98.0%
- Equity multiple
- 5.65×
- Total profit
- $64,986
- Equity at exit
- $8,880
- IRR
- —
- Equity multiple
- 11.75×
- Total profit
- $150,200
- Equity at exit
- $6,829
Cash invested: $13,972 (down + closing). Projections, not guarantees.
Landlord ↔ Tenant lean methodology
- Overall (STATE)
- 21 Tenant-Leaning
- State New Jersey
- 21 Tenant-Leaning · D+6
- County
- — inherits STATE
- City
- — inherits STATE
ZIP-level market 08103
- Home prices YoY
- -1.4%
- Active inventory
- 64
- Price-to-rent
- 2.2×
Monthly cashflow live
- Estimated rent
- $1,861 high interval (Pro) →
- Mortgage (P&I)
- −$262
- Tax est. 1.5%
- −$62 /mo · $748/yr
- Insurance
- −$21
- HOA
- −$0
- Vacancy / Maint / Mgmt
- −$391
- Net cashflow
- $1,126
Break-even live
UW: 25.0% down · 7.5% · 30yr · 1.5% tax · 5.0% vac · 8.0% maint · 8.0% mgmt
Financing live
Cash to close
- Down payment
- $12,475
- Closing costs
- $1,497
- Reserves months
- —
- Total cash needed
- —
Loan-product check · same deal, 3 products live
Conventional
25% down · 7.5% · 30yr
- Down + closing
- —
- Monthly P&I
- —
- Monthly cashflow
- —
- DSCR
- —
- Eligible?
- —
Personal DTI + credit; lowest rate.
DSCR
20% down · 8.5% · 30yr
- Down + closing
- —
- Monthly P&I
- —
- Monthly cashflow
- —
- DSCR
- —
- Eligible?
- —
No personal income docs; deal must DSCR.
Hard money
10% down · 12.0% · 12mo
- Down + closing
- —
- Monthly P&I
- —
- Monthly cashflow
- —
- DSCR
- —
- Eligible?
- —
Short-term bridge; refi at stabilization.
Rent comps 19 comps
| Address | Beds | Baths | Sqft | Rent | $/sqft | DOM | Units | Dist |
|---|---|---|---|---|---|---|---|---|
| 1455 Wildwood Ave Camden, NJ | 3.0 | 1.5 | 1353 | $1,900 | $1.40 | 10d | 1 | 0.07mi |
| 1055 Kenwood Ave Camden, NJ | 4.0 | 1.0 | 1088 | $1,875 | $1.72 | 24d | 1 | 0.11mi |
| 1509 Park Blvd Camden, NJ | 1.0–2.0 | 1.0 | 1075 | $1,650 | $1.53 | 24d | 1 | 0.12mi |
| 840 Haddon Ave Unit A Camden, NJ | 2.0 | 1.0 | 2032 | $1,725 | $0.85 | 24d | 1 | 0.35mi |
| 537 Newton Ave Camden, NJ | 2.0 | 1.0 | 1092 | $1,500 | $1.37 | 19d | 1 | 0.66mi |
| 537 Newton Ave Camden, NJ | 2.0 | 1.0 | 1092 | $1,500 | $1.37 | 13d | 1 | 0.66mi |
| 1502 S 9th St Camden, NJ | 2.0 | 1.0 | 1050 | $1,475 | $1.40 | 19d | 1 | 0.69mi |
| 708 Royden St Camden, NJ | 3.0 | 1.0 | 1113 | $1,595 | $1.43 | 17d | 1 | 0.69mi |
| 264 Boyd St Unit B Camden, NJ | 2.0 | 1.0 | 1616 | $1,700 | $1.05 | 24d | 1 | 0.87mi |
| 457 Mechanic St Camden, NJ | 3.0 | 2.0 | 1200 | $1,950 | $1.62 | 19d | 1 | 0.99mi |
| 609 Henry St Camden, NJ | 3.0 | 1.0 | 1290 | $1,600 | $1.24 | 24d | 1 | 1.01mi |
| 440 Henry St Camden, NJ | 3.0 | 1.5 | 1224 | $2,200 | $1.80 | 24d | 1 | 1.03mi |
| 324 S 27th St Camden, NJ | 3.0 | 1.0 | 1152 | $1,900 | $1.65 | 24d | 1 | 1.17mi |
| 2752 Mickle St Camden, NJ | 3.0 | 1.0 | 1450 | $1,850 | $1.28 | 17d | 1 | 1.19mi |
| 209 Cedar Ave Oaklyn, NJ | 2.0 | 1.0 | 1400 | $1,800 | $1.29 | 5d | 1 | 1.26mi |
| 209 Cedar Ave Oaklyn, NJ | 2.0 | 1.0 | 1400 | $1,500 | $1.07 | 17d | 1 | 1.26mi |
| 380 Garden Ave Camden, NJ | 2.0 | 2.0 | 1184 | $2,100 | $1.77 | 24d | 1 | 1.39mi |
| 221 Haddon Ave Collingswood, NJ | 4.0 | 2.0 | 1744 | $3,100 | $1.78 | 3d | 1 | 1.42mi |
| 225 Haddon Ave Collingswood, NJ | 2.0 | 2.0 | 1211 | $3,372 | $2.78 | 1d | 6 | 1.44mi |
Listing history 25 events
-
2026-04-27status Pending
-
2026-03-17price $49,900
-
2025-11-14$89,000 Active
-
2025-04-21historical
-
2025-04-15status Active
-
2025-03-24status Pending
-
2025-03-19$39,900 Active
-
2017-03-08historical
-
2016-10-19$30,000
-
2014-08-30historical
-
2013-08-30$49,000
-
2013-03-21historical
-
2012-03-21$59,000
-
2012-02-18historical
-
2011-08-18$79,000
-
2007-09-28historical
-
2006-09-07$119,911
-
2005-08-11soldstatus $55,000
-
2005-07-29soldstatus $55,000
-
2005-04-30$55,000
-
2003-11-03soldstatus $45,200
-
2003-08-28historical
-
2001-09-01$45,000
-
1988-05-23soldstatus $31,300
-
1979-06-01soldstatus $12,000
ⓘ Source: listings_history table (triggers on properties + properties_extension) + one-shot
backfill from property_details.listing_events for pre-trigger history.
Climate risk First Street
- Flood 1/10 Low FEMA zone X (unshaded) · 0% chance over 30 yrs
- Wildfire 1/10 Low
- Heat 7/10 Severe 7 d/yr ≥103°F today · 15 d/yr by 30 yrs out
- Wind 6/10 Major 27% chance of damaging wind over 30 yrs
- Air quality 4/10 Moderate 5 unhealthy d/yr today · 6 by 30 yrs out
Nearby sold comps map
Loading sold comps map…
Walkable amenities ~0.75 mi
Loading nearby amenities…
Taxation est. · year 1
- Rental income
- $22,336
- − Mortgage interest
- −$2,795
- − Property taxes
- −$748
- − Insurance
- −$250
- − Repairs & maintenance
- −$1,787
- − Management
- −$1,787
- − Depreciation
- −$1,452
- Taxable income
- $13,517
- Est. tax owed @ 24.0%
- −$3,244
- After-tax cash flow
- $10,263/yr
For passive investors: Depreciation is non-cash, so a rental often shows a tax loss while cash-flowing — sheltering income. Rental losses are passive: they offset passive income freely, and up to $25,000/yr can offset ordinary (W-2) income if you actively participate and your MAGI is under $100k (phasing out to $0 by $150k); unused losses carry forward. On sale, claimed depreciation is recaptured at up to 25%, and gains may owe capital-gains tax (a 1031 exchange can defer both). Figures are a year-1 estimate at your 24.0% rate — not tax advice; consult a CPA.
Schools (NCES district)
- District
- Camden City School District
- NCES district ID
- 3402640
- Math proficiency
- 3% ▼ -6.00%
- Reading proficiency
- 16% ▬ 0.00%
- Median HH income
- $25,845
- Composite
- 6.85/100
- National rank
- #9981
- State rank
- #472 of 472 in NJ
Livability — Camden
- Score
- 70/100
- State rank
- #262
- US rank
- #7721
Category grades
Schools grade is shown separately in the Schools card above.
Census & demographics
- Census place
- Camden, NJ
- County
- Camden County · 407,624 people
- City population
- 20,865
- Metro
- Philadelphia-Camden-Wilmington, PA-NJ-DE-MD
- Population (ZIP)
- 12,573
- Household income
- $36,793
- Rent vs Own
- Severe rent burden
- 1141.0
Population outlook (Camden County) Hauer SSP2
- Today (2025)
- 507,964 people
- By 2030
- 502,182 · -1.1%
- By 2040
- 485,602 · -4.4%
- By 2050
- 465,630 · -8.3%
- By 2075
- 419,986 · -17.3%
- By 2100
- 369,492 · -27.3%
Race, ethnicity, and origin ACS 2023
- Neighborhood character
- Diverse neighborhood (Simpson 0.57)
- Race & ethnicity
- Black 54% Hispanic / Latino 36% Two or more races 9% White 5% Asian 1%
- Hispanic origin (detail)
- Mexican 4% Puerto Rican 19% Dominican 4%
- Common ancestry
- Hispanic 1%
- Foreign-born
- 12% · Canada, Jamaica
- Languages at home
- 75% English-only · Spanish 22% Tagalog/Filipino 2%
Political lean MEDSL · Camden
- 2024 margin
- Strong D (+27.4) · D 63.0% · R 35.5% · Other 1.5%
- 2008→2024 swing
- -8.8pp toward R · 2008: 36.2pp · 2024: 27.4pp
- All cycles
- 2024: D+27.4 2020: D+33.5 2016: D+32.4 2012: D+36.6 2008: D+36.2
Not yet ingested
- Civics
- —
Market trends
- HPI YoY
- ▼ -2.36%
- Current HPI
- 162.557
- Rent YoY
- —
- Metro
- Philadelphia-Camden-Wilmington, PA-NJ-DE-MD
- State GDP YoY
- ▲ 2.05%
- F500 in state
- 34
Industry mix (Fortune 500 HQ in NJ)
| Industry | F500 HQs | Revenue |
|---|---|---|
| Consumer Goods | 3 | $31B |
|
||
| Pharmaceuticals | 2 | $153B |
|
||
| Technology | 2 | $21B |
|
||
| Insurance | 2 | $20B |
|
||
| Healthcare | 2 | $19B |
|
||
| Financial Services | 1 | $70B |
|
||
Price history
+315.8% since first listed25 events — show timeline
- 2026-04-27 Pending — BRIGHT MLS
- 2026-03-17 Price Changed $49,900 BRIGHT MLS
- 2025-11-14 Listed $89,000 BRIGHT MLS
- 2025-04-21 Listing Removed — BRIGHT MLS
- 2025-04-15 Relisted — BRIGHT MLS
- 2025-03-24 Pending — BRIGHT MLS
- 2025-03-19 Listed $39,900 BRIGHT MLS
- 2017-03-08 Listing Removed — BRIGHT MLS
- 2016-10-19 Listed $30,000 BRIGHT MLS
- 2014-08-30 Listing Removed — BRIGHT MLS
- 2013-08-30 Listed $49,000 BRIGHT MLS
- 2013-03-21 Listing Removed — BRIGHT MLS
- 2012-03-21 Listed $59,000 BRIGHT MLS
- 2012-02-18 Listing Removed — BRIGHT MLS
- 2011-08-18 Listed $79,000 BRIGHT MLS
- 2007-09-28 Listing Removed — BRIGHT MLS
- 2006-09-07 Listed $119,911 BRIGHT MLS
- 2005-08-11 Sold (Public Records) $55,000 Public Records
- 2005-07-29 Sold (MLS) $55,000 BRIGHT MLS
- 2005-04-30 Listed $55,000 BRIGHT MLS
- 2003-11-03 Sold (Public Records) $45,200 Public Records
- 2003-08-28 Listing Removed — BRIGHT MLS
- 2001-09-01 Listed $45,000 BRIGHT MLS
- 1988-05-23 Sold (Public Records) $31,300 Public Records
- 1979-06-01 Sold (Public Records) $12,000 Public Records
Property tax history
+3.9%/yrLatest (2025): $2,972 · +4.1% YoY. Source: county tax records.
Cash-flow waterfall
monthlySold comps — $/sqft
last 12 mo · ≤1 miLoading sold comps…