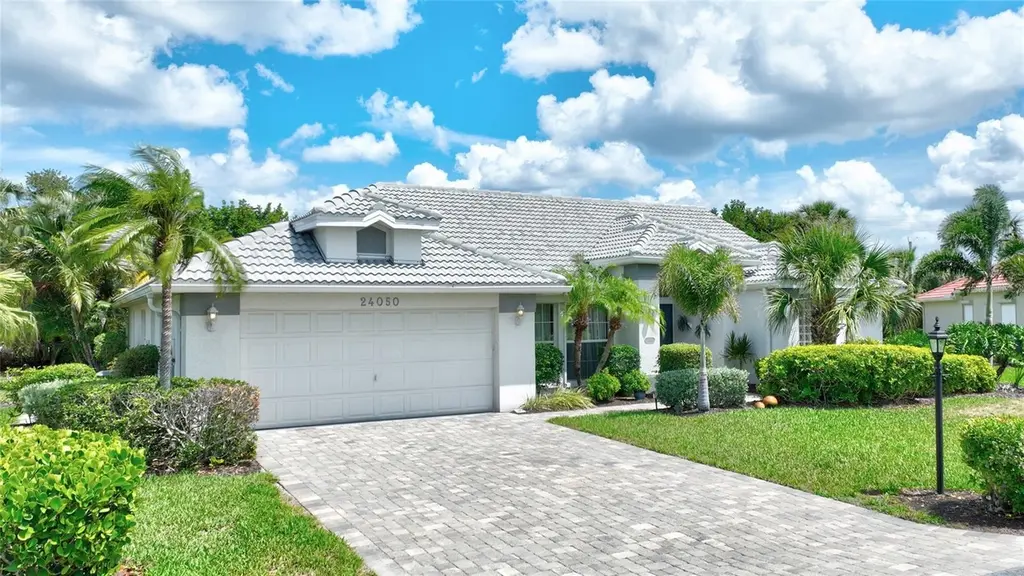
24050 Redfish Cove Dr · Burnt Store Marina, FL
Flood risk 9/10 · Severe
- FEMA flood zone
- AE
- Chance of flooding over 30 yrs
- 0.99%
- Est. flood insurance / yr
- $1,737 – $8,500
Fire risk 4/10 · Minor
- Est. fire insurance / yr
- $947 – $1,759
Heat risk 10/10 · Severe
- Hot days now (above 107°F)
- 7 days/yr
- Hot days in 30 yrs
- 31 days/yr
Wind risk 10/10 · Severe
- Chance of severe wind over 30 yrs
- 99.0%
Air-quality risk 3/10 · Minor
- Unhealthy air days now
- 2 days/yr
- Unhealthy air days in 30 yrs
- 2 days/yr
Risk factors via First Street. Map © Google.
Why this score? — see what drove the D+ grade
The composite is a weighted blend of 9 inputs, each scored 0–100. Each bar is that input's sub-score; the figure is the points it added to the 100-point composite (weight × sub-score).
- Cash flow +17.7/30.0
- ARV discount +7.5/15.0
- DSCR +5.5/10.0
- 1% rule +5.3/10.0
- Schools +4.1/10.0
- Livability +3.6/5.0
- Rent growth +2.5/5.0
- Condition / age +2.5/5.0
- Appreciation +0.0/10.0
$475,000
🖨 Deal sheet (PDF) 📄 Offer letter ✓ Due diligence
Listing remarks
TIRED OF CONDO LIVING SPREAD OUT IN THIS ESTATE PROPERTY. This is the much sought after 3 full bedroom Regatta Estate Home with a two car garage. This home features a split floor plan, formal dining area, a master suite that opens to the huge lanai. Also, a large master bath with dual vanities, walk in shower and a garden tub. The home has exquisite mature landscaping. This is the Grand-Daddy of the WCI Estate Homes. Call today for an appointment to view this magnificent one owner home. The marina features a 27 hole golf course, multiple restaurants, an activity and recreation center, tennis courts, and much more. Come and enjoy what others dream of. .. ..
Key facts
- Master suite
- Dual vanities
- Split floor plan
Tags
Property features AI
Finance
- Other: Furnished; Private marina access with boat ramp, fishing pier, no-wake zone, sailboat water, concrete seawall; bridges: no fixed bridges
- Financial info: Lease restrictions apply
- HOA & community: HOA managed by Alliant Property Management; HOA required with annual association fee ($1,045) and monthly HOA amount ($87.08); Monthly condo fee $475 (if applicable); Community amenities: pool, fitness center, tennis courts, dog park; Deed restrictions and special community restrictions; Pets allowed (cats and dogs)
Exterior
- Parking: Attached 2-car garage (20 x 21)
- Security: Gated community
- Utilities: Public water; Public sewer; Electricity connected; Cable available; Phone available; Broadband/high-speed internet available; Sprinkler recycled; Water connected; Sewer connected
- Home design: Single-family residence; One story; Faces east; Located in a gated community
- Construction: Block and stucco construction; Tile roof; Slab foundation; Built on 0.15 acre lot; Asphalt road access
- Exterior features: Balcony; Sliding doors; Hurricane shutters; Sprinkler meter
Interior
- Kitchen: Cooktop; Dishwasher; Disposal; Microwave
- Bedrooms: 3 bedrooms
- Flooring: Carpet; Ceramic tile
- Bathrooms: 2 full bathrooms
- Heating & cooling: Electric heating; Central air conditioning
- Interior features: Cathedral ceilings; Vaulted ceilings; Ceiling fans; Open floorplan; Eat-in kitchen; Split bedroom layout; Walk-in closets; Window treatments (blinds, drapes)
- Laundry & utility: Laundry room; Washer; Dryer
Neighborhood map
What this means for you Summary
Snapshot
- This is a 3-bed/3.0-bath condo listed at $475k.
Deal economics
- At list price, monthly cash flow is $-47 ($-565/yr) — negative.
- To cash-flow at today's rent, offer at most $467k (1.8% below list).
- Meets the 1% rule at list price ($5k rent vs $475k).
- Recommended offer: $467k (1.8% below list) — sets the bar for cash-flow.
- Cap rate 7.3% vs local median 4.8% in Burnt Store Marina — top-decile yield for the area; either an underpriced asset or a hidden risk that comps aren't pricing in. Stress-test before assuming the spread holds.
Location & tenants
- Location reads 72/100 on livability (#354 in FL) — a middle-class / working-renter tenant base. Strengths: crime A+, employment A+, housing A+; Watch: cost of living C-, amenities F, commute F.
- Lee (suburban): math 47% / reading 50% proficiency, ranked #42 of 73 in FL (top 58%) — families likely to look elsewhere, expect single-tenant / working-renter base with shorter leases.
- Zoned schools: Gulf Elementary School (math 70% / reading 65%, grade B+, #435 of 2,144 statewide, top 21%, 1,231 students, 38% FRL); Challenger Middle School (math 59% / reading 56%, grade B, #157 of 571 statewide, top 28%, 1,124 students, 50% FRL); Ida S. Baker High School (math 44% / reading 47%, grade D-, #223 of 667 statewide, top 34%, 1,933 students, 39% FRL) — zoned schools average 42% FRL vs 57% district-wide (15 pts lower); this property's tenant base skews higher-income than the district average.
- Market conditions: 1490 active listings in the ZIP; 19 comparable units currently listed for rent nearby; rentals at typical pace (median 26d on market — plan ~3-4 weeks tenant-placement turnaround); solid renter incomes; 15,411 units permitted in Lee County in 2024 (4,686 in 5+ unit buildings).
- At $4,906/mo this rent would consume 77% of the median local household income ($77k/yr) (locally 226% of renters already pay >50% of income on rent) — very limited rent-growth headroom before tenants either downsize or default.
Forward outlook
- Local home prices are declining (-3.0%/yr); year-one equity from $3k of loan paydown is wiped out by about $14k of value loss. Plan a longer hold.
- Lee County population projected at +44% by 2050 — long-run rental-demand tailwind backs the buy-and-hold thesis.
Negotiation context
- It's been on market 24 days — a 2% lower offer ($468k) is reasonable based on typical stale-listing flexibility.
- 3 sale attempts since 21y ago with the ask held roughly flat each time — persistent listings suggest the price (not the market) is what's stuck; bring a comps-based counter.
- Current owner paid $194k; list at $475k implies a 145% gain — meaningful room to come down on a strong offer.
Risks & watch-outs
- Watch-outs: flood insurance adds $427/mo.
- Climate carrying-cost: in FEMA flood zone AE (mandatory federal flood insurance); severe wind risk, 99% chance of damaging wind over 30y; extreme-heat days projected 7→31/yr by 2055 (HVAC capex compounding) — expect insurance premiums to compound above CPI over the hold.
Questions for the listing agent
- What do current leases actually rent for vs. the listed asking? Can we see a recent rent roll and the last 12 months of T-12 income?
- What's the actual annual flood-insurance premium (NFIP or private), and is the property in a SFHA with mandatory coverage?
- What does the HOA fee cover, when was the last increase, and are there any pending special assessments or reserve-fund shortfalls?
- Any open or pending special assessments — roof, HVAC, plumbing, elevator, façade? What's the per-unit balance and payoff schedule, and is the seller paying it off at close or rolling it to the buyer?
- Is there a deadline driving the sale (1031 exchange, divorce, estate, relocation)? That informs how much negotiation room exists.
- The area grade is low — what's the realistic commute time and amenity access for the typical tenant pool here? Any planned neighborhood developments (good or bad) we should know about?
- What's the average days-on-market for RENTAL listings here right now (not sales)? A rising rental-DOM trend means longer vacancies and softer asking-rent achievability than the comps imply.
- What's the recent tenant-quality profile in this submarket — average credit score on applications, eviction rate, late-payment / NSF rate, and stable-employment percentage? A property-management company in the area should have these aggregated.
- How much new apartment / multifamily construction is in the pipeline within 1–3 miles? Heavy new supply (>2% of stock underway) typically softens rents 12–24 months out; light construction supports rent growth.
Investment metrics
- 1% rule
- 1.03% ✓
- Cap rate
- 7.25%
- Cash-on-cash
- 3.42%
- DSCR
- 1.15
- GRM
- 8.1
CMA / ARV
No comps found within radius.
Projected returns pro-forma
-3.0% appreciation · 3.0% rent growth · sell at horizon
- IRR
- -16.9%
- Equity multiple
- 0.40×
- Total profit
- $-79,504
- Equity at exit
- $70,824
- IRR
- -8.5%
- Equity multiple
- 0.46×
- Total profit
- $-71,196
- Equity at exit
- $41,069
Cash invested: $133,000 (down + closing). Projections, not guarantees.
Landlord ↔ Tenant lean methodology
- Overall (STATE)
- 87 Strongly Landlord-Friendly
- State Florida
- 87 Strongly Landlord-Friendly · R+3
- County
- — inherits STATE
- City
- — inherits STATE
ZIP-level market 33955
- Home prices YoY
- -24.5%
- Active inventory
- 1490
- Price-to-rent
- 8.1×
Monthly cashflow live
- Estimated rent
- $4,906 high interval (Pro) →
- Mortgage (P&I)
- −$2,491
- Tax from tax record
- −$246 /mo · $2,949/yr
- Insurance
- −$198
- Flood insurance flood zone
- −$427 /mo · $5,118/yr
- HOA
- −$562
- Vacancy / Maint / Mgmt
- −$1,030
- Net cashflow
- $-47
Break-even live
Sensitivity live
| Price | -10% $222 | -5% $87 | +0% $-47 | +5% $-182 | +10% $-316 |
|---|---|---|---|---|---|
| Rent | -10% $-435 | -5% $-241 | +0% $-47 | +5% $147 | +10% $340 |
| Rate | -1.0pp $192 | -0.5pp $74 | base $-47 | +0.5pp $-170 | +1.0pp $-295 |
UW: 25.0% down · 7.5% · 30yr · 1.5% tax · 5.0% vac · 8.0% maint · 8.0% mgmt
Financing live
Cash to close
- Down payment
- $118,750
- Closing costs
- $14,250
- Reserves months
- —
- Total cash needed
- —
Loan-product check · same deal, 3 products live
Conventional
25% down · 7.5% · 30yr
- Down + closing
- —
- Monthly P&I
- —
- Monthly cashflow
- —
- DSCR
- —
- Eligible?
- —
Personal DTI + credit; lowest rate.
DSCR
20% down · 8.5% · 30yr
- Down + closing
- —
- Monthly P&I
- —
- Monthly cashflow
- —
- DSCR
- —
- Eligible?
- —
No personal income docs; deal must DSCR.
Hard money
10% down · 12.0% · 12mo
- Down + closing
- —
- Monthly P&I
- —
- Monthly cashflow
- —
- DSCR
- —
- Eligible?
- —
Short-term bridge; refi at stabilization.
Rent comps 19 comps
| Address | Beds | Baths | Sqft | Rent | $/sqft | DOM | Units | Dist |
|---|---|---|---|---|---|---|---|---|
| 17849 Hibiscus Cove Ct #1 Punta Gorda, FL | 3.0 | 2.0 | 1937 | $6,250 | $3.23 | 25d | 1 | 0.26mi |
| 2060 Matecumbe Key Rd Punta Gorda, FL | 2.0–3.0 | 2.0 | 1271 | $5,400 | $4.25 | 25d | 3 | 0.41mi |
| 3255 Sugarloaf Key Rd Unit 31B Punta Gorda, FL | 2.0 | 2.0 | 1516 | $3,000 | $1.98 | 18d | 1 | 0.45mi |
| 1610 Islamorada Blvd Unit 64A Punta Gorda, FL | 2.0 | 2.0 | 1516 | $2,000 | $1.32 | 25d | 1 | 0.51mi |
| 3471 Sunset Key Cir #102 Punta Gorda, FL | 3.0 | 2.0 | 1991 | $5,750 | $2.89 | 25d | 1 | 0.56mi |
| 4005 Big Pass Ln Punta Gorda, FL | 2.0 | 2.0 | 1423 | $5,500 | $3.87 | 18d | 1 | 0.62mi |
| 5 Pirates Ln Unit 54B Punta Gorda, FL | 2.0 | 2.0 | 1516 | $4,600 | $3.03 | 25d | 1 | 0.62mi |
| 17314 Cape Horn Blvd Punta Gorda, FL | 3.0 | 2.0 | 2216 | $2,800 | $1.26 | 15d | 1 | 0.64mi |
| 17434 Oro Ct Punta Gorda, FL | 3.0 | 2.5 | 1864 | $2,000 | $1.07 | 23d | 1 | 0.65mi |
| 3304 Sunset Key Cir Unit D Punta Gorda, FL | 3.0 | 2.0 | 2255 | $5,750 | $2.55 | 25d | 1 | 0.66mi |
| 3313 Sunset Key Cir Punta Gorda, FL | 3.0 | 2.0–3.0 | 2089 | $6,750 | $3.23 | 25d | 4 | 0.69mi |
| 3313 Sunset Key Cir Unit Reservation spot 1 Punta Gorda, FL | 2.0 | 2.0 | 2099 | $2,750 | $1.31 | 25d | 1 | 0.69mi |
| 24417 Baltic Ave #1102 Punta Gorda, FL | 2.0 | 2.0 | 1788 | $5,250 | $2.94 | 25d | 1 | 0.70mi |
| 1010 Islamorada Blvd Punta Gorda, FL | 3.0 | 2.0 | 1592 | $4,700 | $2.95 | 25d | 1 | 0.70mi |
| 3270 Southshore Dr Unit 72B Punta Gorda, FL | 3.0 | 2.0 | 2069 | $5,750 | $2.78 | 25d | 1 | 0.81mi |
| 3250 Southshore Dr Unit 54B Punta Gorda, FL | 3.0 | 2.0 | 2069 | $5,750 | $2.78 | 25d | 1 | 0.81mi |
| 3280 Southshore Dr Unit 87A Punta Gorda, FL | 3.0 | 2.0 | 2069 | $4,000 | $1.93 | 25d | 1 | 0.85mi |
| 2091 King Tarpon Dr Punta Gorda, FL | 3.0 | 2.0 | 1640 | $5,200 | $3.17 | 25d | 1 | 0.96mi |
| 3001 King Tarpon Dr Punta Gorda, FL | 3.0 | 2.0 | 1734 | $5,500 | $3.17 | 25d | 1 | 0.96mi |
HOA detail condo
- Monthly dues
- $562 · $6,744/yr
- Likely covers
- landscaping
- Assessments
- None detected in remarks — confirm with the listing agent.
Listing history 14 events
-
2026-06-22days on market $475,000 Active 24 DOM
-
2026-06-18days on market $475,000 Active 21 DOM
-
2026-06-17days on market $475,000 Active 20 DOM
-
2026-06-16days on market $475,000 Active 19 DOM
-
2026-06-15days on market $475,000 Active 18 DOM
-
2026-06-13days on market $475,000 Active 16 DOM
-
2026-06-10days on market $475,000 Active 13 DOM
-
2026-06-09days on market $475,000 Active 12 DOM
-
2026-06-08days on market $475,000 Active 11 DOM
-
2026-06-07days on market $475,000 Active 10 DOM
-
2026-06-03days on market $475,000 Active 6 DOM
-
2026-06-02days on market $475,000 Active 5 DOM
-
2026-06-01days on market $475,000 Active 4 DOM
-
2026-05-31days on market $475,000 Active 3 DOM
ⓘ Source: listings_history table (triggers on properties + properties_extension) + one-shot
backfill from property_details.listing_events for pre-trigger history.
Tax reassessment forecast FL · Resets to sale price
- Current annual tax
- $2,949 · $246/mo
- Projected year-2 tax
- $3,942 · $329/mo
- Expected delta
- +$993/yr (+$83/mo · 33.7%)
ⓘ Screening estimate from a state-policy table — verify with the county assessor before closing.
Climate risk First Street
- Flood 9/10 Extreme FEMA zone AE · 99% chance over 30 yrs
- Wildfire 4/10 Moderate
- Heat 10/10 Extreme 7 d/yr ≥107°F today · 31 d/yr by 30 yrs out
- Wind 10/10 Extreme 99% chance of damaging wind over 30 yrs
- Air quality 3/10 Moderate 2 unhealthy d/yr today · 2 by 30 yrs out
Nearby sold comps map
Loading sold comps map…
Walkable amenities ~0.75 mi
Loading nearby amenities…
Taxation est. · year 1
- Rental income
- $58,877
- − Mortgage interest
- −$26,607
- − Property taxes
- −$2,949
- − Insurance
- −$7,494
- − Repairs & maintenance
- −$4,710
- − Management
- −$4,710
- − HOA
- −$6,744
- − Depreciation
- −$13,818
- Taxable loss
- −$8,156
- Est. tax savings @ 24.0%
- +$1,957
- After-tax cash flow
- $1,392/yr
For passive investors: Depreciation is non-cash, so a rental often shows a tax loss while cash-flowing — sheltering income. Rental losses are passive: they offset passive income freely, and up to $25,000/yr can offset ordinary (W-2) income if you actively participate and your MAGI is under $100k (phasing out to $0 by $150k); unused losses carry forward. On sale, claimed depreciation is recaptured at up to 25%, and gains may owe capital-gains tax (a 1031 exchange can defer both). Figures are a year-1 estimate at your 24.0% rate — not tax advice; consult a CPA.
Schools (NCES district)
- District
- Lee
- NCES district ID
- 1201080
- Math proficiency
- 47% ▼ -11.00%
- Reading proficiency
- 50% ▼ -4.00%
- Median HH income
- $49,518
- Composite
- 41.49/100
- National rank
- #3458
- State rank
- #42 of 73 in FL
Livability — Burnt Store Marina
- Score
- 72/100
- State rank
- #354
- US rank
- #6145
Category grades
Schools grade is shown separately in the Schools card above.
Census & demographics
- Census place
- Burnt Store Marina, FL
- County
- Charlotte County · 196,994 people
- Metro
- Punta Gorda, FL
- Population (ZIP)
- 12,399
- Household income
- $76,943
- Rent vs Own
- Severe rent burden
- 226.0
Population outlook (Lee County) Hauer SSP2
- Today (2025)
- 871,946 people
- By 2030
- 955,468 · +9.6%
- By 2040
- 1,113,587 · +27.7%
- By 2050
- 1,256,891 · +44.1%
- By 2075
- 1,560,270 · +78.9%
- By 2100
- 1,726,848 · +98.0%
Race, ethnicity, and origin ACS 2023
- Neighborhood character
- Predominantly White (84%)
- Race & ethnicity
- White 84% Hispanic / Latino 10% Two or more races 9% Black 2%
- Hispanic origin (detail)
- Mexican 4% Puerto Rican 2% Cuban 4%
- Common ancestry
- Romanian 5% Italian 3% Serbian 3%
- Foreign-born
- 8% · Canada
- Languages at home
- 91% English-only · Spanish 5% Other Indo-European 1%
Political lean MEDSL · Lee
- 2024 margin
- Strong R (+28.4) · D 35.5% · R 63.9%
- 2008→2024 swing
- -18.0pp toward R · 2008: -10.4pp · 2024: -28.4pp
- All cycles
- 2024: R+28.4 2020: R+19.2 2016: R+20.4 2012: R+16.6 2008: R+10.4
Not yet ingested
- Civics
- —
Market trends
- HPI YoY
- ▼ -78.71%
- Current HPI
- 242.9043
- Rent YoY
- —
- Metro
- Punta Gorda, FL
- State GDP YoY
- ▲ 3.28%
- F500 in state
- 36
Industry mix (Fortune 500 HQ in FL)
| Industry | F500 HQs | Revenue |
|---|---|---|
| Industrial Technology | 2 | $29B |
|
||
| Insurance | 2 | $17B |
|
||
| Retail | 1 | $60B |
|
||
| Technology Distribution | 1 | $58B |
|
||
| Homebuilding | 1 | $35B |
|
||
| Technology Manufacturing | 1 | $35B |
|
||
Price history
+137.5% since first listed7 events — show timeline
- 2026-05-28 Listed $475,000 Stellar MLS as Distributed by MLS Grid
- 2005-11-11 Listing Removed — FORTMLS
- 2005-11-11 Listing Removed — Stellar MLS as Distributed by MLS Grid
- 2005-03-14 Listed $449,000 FORTMLS
- 2005-03-14 Listed $449,000 Stellar MLS as Distributed by MLS Grid
- 1997-09-30 Sold (Public Records) $194,000 Public Records
- 1995-08-29 Sold (Public Records) $200,000 Public Records
Property tax history
+1.6%/yrLatest (2025): $2,949 · +4.5% YoY. Source: county tax records.
Cash-flow waterfall
monthlySold comps — $/sqft
last 12 mo · ≤1 miLoading sold comps…