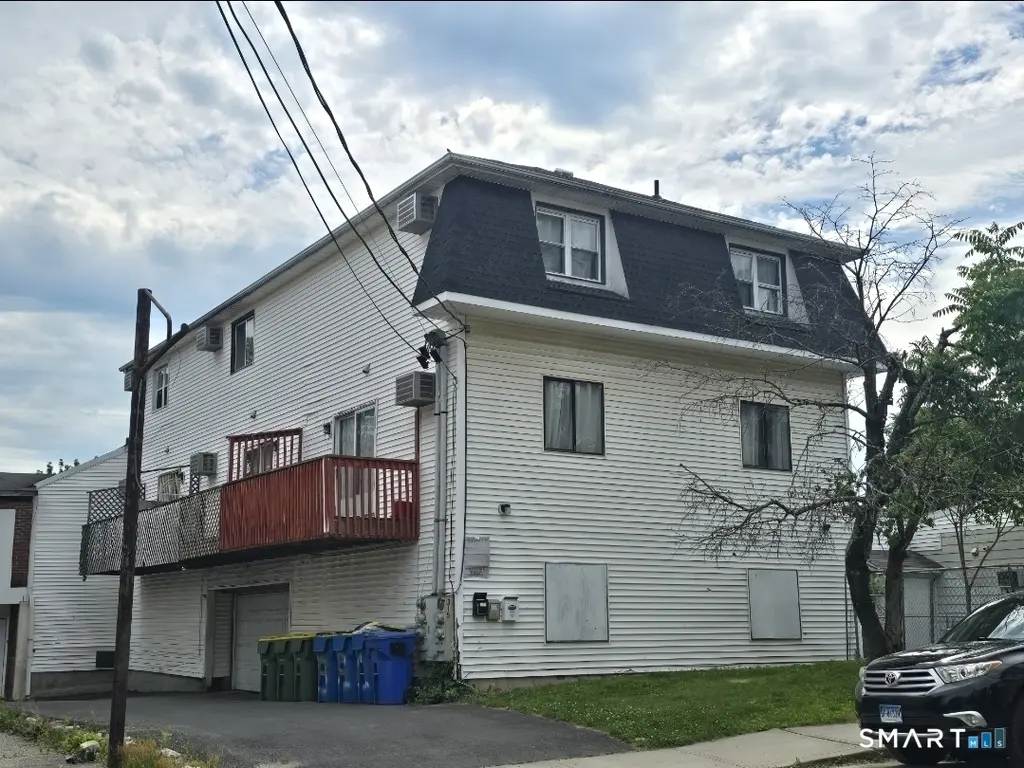
315 Congress Ave Unit C · Waterbury, CT
Flood risk No data
- FEMA flood zone
- —
- Chance of flooding over 30 yrs
- —
- Est. flood insurance / yr
- —
Fire risk No data
- Est. fire insurance / yr
- —
Heat risk No data
- Hot days now (above threshold)
- —
- Hot days in 30 yrs
- —
Wind risk No data
- Chance of severe wind over 30 yrs
- —
Air-quality risk No data
- Unhealthy air days now
- —
- Unhealthy air days in 30 yrs
- —
Risk factors via First Street. Map © Google.
Why this score? — see what drove the B- grade
The composite is a weighted blend of 9 inputs, each scored 0–100. Each bar is that input's sub-score; the figure is the points it added to the 100-point composite (weight × sub-score).
- Cash flow +29.7/30.0
- DSCR +10.0/10.0
- 1% rule +9.6/10.0
- ARV discount +7.5/15.0
- Rent growth +4.9/5.0
- Livability +4.0/5.0
- Condition / age +2.5/5.0
- Schools +1.5/10.0
- Appreciation +0.0/10.0
$116,667
🖨 Deal sheet 📄 Offer letter ✓ Due diligence
Listing remarks MLS
Investor potential--town plot area--open floor plan. Deck 5x14.
Key facts
- Garage
- Built 1986
- Listed 10 days
Property features AI
Finance
- Other: Property is one of 5 units in the building/complex
- HOA & community: No condo association (pets allowed)
Exterior
- Parking: Covered garage; 1 garage space
- Utilities: Public water connected; Public sewer connected; Electric hot water (30 gallon tank)
- Home design: Condominium (Condo/Co-Op for sale); Part of the Valley View complex
- Construction: Frame construction
- Exterior features: Vinyl siding; Sloping lot
Interior
- Kitchen: Oven/Range; Refrigerator
- Bedrooms: 2 bedrooms
- Bathrooms: 1 full bathroom; 1 half bathroom
- Heating & cooling: Baseboard heating; Electric heat
- Interior features: Total of 5 rooms; Two levels in unit; Has attic with access via hatch; No basement
Neighborhood map
What this means for you Summary
Snapshot
- This is a 2-bed/1.5-bath condo listed at $117k.
Deal economics
- At list price, monthly cash flow is $425 ($5k/yr) — positive.
- The deal already cash-flows at list — no discount required.
- Meets the 1% rule at list price ($2k rent vs $117k).
- Cap rate 10.7% vs local median 3.6% in Waterbury — top-decile yield for the area; either an underpriced asset or a hidden risk that comps aren't pricing in. Stress-test before assuming the spread holds.
Location & tenants
- Location reads 79/100 on livability (#32 in CT, #2,205 nationally) — a middle-class / working-renter tenant base. Strengths: commute A+, cost of living A+, housing A+; Watch: schools D+, crime D, employment D.
- Waterbury School District (suburban): math 12% / reading 23% proficiency, ranked #148 of 153 in CT (top 97%) — low school quality limits family demand, transient renter base, plan for 1-2y turnover; 73% free/reduced lunch — lower-income household profile, screen leases tightly.
- Market conditions: Rents rising fast (+9.8%/yr); 121 active listings in the ZIP; 40 comparable units currently listed for rent nearby; rentals lingering (median 44d on market — plan ~5-8 weeks vacancy on turnover, expect pricing pressure); 50% of comp listings sitting > 30 days — soft ceiling on asking rent; 502 units permitted in Naugatuck Valley Planning Region in 2024 (171 in 5+ unit buildings).
- This rent runs 30% of the median local income ($67k/yr) — at the standard rent-burdened threshold; future hikes will face affordability resistance.
Forward outlook
- Local home prices are declining (-3.0%/yr); year-one equity from $806 of loan paydown is wiped out by about $4k of value loss. Plan a longer hold.
- At projected returns (-3.0% appreciation + 8.0% rent growth), your $33k cash investment doubles in ~6 years — after that, you're playing with house money.
Negotiation context
- Only 10 days on market — expect competitive offers; lowballing is unlikely to land.
- 2 sale attempts since 20y ago; this cycle's ask has dropped $50k (30%) from the opening price — seller is motivated, your offer sets the floor, not the list.
- Current owner paid $55k; list at $117k implies a 112% gain — meaningful room to come down on a strong offer.
Risks & watch-outs
- Watch-outs: property tax is 2.7% of price.
Questions for the listing agent
- Property tax is high relative to price — has the assessment been appealed recently, and will the sale trigger a re-assessment?
- Any open or pending special assessments — roof, HVAC, plumbing, elevator, façade? What's the per-unit balance and payoff schedule, and is the seller paying it off at close or rolling it to the buyer?
- Is there a deadline driving the sale (1031 exchange, divorce, estate, relocation)? That informs how much negotiation room exists.
- Schools are D-rated, which usually means shorter tenancies and higher turnover. Who's the typical renter profile here, and what's been the actual vacancy rate?
- Crime grade is D in this area — have there been break-ins, vandalism, or insurance claims at this property in the last 3 years? What carrier currently insures it and at what premium?
- What's the average days-on-market for RENTAL listings here right now (not sales)? A rising rental-DOM trend means longer vacancies and softer asking-rent achievability than the comps imply.
- What's the recent tenant-quality profile in this submarket — average credit score on applications, eviction rate, late-payment / NSF rate, and stable-employment percentage? A property-management company in the area should have these aggregated.
- How much new apartment / multifamily construction is in the pipeline within 1–3 miles? Heavy new supply (>2% of stock underway) typically softens rents 12–24 months out; light construction supports rent growth.
Investment metrics
- 1% rule
- 1.46% ✓
- Cap rate
- 10.66%
- Cash-on-cash
- 15.61%
- DSCR
- 1.69
- GRM
- 5.7
CMA / ARV
No comps found within radius.
Projected returns pro-forma
-3.0% appreciation · 8.0% rent growth · sell at horizon
- IRR
- 12.5%
- Equity multiple
- 1.53×
- Total profit
- $17,256
- Equity at exit
- $17,395
- IRR
- 25.3%
- Equity multiple
- 3.79×
- Total profit
- $91,226
- Equity at exit
- $10,087
Cash invested: $32,667 (down + closing). Projections, not guarantees.
Landlord ↔ Tenant lean methodology
- Overall (STATE)
- 27 Tenant-Leaning
- State Connecticut
- 27 Tenant-Leaning · D+7
- County
- — inherits STATE
- City
- — inherits STATE
ZIP-level market 06708
- Rents YoY
- 9.8%
- Active inventory
- 121
- Price-to-rent
- 5.7×
Monthly cashflow live
- Estimated rent
- $1,703 high interval (Pro) →
- Mortgage (P&I)
- −$612
- Tax from tax record
- −$260 /mo · $3,118/yr
- Insurance
- −$49
- HOA
- −$0
- Vacancy / Maint / Mgmt
- −$358
- Net cashflow
- $425
Break-even live
UW: 25.0% down · 7.5% · 30yr · 1.5% tax · 5.0% vac · 8.0% maint · 8.0% mgmt
Financing live
Cash to close
- Down payment
- $29,167
- Closing costs
- $3,500
- Reserves months
- —
- Total cash needed
- —
Loan-product check · same deal, 3 products live
Conventional
25% down · 7.5% · 30yr
- Down + closing
- —
- Monthly P&I
- —
- Monthly cashflow
- —
- DSCR
- —
- Eligible?
- —
Personal DTI + credit; lowest rate.
DSCR
20% down · 8.5% · 30yr
- Down + closing
- —
- Monthly P&I
- —
- Monthly cashflow
- —
- DSCR
- —
- Eligible?
- —
No personal income docs; deal must DSCR.
Hard money
10% down · 12.0% · 12mo
- Down + closing
- —
- Monthly P&I
- —
- Monthly cashflow
- —
- DSCR
- —
- Eligible?
- —
Short-term bridge; refi at stabilization.
Rent comps 40 comps
| Address | Beds | Baths | Sqft | Rent | $/sqft | DOM | Units | Dist |
|---|---|---|---|---|---|---|---|---|
| 241 Congress Ave Unit 1st Floor Waterbury, CT | 2.0 | 1.0 | 909 | $1,300 | $1.43 | 44d | 1 | 0.07mi |
| 124 Charles St Unit 2 Waterbury, CT | 2.0 | 1.0 | 1012 | $1,800 | $1.78 | 44d | 1 | 0.19mi |
| 127 Congress Ave Unit 1 Waterbury, CT | 3.0 | 1.0 | 1200 | $2,300 | $1.92 | 44d | 1 | 0.20mi |
| 468 Congress Ave Unit third floor Waterbury, CT | 3.0 | 1.0 | 1250 | $1,500 | $1.20 | 23d | 1 | 0.25mi |
| 59 Green St Waterbury, CT | 3.0 | 1.0 | 900 | $1,650 | $1.83 | 44d | 1 | 0.29mi |
| 654 Highland Ave Unit 2 Waterbury, CT | 2.0 | 1.0 | 1000 | $1,400 | $1.40 | 44d | 1 | 0.33mi |
| 67 Avon Ave Unit 2 Waterbury, CT | 2.0 | 1.0 | 887 | $1,700 | $1.92 | 23d | 1 | 0.38mi |
| 85 Draher St Unit 1 Waterbury, CT | 2.0 | 1.0 | 1200 | $1,600 | $1.33 | 44d | 1 | 0.40mi |
| 95 Hawthorne Ave Unit 2 Waterbury, CT | 3.0 | 1.0 | 1300 | $1,800 | $1.38 | 23d | 1 | 0.45mi |
| 65 Chambers St Unit 1 Waterbury, CT | 2.0 | 1.0 | 800 | $1,700 | $2.12 | 44d | 1 | 0.48mi |
| 91 Taft St Unit 11 Waterbury, CT | 2.0 | 1.5 | 1320 | $2,600 | $1.97 | 44d | 1 | 0.49mi |
| 44 Taft St Unit 9 Waterbury, CT | 2.0 | 1.5 | 1200 | $2,100 | $1.75 | 44d | 1 | 0.49mi |
| 222 Chipman Street Ext Waterbury, CT | 1.0 | 1.0 | 700 | $1,400 | $2.00 | 44d | 1 | 0.50mi |
| 203 Alder St Unit 1st floor Waterbury, CT | 2.0 | 1.0 | 1060 | $1,600 | $1.51 | 44d | 1 | 0.50mi |
| 124 Geddes Ter Waterbury, CT | 3.0 | 2.0 | 1255 | $2,300 | $1.83 | 44d | 1 | 0.53mi |
| 124 Geddes Ter Unit Left Waterbury, CT | 3.0 | 1.5 | 1255 | $2,300 | $1.83 | 44d | 1 | 0.53mi |
| 20 Lounsbury Ave Waterbury, CT | 1.0 | 1.0 | 900 | $1,150 | $1.28 | 44d | 1 | 0.61mi |
| 56 Lounsbury St Unit 3s Waterbury, CT | 2.0 | 1.0 | 810 | $1,250 | $1.54 | 23d | 1 | 0.61mi |
| 691 S Main St Unit 3RD Waterbury, CT | 3.0 | 1.0 | 1000 | $1,600 | $1.60 | 44d | 1 | 0.62mi |
| 472 S Main St Unit 9 Waterbury, CT | 1.0 | 1.0 | 800 | $1,200 | $1.50 | 14d | 1 | 0.70mi |
| 173 Bradley Ave Waterbury, CT | 2.0 | 1.0 | 900 | $1,850 | $2.06 | 3d | 1 | 0.75mi |
| 1120 Baldwin St Waterbury, CT | 3.0 | 1.0 | 1100 | $1,750 | $1.59 | 44d | 1 | 0.80mi |
| 429 Baldwin St Unit 2 Waterbury, CT | 3.0 | 1.0 | 900 | $1,600 | $1.78 | 3d | 1 | 0.81mi |
| 423 Baldwin St Unit 2 Waterbury, CT | 3.0 | 1.0 | 900 | $1,600 | $1.78 | 3d | 1 | 0.82mi |
| 222 Bradley Ave Waterbury, CT | 2.0 | 1.0–1.5 | 594 | $1,625 | $2.74 | 3d | 3 | 0.82mi |
| 75 Vernon St Waterbury, CT | 2.0 | 1.0 | 1000 | $1,450 | $1.45 | 44d | 1 | 0.89mi |
| 14 Elmview Cir Unit 3 Waterbury, CT | 2.0 | 1.0 | 900 | $1,450 | $1.61 | 23d | 1 | 0.89mi |
| 59 Baldwin Ave Waterbury, CT | 3.0 | 1.0 | 1200 | $2,350 | $1.96 | 44d | 1 | 0.93mi |
| 1101 Highland Ave Waterbury, CT | 2.0 | 1.5 | 1380 | $1,800 | $1.30 | 23d | 1 | 0.94mi |
| 1101 Highland Ave Waterbury, CT | 2.0 | 1.5 | 1180 | $1,800 | $1.53 | 44d | 1 | 0.94mi |
| 219 Nichols Dr Waterbury, CT | 2.0 | 1.5 | 1060 | $1,550 | $1.46 | 3d | 1 | 0.95mi |
| 63 Bank St Unit 3A Waterbury, CT | 2.0 | 1.0 | 903 | $1,700 | $1.88 | 14d | 1 | 0.97mi |
| 150 Mohican Ave Unit 4 Waterbury, CT | 2.0 | 1.5 | 1024 | $1,650 | $1.61 | 23d | 1 | 0.97mi |
| 23 Lake St Waterbury, CT | 3.0 | 1.5 | 1000 | $2,200 | $2.20 | 23d | 1 | 1.06mi |
| 1171 W Main St Waterbury, CT | 3.0 | 1.0 | 1500 | $1,795 | $1.20 | 23d | 1 | 1.08mi |
| 174 Lucille St Unit 2 Waterbury, CT | 2.0 | 1.0 | 875 | $1,600 | $1.83 | 44d | 1 | 1.13mi |
| 332 Robbins St Waterbury, CT | 3.0 | 1.0 | 1160 | $2,500 | $2.16 | 23d | 1 | 1.13mi |
| 32 Willow St Unit 1B Waterbury, CT | 1.0 | 1.0 | 850 | $1,250 | $1.47 | 14d | 1 | 1.16mi |
| 32 Willow St Unit 1A Waterbury, CT | 1.0 | 1.0 | 800 | $1,250 | $1.56 | 23d | 1 | 1.16mi |
| 1017 W Main St Unit 2R Waterbury, CT | 3.0 | 1.0 | 850 | $1,500 | $1.76 | 23d | 1 | 1.16mi |
HOA detail condo
- Monthly dues
- $0 · $0/yr
- Assessments
- None detected in remarks — confirm with the listing agent.
Listing history 10 events
-
2026-06-18days on market $116,667 Active 10 DOM
-
2026-06-17days on market $116,667 Active 9 DOM
-
2026-06-16days on market $116,667 Active 8 DOM
-
2026-06-15days on market $116,667 Active 7 DOM
-
2026-06-14days on market $116,667 Active 5 DOM
-
2026-06-13remarks 347-char remark
-
2026-06-13days on market $116,667 Active 4 DOM
-
2026-06-10pricedays on market $116,667 Active 2 DOM
-
2026-06-09remarks 279-char remark
-
2026-06-09$166,667 Active 1 DOM
ⓘ Source: listings_history table (triggers on properties + properties_extension) + one-shot
backfill from property_details.listing_events for pre-trigger history.
Tax reassessment forecast CT · Partial reset (capped growth)
- Current annual tax
- $3,118 · $260/mo
- Projected year-2 tax
- $3,118 · $260/mo
- Expected delta
- $0/yr ($0/mo · 0.0%)
ⓘ Screening estimate from a state-policy table — verify with the county assessor before closing.
Nearby sold comps map
Loading sold comps map…
Walkable amenities ~0.75 mi
Loading nearby amenities…
Taxation est. · year 1
- Rental income
- $20,434
- − Mortgage interest
- −$6,535
- − Property taxes
- −$3,118
- − Insurance
- −$583
- − Repairs & maintenance
- −$1,635
- − Management
- −$1,635
- − Depreciation
- −$3,394
- Taxable income
- $3,534
- Est. tax owed @ 24.0%
- −$848
- After-tax cash flow
- $4,251/yr
For passive investors: Depreciation is non-cash, so a rental often shows a tax loss while cash-flowing — sheltering income. Rental losses are passive: they offset passive income freely, and up to $25,000/yr can offset ordinary (W-2) income if you actively participate and your MAGI is under $100k (phasing out to $0 by $150k); unused losses carry forward. On sale, claimed depreciation is recaptured at up to 25%, and gains may owe capital-gains tax (a 1031 exchange can defer both). Figures are a year-1 estimate at your 24.0% rate — not tax advice; consult a CPA.
Schools (NCES district)
- District
- Waterbury School District
- NCES district ID
- 0904830
- Math proficiency
- 12% ▼ -7.00%
- Reading proficiency
- 23% ▼ -8.00%
- Median HH income
- $40,040
- Composite
- 14.85/100
- National rank
- #9380
- State rank
- #148 of 153 in CT
Livability — Waterbury
- Score
- 79/100
- State rank
- #32
- US rank
- #2205
Category grades
Schools grade is shown separately in the Schools card above.
Census & demographics
- Census place
- Waterbury, CT
- County
- New Haven County · 688,236 people
- City population
- 115,012
- Metro
- New Haven-Milford, CT
- Population (ZIP)
- 29,594
- Household income
- $67,364
- Rent vs Own
- Severe rent burden
- 1276.0
Population outlook (Naugatuck Valley County) Hauer SSP2
- By 2040
- 496,846
Race, ethnicity, and origin ACS 2023
- Neighborhood character
- Diverse neighborhood (Simpson 0.68)
- Race & ethnicity
- White 43% Hispanic / Latino 33% Black 17% Two or more races 13% Asian 2%
- Hispanic origin (detail)
- Puerto Rican 17% Dominican 8%
- Common ancestry
- Romanian 2% Russian 2% Estonian 2%
- Foreign-born
- 20% · Canada, Jamaica, China
- Languages at home
- 64% English-only · Spanish 23% Other Indo-European 8% French/Haitian/Cajun 1%
Political lean MEDSL · Naugatuck Valley
- 2024 margin
- Lean R (+7.4) · D 45.6% · R 53.0% · Other 1.4%
- All cycles
- 2024: R+7.4
Not yet ingested
- Civics
- —
Market trends
- HPI YoY
- ▼ -297.81%
- Current HPI
- 281.1446
- Rent YoY
- ▲ 9.75%
- Metro
- New Haven-Milford, CT
- State GDP YoY
- ▲ 1.06%
- F500 in state
- 38
Industry mix (Fortune 500 HQ in CT)
| Industry | F500 HQs | Revenue |
|---|---|---|
| Industrial Machinery | 4 | $38B |
|
||
| Insurance | 3 | $71B |
|
||
| Financial Services | 2 | $25B |
|
||
| Transportation / Logistics | 2 | $18B |
|
||
| Healthcare | 1 | $247B |
|
||
| Telecommunications | 1 | $55B |
|
||
Price history
+177.8% since first listed4 events — show timeline
- 2026-06-08 Listed $166,667 Smart MLS
- 2006-09-01 Sold (Public Records) $55,000 Public Records
- 2006-08-31 Sold (MLS) $55,000 Smart MLS
- 2006-01-18 Listed $60,000 Smart MLS
Property tax history
+7.3%/yrLatest (2023): $3,118 · +130.5% YoY. Source: county tax records.
Cash-flow waterfall
monthlySold comps — $/sqft
last 12 mo · ≤1 miLoading sold comps…