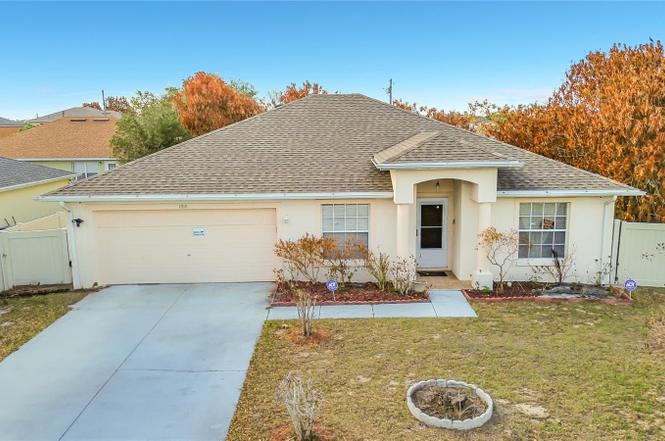
1910 Dolphin Dr · Poinciana, FL
Flood risk 1/10 · Minimal
- FEMA flood zone
- X (unshaded)
- Chance of flooding over 30 yrs
- 0.0%
- Est. flood insurance / yr
- $507 – $1,088
Fire risk 5/10 · Moderate
- Est. fire insurance / yr
- $947 – $1,759
Heat risk 8/10 · Major
- Hot days now (above 108°F)
- 7 days/yr
- Hot days in 30 yrs
- 24 days/yr
Wind risk 9/10 · Severe
- Chance of severe wind over 30 yrs
- 99.0%
Air-quality risk 1/10 · Minimal
- Unhealthy air days now
- 0 days/yr
- Unhealthy air days in 30 yrs
- 0 days/yr
Risk factors via First Street. Map © Google.
Why this score? — see what drove the D- grade
The composite is a weighted blend of 9 inputs, each scored 0–100. Each bar is that input's sub-score; the figure is the points it added to the 100-point composite (weight × sub-score).
- Cash flow +10.1/30.0
- ARV discount +7.5/15.0
- Appreciation +4.3/10.0
- Schools +3.5/10.0
- DSCR +2.9/10.0
- Livability +2.9/5.0
- 1% rule +2.8/10.0
- Rent growth +2.8/5.0
- Condition / age +2.5/5.0
$250,000
🖨 Deal sheet 📄 Offer letter ✓ Due diligence
Listing remarks MLS
NEWER HOME, SEPARATE DINING AND LIVING ROOMS WITH FAMILY ROOM, GARDEN TUB. QUIET AREA,
Key facts
- Brand new roof
- Private oasis
- Vaulted ceilings
Tags
Property features AI
Finance
- Other: Total building area and living area recorded in public records; Property is homesteaded
- Financial info: Annual taxes listed (not included per instructions)
- HOA & community: HOA required — $100 monthly; Association amenities: fitness center, park, playground; Deed restrictions; Street lights; Pets allowed
Exterior
- Parking: Attached 2-car garage
- Security: Security system; Closed-circuit cameras
- Utilities: Public sewer; Public and well water; Electricity connected; Cable connected; Sewer connected; Underground utilities; Fire hydrant nearby
- Home design: Single family residence; One story; Facing southeast; Completed/ready condition
- Construction: Block and stucco construction; Shingle roof; Slab foundation; Built on 0.18-acre lot
- Exterior features: Corner lot; Paved driveway/streets; Vinyl fencing; Irrigation equipment; Public and well water sources
Interior
- Kitchen: Dishwasher; Garbage disposal; Microwave; Range; Refrigerator; Electric water heater
- Bedrooms: 3 bedrooms
- Flooring: Tile; Wood
- Bathrooms: 2 full bathrooms
- Heating & cooling: Central heating (electric); Central air conditioning
- Interior features: Ceiling fans; Kitchen/family room combo; Split bedroom floorplan; Walk-in closets
- Laundry & utility: Inside laundry room; Washer; Dryer
Neighborhood map
What this means for you Summary
Snapshot
- This is a 3-bed/2.0-bath single-family listed at $250k.
Deal economics
- At list price, monthly cash flow is $-147 ($-2k/yr) — negative.
- To cash-flow at today's rent, offer at most $224k (10.4% below list).
- To meet the 1% rule (rent ≥ 1% of price), the offer needs to be $196k (21.8% below list).
- Recommended offer: $196k (21.8% below list) — sets the bar for 1% rule.
- Cap rate 5.6% vs local median 4.3% in Poinciana — meaningfully above typical; check what's discounted (condition, days-on-market, listing class) to confirm the premium yield is real.
Location & tenants
- Location reads 57/100 on livability (#859 in FL) — a working-class tenant base; expect higher turnover. Strengths: cost of living A+, housing A+; Watch: employment D+, amenities F, commute F.
- Polk (suburban): math 39% / reading 43% proficiency, ranked #62 of 73 in FL (top 85%) — families likely to look elsewhere, expect single-tenant / working-renter base with shorter leases.
- Zoned schools: Laurel Elementary School (math 26% / reading 34%, grade F, #1,882 of 2,144 statewide, top 88%, 1,058 students, 50% FRL); Haines City Senior High School (math 12% / reading 32%, grade F, #544 of 667 statewide, top 82%, 2,700 students, 58% FRL).
- Zoned-school proficiency averages 26% at this address vs 41% district-wide (-15 pts) — the specific schools serving this property underperform the Polk average; the district grade overstates school quality for this exact location.
- Market conditions: Rents rising (+1.1%/yr); 1151 active listings in the ZIP; 40 comparable units currently listed for rent nearby; rentals at typical pace (median 21d on market — plan ~3-4 weeks tenant-placement turnaround); 10,384 units permitted in Polk County in 2024 (1,716 in 5+ unit buildings).
- This rent runs 34% of the median local income ($69k/yr) — at the standard rent-burdened threshold; future hikes will face affordability resistance.
Forward outlook
- Local home prices are declining (-1.5%/yr); year-one equity from $2k of loan paydown is wiped out by about $4k of value loss. Plan a longer hold.
- Polk County population projected at +33% by 2050 — long-run rental-demand tailwind backs the buy-and-hold thesis.
Negotiation context
- It's been on market 115 days — a 9% lower offer ($228k) is reasonable based on typical stale-listing flexibility.
- 2 sale attempts since 21y ago with the ask held roughly flat each time — persistent listings suggest the price (not the market) is what's stuck; bring a comps-based counter.
- Current owner paid $175k; 43% above their basis — modest negotiation headroom, anchor on the comps not their cost.
Risks & watch-outs
- Climate carrying-cost: severe wind risk, 99% chance of damaging wind over 30y; moderate wildfire risk; extreme-heat days projected 7→24/yr by 2055 (HVAC capex compounding) — expect insurance premiums to compound above CPI over the hold.
Questions for the listing agent
- What do current leases actually rent for vs. the listed asking? Can we see a recent rent roll and the last 12 months of T-12 income?
- It's been on market 115 days. Have you received any prior offers? Is the seller open to a 22% concession, seller financing, or rate buy-down credit?
- What does the HOA fee cover, when was the last increase, and are there any pending special assessments or reserve-fund shortfalls?
- Why hasn't it sold? Are there any deal-killer items the seller is aware of (foundation, flood, title, zoning, code violations)?
- Is there a deadline driving the sale (1031 exchange, divorce, estate, relocation)? That informs how much negotiation room exists.
- Schools are F-rated, which usually means shorter tenancies and higher turnover. Who's the typical renter profile here, and what's been the actual vacancy rate?
- The area grade is low — what's the realistic commute time and amenity access for the typical tenant pool here? Any planned neighborhood developments (good or bad) we should know about?
- What's the average days-on-market for RENTAL listings here right now (not sales)? A rising rental-DOM trend means longer vacancies and softer asking-rent achievability than the comps imply.
- What's the recent tenant-quality profile in this submarket — average credit score on applications, eviction rate, late-payment / NSF rate, and stable-employment percentage? A property-management company in the area should have these aggregated.
- How much new for-sale + rental construction is in the pipeline within 1–3 miles? Heavy new supply typically softens prices + rents 12–24 months out; constrained supply supports both.
Investment metrics
- 1% rule
- 0.78% ✗
- Cap rate
- 5.59%
- Cash-on-cash
- -2.52%
- DSCR
- 0.89
- GRM
- 10.7
CMA / ARV
No comps found within radius.
Projected returns pro-forma
-1.48% appreciation · 1.14% rent growth · sell at horizon
- IRR
- -13.1%
- Equity multiple
- 0.47×
- Total profit
- $-37,113
- Equity at exit
- $54,655
- IRR
- -7.9%
- Equity multiple
- 0.38×
- Total profit
- $-43,568
- Equity at exit
- $52,673
Cash invested: $70,000 (down + closing). Projections, not guarantees.
Landlord ↔ Tenant lean methodology
- Overall (STATE)
- 87 Strongly Landlord-Friendly
- State Florida
- 87 Strongly Landlord-Friendly · R+3
- County
- — inherits STATE
- City
- — inherits STATE
ZIP-level market 34759
- Home prices YoY
- -0.5%
- Rents YoY
- 1.1%
- Active inventory
- 1151
- Price-to-rent
- 10.7×
Monthly cashflow live
- Estimated rent
- $1,956 high interval (Pro) →
- Mortgage (P&I)
- −$1,311
- Tax from tax record
- −$177 /mo · $2,118/yr
- Insurance
- −$104
- HOA
- −$100
- Vacancy / Maint / Mgmt
- −$411
- Net cashflow
- $-147
Break-even live
UW: 25.0% down · 7.5% · 30yr · 1.5% tax · 5.0% vac · 8.0% maint · 8.0% mgmt
Financing live
Cash to close
- Down payment
- $62,500
- Closing costs
- $7,500
- Reserves months
- —
- Total cash needed
- —
Loan-product check · same deal, 3 products live
Conventional
25% down · 7.5% · 30yr
- Down + closing
- —
- Monthly P&I
- —
- Monthly cashflow
- —
- DSCR
- —
- Eligible?
- —
Personal DTI + credit; lowest rate.
DSCR
20% down · 8.5% · 30yr
- Down + closing
- —
- Monthly P&I
- —
- Monthly cashflow
- —
- DSCR
- —
- Eligible?
- —
No personal income docs; deal must DSCR.
Hard money
10% down · 12.0% · 12mo
- Down + closing
- —
- Monthly P&I
- —
- Monthly cashflow
- —
- DSCR
- —
- Eligible?
- —
Short-term bridge; refi at stabilization.
Rent comps 40 comps
| Address | Beds | Baths | Sqft | Rent | $/sqft | DOM | Units | Dist |
|---|---|---|---|---|---|---|---|---|
| 1884 Snapper Dr Kissimmee, FL | 4.0 | 2.0 | 1682 | $1,985 | $1.18 | 14d | 1 | 0.19mi |
| 321 Drum Ln Poinciana, FL | 3.0 | 2.0 | 1785 | $1,715 | $0.96 | 18d | 1 | 0.24mi |
| 202 Snapper Way Kissimmee, FL | 4.0 | 2.0 | 1670 | $2,050 | $1.23 | 3d | 1 | 0.25mi |
| 310 Dogfish Way Kissimmee, FL | 4.0 | 2.0 | 1700 | $1,950 | $1.15 | 23d | 1 | 0.26mi |
| 1932 Michigan Ct Kissimmee, FL | 3.0 | 2.0 | 2236 | $1,779 | $0.80 | 3d | 1 | 0.28mi |
| 241 Grouper Ct Kissimmee, FL | 4.0 | 2.0 | 1762 | $2,000 | $1.14 | 23d | 1 | 0.28mi |
| 205 Dogfish Ln Kissimmee, FL | 4.0 | 2.0 | 1578 | $1,680 | $1.06 | 13d | 1 | 0.31mi |
| 320 Kingfish Dr Kissimmee, FL | 3.0 | 3.0 | 1606 | $1,795 | $1.12 | 23d | 1 | 0.32mi |
| 106 Herring Ln Kissimmee, FL | 3.0 | 2.0 | 1062 | $1,575 | $1.48 | 2d | 1 | 0.34mi |
| 260 Grouper Ct Kissimmee, FL | 2.0 | 2.0 | 1130 | $1,400 | $1.24 | 2d | 1 | 0.34mi |
| 104 Herring Ln Kissimmee, FL | 4.0 | 2.0 | 1699 | $1,925 | $1.13 | 3d | 1 | 0.35mi |
| 223 Grouper Ct Kissimmee, FL | 3.0 | 2.0 | 1475 | $1,595 | $1.08 | 23d | 1 | 0.38mi |
| 149 Conch Dr Kissimmee, FL | 3.0 | 2.0 | 1578 | $1,700 | $1.08 | 18d | 1 | 0.38mi |
| 1907 Manatee Dr Kissimmee, FL | 4.0 | 2.0 | 1803 | $1,795 | $1.00 | 23d | 1 | 0.41mi |
| 307 Michigan Ln Kissimmee, FL | 4.0 | 2.0 | 1673 | $1,744 | $1.04 | 13d | 1 | 0.41mi |
| 5 Flatfish Dr Kissimmee, FL | 4.0 | 2.0 | 1650 | $2,150 | $1.30 | 23d | 1 | 0.44mi |
| 1731 Minnow Ct Kissimmee, FL | 3.0 | 2.0 | 1209 | $1,750 | $1.45 | 23d | 1 | 0.44mi |
| 1912 Manatee Dr Kissimmee, FL | 4.0 | 2.5 | 1420 | $1,995 | $1.40 | 23d | 1 | 0.45mi |
| 8 Flatfish Dr Kissimmee, FL | 3.0 | 2.0 | 1392 | $1,650 | $1.19 | 3d | 1 | 0.46mi |
| 12 Herring Ct Kissimmee, FL | 3.0 | 2.0 | 1055 | $1,613 | $1.53 | 23d | 1 | 0.46mi |
| 7 Haddock Way Kissimmee, FL | 3.0 | 2.0 | 2052 | $1,950 | $0.95 | 14d | 1 | 0.46mi |
| 1951 Michigan Dr Kissimmee, FL | 4.0 | 2.0 | 1562 | $2,060 | $1.32 | 13d | 1 | 0.47mi |
| 352 Kingfish Dr Kissimmee, FL | 4.0 | 2.0 | 1670 | $1,950 | $1.17 | 23d | 1 | 0.51mi |
| 301 Shad Way Kissimmee, FL | 4.0 | 2.5 | 2134 | $2,000 | $0.94 | 21d | 1 | 0.55mi |
| 303 Shad Way Kissimmee, FL | 4.0 | 2.0 | 1930 | $1,999 | $1.04 | 23d | 1 | 0.56mi |
| 1701 Pilchard Dr Kissimmee, FL | 4.0 | 2.0 | 1720 | $2,050 | $1.19 | 23d | 1 | 0.56mi |
| 1707 Sail Ct Kissimmee, FL | 4.0 | 2.5 | 1823 | $2,015 | $1.11 | 3d | 1 | 0.58mi |
| 1662 Redfin Dr Kissimmee, FL | 4.0 | 2.5 | 1852 | $1,940 | $1.05 | 23d | 1 | 0.62mi |
| 319 Erie Ct Kissimmee, FL | 3.0 | 2.0 | 1310 | $1,815 | $1.39 | 23d | 1 | 0.62mi |
| 1660 Redfin Dr Kissimmee, FL | 4.0 | 2.0 | 1661 | $1,975 | $1.19 | 3d | 1 | 0.63mi |
| 1658 Redfin Dr Kissimmee, FL | 4.0 | 2.0 | 1661 | $1,810 | $1.09 | 3d | 1 | 0.64mi |
| 116 Sail Way Kissimmee, FL | 4.0 | 2.0 | 1661 | $1,805 | $1.09 | 11d | 1 | 0.66mi |
| 1805 Hudson Ct Kissimmee, FL | 3.0 | 2.0 | 1531 | $1,835 | $1.20 | 23d | 1 | 0.68mi |
| 10 Trout Way Unit B Poinciana, FL | 3.0 | 2.0 | 1162 | $1,749 | $1.51 | 21d | 1 | 0.68mi |
| 10 Trout Way Unit A Kissimmee, FL | 3.0 | 2.0 | 1162 | $1,750 | $1.51 | 23d | 1 | 0.68mi |
| 12 Trout Way Unit B Kissimmee, FL | 3.0 | 2.0 | 1162 | $1,750 | $1.51 | 23d | 1 | 0.69mi |
| 12 Trout Way Unit A Kissimmee, FL | 3.0 | 2.0 | 1162 | $1,750 | $1.51 | 21d | 1 | 0.69mi |
| 1613 Sail Dr Kissimmee, FL | 3.0 | 2.0 | 1711 | $1,625 | $0.95 | 23d | 1 | 0.70mi |
| 16 Trout Way Kissimmee, FL | 3.0 | 2.0 | 1304 | $1,775 | $1.36 | 3d | 1 | 0.70mi |
| 319 Erie Dr Kissimmee, FL | 3.0 | 2.0 | 1310 | $1,765 | $1.35 | 13d | 1 | 0.71mi |
HOA detail
- Monthly dues
- $100 · $1,200/yr
Listing history 17 events
-
2026-06-18days on market $250,000 Active 115 DOM
-
2026-06-17days on market $250,000 Active 114 DOM
-
2026-06-16days on market $250,000 Active 113 DOM
-
2026-06-15days on market $250,000 Active 112 DOM
-
2026-06-13days on market $250,000 Active 110 DOM
-
2026-06-10days on market $250,000 Active 107 DOM
-
2026-06-09days on market $250,000 Active 106 DOM
-
2026-06-08days on market $250,000 Active 105 DOM
-
2026-06-07days on market $250,000 Active 104 DOM
-
2026-06-05days on market $250,000 Active 101 DOM
-
2026-06-03days on market $250,000 Active 99 DOM
-
2026-06-01days on market $250,000 Active 98 DOM
-
2026-05-31days on market $250,000 Active 97 DOM
-
2026-02-23$250,000 Active
-
2005-04-28soldstatus $175,000
-
2005-04-15soldstatus $175,000 86-char remark
Show marketing remark (86 chars)
NEWER HOME, SEPARATE DINING AND LIVING ROOMS WITH FAMILY ROOM, GARDEN TUB. QUIET AREA,
-
2005-03-01$175,000 86-char remark
Show marketing remark (86 chars)
NEWER HOME, SEPARATE DINING AND LIVING ROOMS WITH FAMILY ROOM, GARDEN TUB. QUIET AREA,
ⓘ Source: listings_history table (triggers on properties + properties_extension) + one-shot
backfill from property_details.listing_events for pre-trigger history.
Tax reassessment forecast FL · Resets to sale price
- Current annual tax
- $2,118 · $177/mo
- Projected year-2 tax
- $2,118 · $177/mo
- Expected delta
- $0/yr ($0/mo · 0.0%)
ⓘ Screening estimate from a state-policy table — verify with the county assessor before closing.
Climate risk First Street
- Flood 1/10 Low FEMA zone X (unshaded) · 0% chance over 30 yrs
- Wildfire 5/10 Major
- Heat 8/10 Severe 7 d/yr ≥108°F today · 24 d/yr by 30 yrs out
- Wind 9/10 Extreme 99% chance of damaging wind over 30 yrs
- Air quality 1/10 Low 0 unhealthy d/yr today · 0 by 30 yrs out
Nearby sold comps map
Loading sold comps map…
Walkable amenities ~0.75 mi
Loading nearby amenities…
Taxation est. · year 1
- Rental income
- $23,466
- − Mortgage interest
- −$14,004
- − Property taxes
- −$2,118
- − Insurance
- −$1,250
- − Repairs & maintenance
- −$1,877
- − Management
- −$1,877
- − HOA
- −$1,200
- − Depreciation
- −$7,273
- Taxable loss
- −$6,133
- Est. tax savings @ 24.0%
- +$1,472
- After-tax cash flow
- $-290/yr
For passive investors: Depreciation is non-cash, so a rental often shows a tax loss while cash-flowing — sheltering income. Rental losses are passive: they offset passive income freely, and up to $25,000/yr can offset ordinary (W-2) income if you actively participate and your MAGI is under $100k (phasing out to $0 by $150k); unused losses carry forward. On sale, claimed depreciation is recaptured at up to 25%, and gains may owe capital-gains tax (a 1031 exchange can defer both). Figures are a year-1 estimate at your 24.0% rate — not tax advice; consult a CPA.
Schools (NCES district)
- District
- Polk
- NCES district ID
- 1201590
- Math proficiency
- 39% ▼ -11.00%
- Reading proficiency
- 43% ▼ -4.00%
- Median HH income
- $43,979
- Composite
- 34.74/100
- National rank
- #5132
- State rank
- #62 of 73 in FL
Livability — Poinciana
- Score
- 57/100
- State rank
- #859
- US rank
- #21760
Category grades
Schools grade is shown separately in the Schools card above.
Census & demographics
- Census place
- Poinciana, FL
- County
- Polk County · 740,051 people
- City population
- 91,336
- Metro
- Lakeland-Winter Haven, FL
- Population (ZIP)
- 44,568
- Household income
- $69,373
- Rent vs Own
- Severe rent burden
- 1186.0
Population outlook (Polk County) Hauer SSP2
- Today (2025)
- 752,975 people
- By 2030
- 804,621 · +6.9%
- By 2040
- 906,117 · +20.3%
- By 2050
- 1,000,476 · +32.9%
- By 2075
- 1,197,520 · +59.0%
- By 2100
- 1,271,518 · +68.9%
Race, ethnicity, and origin ACS 2023
- Neighborhood character
- Diverse neighborhood (Simpson 0.62)
- Race & ethnicity
- Hispanic / Latino 55% White 21% Two or more races 20% Black 19%
- Hispanic origin (detail)
- Mexican 2% Puerto Rican 38% Cuban 6% Dominican 3%
- Common ancestry
- Hispanic 3% Romanian 2% Scotch-Irish 1%
- Foreign-born
- 17% · Canada, Jamaica
- Languages at home
- 49% English-only · Spanish 48% French/Haitian/Cajun 2%
Political lean MEDSL · Polk
- 2024 margin
- Strong R (+20.7) · D 39.2% · R 59.9%
- 2008→2024 swing
- -14.6pp toward R · 2008: -6.1pp · 2024: -20.7pp
- All cycles
- 2024: R+20.7 2020: R+14.4 2016: R+14.1 2012: R+6.8 2008: R+6.1
Not yet ingested
- Civics
- —
Market trends
- HPI YoY
- ▼ -1.48%
- Current HPI
- 276.6861
- Rent YoY
- ▲ 1.14%
- Metro
- Lakeland-Winter Haven, FL
- State GDP YoY
- ▲ 3.28%
- F500 in state
- 36
Industry mix (Fortune 500 HQ in FL)
| Industry | F500 HQs | Revenue |
|---|---|---|
| Industrial Technology | 2 | $29B |
|
||
| Insurance | 2 | $17B |
|
||
| Retail | 1 | $60B |
|
||
| Technology Distribution | 1 | $58B |
|
||
| Homebuilding | 1 | $35B |
|
||
| Technology Manufacturing | 1 | $35B |
|
||
Price history
+42.9% since first listed4 events — show timeline
- 2026-02-23 Listed $250,000 Stellar MLS as Distributed by MLS Grid
- 2005-04-28 Sold (Public Records) $175,000 Public Records
- 2005-04-15 Sold (MLS) $175,000 Stellar MLS as Distributed by MLS Grid
- 2005-03-01 Listed $175,000 Stellar MLS as Distributed by MLS Grid
Property tax history
+14.2%/yrLatest (2025): $2,118 · +8.3% YoY. Source: county tax records.
Cash-flow waterfall
monthlySold comps — $/sqft
last 12 mo · ≤1 miLoading sold comps…