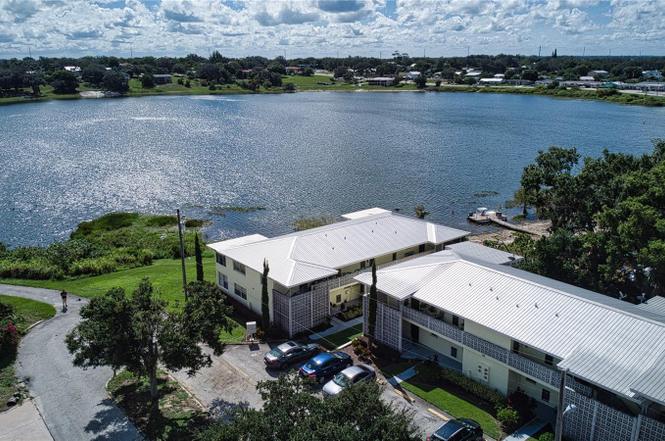
136 N Verona Ave #103 · Avon Park, FL
Flood risk 1/10 · Minimal
- FEMA flood zone
- X (unshaded)
- Chance of flooding over 30 yrs
- 0.0%
- Est. flood insurance / yr
- $507 – $1,088
Fire risk 4/10 · Minor
- Est. fire insurance / yr
- $947 – $1,759
Heat risk 8/10 · Major
- Hot days now (above 108°F)
- 7 days/yr
- Hot days in 30 yrs
- 22 days/yr
Wind risk 10/10 · Severe
- Chance of severe wind over 30 yrs
- 99.0%
Air-quality risk 2/10 · Minimal
- Unhealthy air days now
- 2 days/yr
- Unhealthy air days in 30 yrs
- 2 days/yr
Risk factors via First Street. Map © Google.
Why this score? — see what drove the D grade
The composite is a weighted blend of 9 inputs, each scored 0–100. Each bar is that input's sub-score; the figure is the points it added to the 100-point composite (weight × sub-score).
- Cash flow +14.2/30.0
- ARV discount +7.5/15.0
- 1% rule +5.5/10.0
- DSCR +4.3/10.0
- Schools +3.6/10.0
- Livability +3.6/5.0
- Rent growth +2.5/5.0
- Condition / age +2.5/5.0
- Appreciation +0.0/10.0
$109,500
🖨 Deal sheet (PDF) 📄 Offer letter ✓ Due diligence
Listing remarks
Under contract-accepting backup offers. Back on Market- Previous Buyer Financing Fell Through (NOT Property- Related)! Price Improved to $109,500! Rare opportunity to own an affordable, low-maintenance 2-bedroom, 1-Bathroom condo at a true entry-level price point in Avon Park. This prime second floor unit offers added privacy with no upstairs neighbors, minimal upkeep, and serene elevated lake views over Lake Verona ideal for seasonal residents, first-time buyers, low -maintenance living, or investors seeking strong value and excellent rental potential. With very limited inventory available under $110K in this market, this turnkey property is an excellent chance to secure Florida lakes
Key facts
- Lake verona
- Lakeside living
- Tennis courts
Tags
Property features AI
Finance
- Other: Lease restrictions apply
- Financial info: Total annual fees $2,340
- HOA & community: Monthly condo fee of $195; HOA maintenance covers structure, grounds, and water; Association approval required; Buyer approval required; Deed restrictions; Pets allowed: cats and dogs
Exterior
- Utilities: Public water; Public sewer; Cable available; Electric service available
- Home design: Condominium; Residential property; One story; Faces south; Second-floor unit
- Construction: Concrete construction; Metal roof; Slab foundation; Built as part of a multi-unit building
- Exterior features: Balcony; Storage
Interior
- Kitchen: Dishwasher; Microwave; Range; Refrigerator
- Bedrooms: 2 bedrooms
- Flooring: Carpet; Laminate; Tile
- Bathrooms: 1 full bathroom
- Heating & cooling: Central heat; Central air conditioning
- Interior features: Ceiling fans; Living room/dining room combo
- Laundry & utility: Washer
Neighborhood map
What this means for you Summary
Snapshot
- This is a 2-bed/1.0-bath condo listed at $110k.
Deal economics
- At list price, monthly cash flow is $19 ($225/yr) — positive.
- The deal already cash-flows at list — no discount required.
- Meets the 1% rule at list price ($1k rent vs $110k).
- Recommended offer: $96k (12.0% below list) — sets the bar for market timing.
- Cap rate 6.5% vs local median 3.8% in Avon Park — top-decile yield for the area; either an underpriced asset or a hidden risk that comps aren't pricing in. Stress-test before assuming the spread holds.
Location & tenants
- Location reads 71/100 on livability (#407 in FL) — a middle-class / working-renter tenant base. Strengths: cost of living A+, housing A+, health & safety A+; Watch: crime D+, amenities F, commute F.
- Highlands (other): math 45% / reading 43% proficiency, ranked #54 of 73 in FL (top 74%) — families likely to look elsewhere, expect single-tenant / working-renter base with shorter leases; 68% free/reduced lunch — lower-income household profile, screen leases tightly.
- Zoned schools: Park Elementary School (math 62% / reading 47%, grade C, #892 of 2,144 statewide, top 44%, 527 students, 80% FRL); Avon Park Middle School (math 37% / reading 35%, grade F, #410 of 571 statewide, top 72%, 638 students, 77% FRL); Avon Park High School (math 35% / reading 39%, grade F, #340 of 667 statewide, top 52%, 928 students, 67% FRL).
- Market conditions: 478 active listings in the ZIP; 1 comparable units currently listed for rent nearby; 980 units permitted in Highlands County in 2024 (80 in 5+ unit buildings).
Forward outlook
- Local home prices are declining (-3.0%/yr); year-one equity from $757 of loan paydown is wiped out by about $3k of value loss. Plan a longer hold.
Negotiation context
- It's been on market 425 days — a 12% lower offer ($96k) is reasonable based on typical stale-listing flexibility.
- 7 sale attempts since 4y ago with the ask held roughly flat each time — persistent listings suggest the price (not the market) is what's stuck; bring a comps-based counter.
Risks & watch-outs
- Climate carrying-cost: severe wind risk, 99% chance of damaging wind over 30y; extreme-heat days projected 7→22/yr by 2055 (HVAC capex compounding) — expect insurance premiums to compound above CPI over the hold.
Questions for the listing agent
- It's been on market 425 days. Have you received any prior offers? Is the seller open to a 12% concession, seller financing, or rate buy-down credit?
- Built in 1969 — when were the roof, HVAC, electrical panel, plumbing, and water heater last replaced?
- What does the HOA fee cover, when was the last increase, and are there any pending special assessments or reserve-fund shortfalls?
- Any open or pending special assessments — roof, HVAC, plumbing, elevator, façade? What's the per-unit balance and payoff schedule, and is the seller paying it off at close or rolling it to the buyer?
- Why hasn't it sold? Are there any deal-killer items the seller is aware of (foundation, flood, title, zoning, code violations)?
- Is there a deadline driving the sale (1031 exchange, divorce, estate, relocation)? That informs how much negotiation room exists.
- Schools are F-rated, which usually means shorter tenancies and higher turnover. Who's the typical renter profile here, and what's been the actual vacancy rate?
- Crime grade is D in this area — have there been break-ins, vandalism, or insurance claims at this property in the last 3 years? What carrier currently insures it and at what premium?
- The area grade is low — what's the realistic commute time and amenity access for the typical tenant pool here? Any planned neighborhood developments (good or bad) we should know about?
- What's the average days-on-market for RENTAL listings here right now (not sales)? A rising rental-DOM trend means longer vacancies and softer asking-rent achievability than the comps imply.
- What's the recent tenant-quality profile in this submarket — average credit score on applications, eviction rate, late-payment / NSF rate, and stable-employment percentage? A property-management company in the area should have these aggregated.
- How much new apartment / multifamily construction is in the pipeline within 1–3 miles? Heavy new supply (>2% of stock underway) typically softens rents 12–24 months out; light construction supports rent growth.
Investment metrics
- 1% rule
- 1.05% ✓
- Cap rate
- 6.50%
- Cash-on-cash
- 0.73%
- DSCR
- 1.03
- GRM
- 7.9
CMA / ARV
No comps found within radius.
Projected returns pro-forma
-3.0% appreciation · 3.0% rent growth · sell at horizon
- IRR
- -15.0%
- Equity multiple
- 0.46×
- Total profit
- $-16,453
- Equity at exit
- $16,327
- IRR
- -6.3%
- Equity multiple
- 0.60×
- Total profit
- $-12,390
- Equity at exit
- $9,468
Cash invested: $30,660 (down + closing). Projections, not guarantees.
Landlord ↔ Tenant lean methodology
- Overall (STATE)
- 87 Strongly Landlord-Friendly
- State Florida
- 87 Strongly Landlord-Friendly · R+3
- County
- — inherits STATE
- City
- — inherits STATE
ZIP-level market 33825
- Home prices YoY
- -25.9%
- Active inventory
- 478
- Price-to-rent
- 7.9×
Monthly cashflow live
- Estimated rent
- $1,150 medium interval (Pro) →
- Mortgage (P&I)
- −$574
- Tax from tax record
- −$75 /mo · $899/yr
- Insurance
- −$46
- HOA
- −$195
- Lot rent
- −$0
- Vacancy / Maint / Mgmt
- −$241
- Net cashflow
- $19
Break-even live
Sensitivity live
| Price | -10% $81 | -5% $50 | +0% $19 | +5% $-12 | +10% $-43 |
|---|---|---|---|---|---|
| Rent | -10% $-72 | -5% $-27 | +0% $19 | +5% $64 | +10% $110 |
| Rate | -1.0pp $74 | -0.5pp $47 | base $19 | +0.5pp $-10 | +1.0pp $-39 |
UW: 25.0% down · 7.5% · 30yr · 1.5% tax · 5.0% vac · 8.0% maint · 8.0% mgmt
Financing live
Cash to close
- Down payment
- $27,375
- Closing costs
- $3,285
- Reserves months
- —
- Total cash needed
- —
Loan-product check · same deal, 3 products live
Conventional
25% down · 7.5% · 30yr
- Down + closing
- —
- Monthly P&I
- —
- Monthly cashflow
- —
- DSCR
- —
- Eligible?
- —
Personal DTI + credit; lowest rate.
DSCR
20% down · 8.5% · 30yr
- Down + closing
- —
- Monthly P&I
- —
- Monthly cashflow
- —
- DSCR
- —
- Eligible?
- —
No personal income docs; deal must DSCR.
Hard money
10% down · 12.0% · 12mo
- Down + closing
- —
- Monthly P&I
- —
- Monthly cashflow
- —
- DSCR
- —
- Eligible?
- —
Short-term bridge; refi at stabilization.
Rent comps 1 comps
| Address | Beds | Baths | Sqft | Rent | $/sqft | DOM | Units | Dist |
|---|---|---|---|---|---|---|---|---|
| 565 Luminary LOOP Avon Park, FL | 2.0–3.0 | 1.5–2.0 | 1142 | $994 | $0.87 | 25d | 6 | 0.43mi |
HOA detail condo
- Monthly dues
- $195 · $2,340/yr
- Assessments
- None detected in remarks — confirm with the listing agent.
Listing history 31 events
-
2026-06-17status $109,500 Pending 425 DOM
-
2026-06-16days on market $109,500 Active 425 DOM
-
2026-06-15days on market $109,500 Active 424 DOM
-
2026-06-14days on market $109,500 Active 422 DOM
-
2026-06-10days on market $109,500 Active 419 DOM
-
2026-06-09days on market $109,500 Active 418 DOM
-
2026-06-08days on market $109,500 Active 417 DOM
-
2026-06-07days on market $109,500 Active 416 DOM
-
2026-06-02days on market $109,500 Active 411 DOM
-
2026-06-01days on market $109,500 Active 410 DOM
-
2026-05-31days on market $109,500 Active 409 DOM
-
2026-05-30days on market $109,500 Active 408 DOM
-
2026-02-26price $109,500
-
2026-02-26status Active
-
2026-01-29status Pending
-
2025-09-11price $114,000
-
2025-03-20$115,000 Active
-
2024-09-05$139,900 Active
-
2024-07-22historical $1,400
-
2024-05-08historical
-
2024-04-23$1,400
-
2024-03-30historical $1,400
-
2024-03-09price $167,000
-
2023-12-21$1,400
-
2023-10-24$170,000 Active
-
2022-06-03soldstatus $99,000
-
2022-04-29soldstatus $99,000
-
2022-03-18$99,000
-
2012-07-02soldstatus $45,000
-
2012-05-01soldstatus $24,500
-
1996-11-01soldstatus $34,000
ⓘ Source: listings_history table (triggers on properties + properties_extension) + one-shot
backfill from property_details.listing_events for pre-trigger history.
Tax reassessment forecast FL · Resets to sale price
- Current annual tax
- $899 · $75/mo
- Projected year-2 tax
- $909 · $76/mo
- Expected delta
- +$10/yr (+$1/mo · 1.1%)
ⓘ Screening estimate from a state-policy table — verify with the county assessor before closing.
Climate risk First Street
- Flood 1/10 Low FEMA zone X (unshaded) · 0% chance over 30 yrs
- Wildfire 4/10 Moderate
- Heat 8/10 Severe 7 d/yr ≥108°F today · 22 d/yr by 30 yrs out
- Wind 10/10 Extreme 99% chance of damaging wind over 30 yrs
- Air quality 2/10 Low 2 unhealthy d/yr today · 2 by 30 yrs out
Nearby sold comps map
Loading sold comps map…
Walkable amenities ~0.75 mi
Loading nearby amenities…
Taxation est. · year 1
- Rental income
- $13,800
- − Mortgage interest
- −$6,134
- − Property taxes
- −$899
- − Insurance
- −$548
- − Repairs & maintenance
- −$1,104
- − Management
- −$1,104
- − HOA
- −$2,340
- − Depreciation
- −$3,185
- Taxable loss
- −$1,514
- Est. tax savings @ 24.0%
- +$363
- After-tax cash flow
- $588/yr
For passive investors: Depreciation is non-cash, so a rental often shows a tax loss while cash-flowing — sheltering income. Rental losses are passive: they offset passive income freely, and up to $25,000/yr can offset ordinary (W-2) income if you actively participate and your MAGI is under $100k (phasing out to $0 by $150k); unused losses carry forward. On sale, claimed depreciation is recaptured at up to 25%, and gains may owe capital-gains tax (a 1031 exchange can defer both). Figures are a year-1 estimate at your 24.0% rate — not tax advice; consult a CPA.
Schools (NCES district)
- District
- Highlands
- NCES district ID
- 1200840
- Math proficiency
- 45% ▼ -7.00%
- Reading proficiency
- 43% ▼ -3.00%
- Median HH income
- $35,276
- Composite
- 36.42/100
- National rank
- #4672
- State rank
- #54 of 73 in FL
Livability — Avon Park
- Score
- 71/100
- State rank
- #407
- US rank
- #7205
Category grades
Schools grade is shown separately in the Schools card above.
Census & demographics
- Census place
- Avon Park, FL
- County
- Highlands County · 98,898 people
- City population
- 25,501
- Metro
- Sebring-Avon Park, FL
- Population (ZIP)
- 25,501
- Household income
- $46,949
- Rent vs Own
- Severe rent burden
- 691.0
Population outlook (Highlands County) Hauer SSP2
- Today (2025)
- 99,674 people
- By 2030
- 99,615 · -0.1%
- By 2040
- 99,342 · -0.3%
- By 2050
- 98,242 · -1.4%
- By 2075
- 93,291 · -6.4%
- By 2100
- 79,894 · -19.8%
Race, ethnicity, and origin ACS 2023
- Neighborhood character
- Diverse neighborhood (Simpson 0.64)
- Race & ethnicity
- White 51% Hispanic / Latino 27% Black 17% Two or more races 11% Asian 1%
- Hispanic origin (detail)
- Mexican 8% Puerto Rican 13% Cuban 2%
- Common ancestry
- Slovak 2% Lithuanian 2% Iranian 1%
- Foreign-born
- 10% · Canada, Vietnam, Guatemala
- Languages at home
- 74% English-only · Spanish 24% Tagalog/Filipino 1%
Political lean MEDSL · Highlands
- 2024 margin
- Solid R (+40.8) · D 29.3% · R 70.1%
- 2008→2024 swing
- -22.7pp toward R · 2008: -18.1pp · 2024: -40.8pp
- All cycles
- 2024: R+40.8 2020: R+34.4 2016: R+32.0 2012: R+23.0 2008: R+18.1
Not yet ingested
- Civics
- —
Market trends
- HPI YoY
- ▼ -98.54%
- Current HPI
- 281.8067
- Rent YoY
- —
- Metro
- Sebring-Avon Park, FL
- State GDP YoY
- ▲ 3.28%
- F500 in state
- 36
Industry mix (Fortune 500 HQ in FL)
| Industry | F500 HQs | Revenue |
|---|---|---|
| Industrial Technology | 2 | $29B |
|
||
| Insurance | 2 | $17B |
|
||
| Retail | 1 | $60B |
|
||
| Technology Distribution | 1 | $58B |
|
||
| Homebuilding | 1 | $35B |
|
||
| Technology Manufacturing | 1 | $35B |
|
||
Price history
+222.1% since first listed19 events — show timeline
- 2026-02-26 Price Changed $109,500 Stellar MLS as Distributed by MLS Grid
- 2026-02-26 Relisted — Stellar MLS as Distributed by MLS Grid
- 2026-01-29 Pending — Stellar MLS as Distributed by MLS Grid
- 2025-09-11 Price Changed $114,000 Stellar MLS as Distributed by MLS Grid
- 2025-03-20 Listed $115,000 Stellar MLS as Distributed by MLS Grid
- 2024-09-05 Listed $139,900 Stellar MLS as Distributed by MLS Grid
- 2024-07-22 Rental Removed $1,400 STELLARMLS
- 2024-05-08 Listing Removed — Stellar MLS as Distributed by MLS Grid
- 2024-04-23 Listed for Rent $1,400 STELLARMLS
- 2024-03-30 Rental Removed $1,400 STELLARMLS
- 2024-03-09 Price Changed $167,000 Stellar MLS as Distributed by MLS Grid
- 2023-12-21 Listed for Rent $1,400 STELLARMLS
- 2023-10-24 Listed $170,000 Stellar MLS as Distributed by MLS Grid
- 2022-06-03 Sold (Public Records) $99,000 Public Records
- 2022-04-29 Sold (MLS) $99,000 HAOR as distributed by MLS GRID
- 2022-03-18 Listed $99,000 HAOR as distributed by MLS GRID
- 2012-07-02 Sold (Public Records) $45,000 Public Records
- 2012-05-01 Sold (Public Records) $24,500 Public Records
- 1996-11-01 Sold (Public Records) $34,000 Public Records
Property tax history
+14.7%/yrLatest (2025): $899 · +10.1% YoY. Source: county tax records.
Cash-flow waterfall
monthlySold comps — $/sqft
last 12 mo · ≤1 miLoading sold comps…