2721 Palo Verde Ct · Indianapolis city (balance), IN
Flood risk 1/10 · Minimal
- FEMA flood zone
- X (unshaded)
- Chance of flooding over 30 yrs
- 0.0%
- Est. flood insurance / yr
- $507 – $1,088
Fire risk 1/10 · Minimal
- Est. fire insurance / yr
- $717 – $1,331
Heat risk 4/10 · Minor
- Hot days now (above 101°F)
- 7 days/yr
- Hot days in 30 yrs
- 19 days/yr
Wind risk 2/10 · Minimal
- Chance of severe wind over 30 yrs
- 1.0%
Air-quality risk 2/10 · Minimal
- Unhealthy air days now
- 2 days/yr
- Unhealthy air days in 30 yrs
- 2 days/yr
Risk factors via First Street. Map © Google.
Why this score? — see what drove the C+ grade
The composite is a weighted blend of 9 inputs, each scored 0–100. Each bar is that input's sub-score; the figure is the points it added to the 100-point composite (weight × sub-score).
- Cash flow +26.7/30.0
- DSCR +9.2/10.0
- 1% rule +8.6/10.0
- ARV discount +7.5/15.0
- Schools +3.5/10.0
- Rent growth +3.1/5.0
- Livability +2.5/5.0
- Condition / age +2.5/5.0
- Appreciation +0.0/10.0
$119,000
🖨 Deal sheet (PDF) 📄 Offer letter ✓ Due diligence
Listing remarks MLS
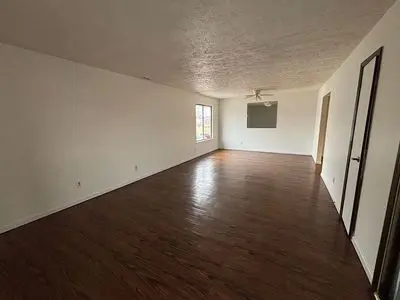
1544 sqft, 3BR plus den, on bus line, pool and tennis court, patroled, club house. Resturants, check cashing, mall, drug store and gas with in walking distance. Great income producing property. Water and trash included in association fees. Condo and appliances not warranted. Huge master closet.
Key facts
- Updated condo
- Walk-in closet
- Kitchen updates
Tags
Property features AI
Exterior
- Home design: Built in 1978
- Exterior features: Located in the Perry Township subdivision
Interior
- Interior features: Living area of 1,544
Neighborhood map
What this means for you Summary
Snapshot
- This is a 3-bed/1.0-bath condo listed at $119k.
Deal economics
- At list price, monthly cash flow is $323 ($4k/yr) — positive.
- The deal already cash-flows at list — no discount required.
- Meets the 1% rule at list price ($2k rent vs $119k).
- Cap rate 9.5% vs local median 4.4% in Indianapolis city (balance) — top-decile yield for the area; either an underpriced asset or a hidden risk that comps aren't pricing in. Stress-test before assuming the spread holds.
Location & tenants
- Location reads: area grade C — affects rentability + tenant quality, not the cash-flow math above.
- Perry Township Schools (urban): math 36% / reading 45% proficiency, ranked #138 of 301 in IN (top 46%) — families likely to look elsewhere, expect single-tenant / working-renter base with shorter leases.
- Zoned schools: Winchester Village Elementary (math 28% / reading 26%, grade F, #737 of 994 statewide, top 76%, 619 students, 85% FRL); Southport Middle School (math 22% / reading 40%, grade F, #201 of 330 statewide, top 61%, 1,194 students, 72% FRL); Southport High School (math 25% / reading 53%, grade F, #235 of 369 statewide, top 65%, 2,355 students, 70% FRL) — zoned schools average 76% FRL vs 54% district-wide (22 pts higher); higher-poverty schools than district average — tighter screening recommended.
- Market conditions: Rents rising (+2.5%/yr); 248 active listings in the ZIP; 22 comparable units currently listed for rent nearby; rentals leasing fast (median 12d on market — plan ~1-2 weeks tenant-placement turnaround); 1,906 units permitted in Marion County in 2024 (621 in 5+ unit buildings).
- This rent runs 36% of the median local income ($54k/yr) — at the standard rent-burdened threshold; future hikes will face affordability resistance.
Forward outlook
- Local home prices are declining (-3.0%/yr); year-one equity from $823 of loan paydown is wiped out by about $4k of value loss. Plan a longer hold.
- Marion County population projected at +18% by 2050 — long-run rental-demand tailwind backs the buy-and-hold thesis.
Negotiation context
- Only 12 days on market — expect competitive offers; lowballing is unlikely to land.
- 2 sale attempts since 10y ago with the ask held roughly flat each time — persistent listings suggest the price (not the market) is what's stuck; bring a comps-based counter.
- Current owner paid $42k; list at $119k implies a 183% gain — meaningful room to come down on a strong offer.
Questions for the listing agent
- Built in 1978 — when were the roof, HVAC, electrical panel, plumbing, and water heater last replaced?
- What does the HOA fee cover, when was the last increase, and are there any pending special assessments or reserve-fund shortfalls?
- Any open or pending special assessments — roof, HVAC, plumbing, elevator, façade? What's the per-unit balance and payoff schedule, and is the seller paying it off at close or rolling it to the buyer?
- Is there a deadline driving the sale (1031 exchange, divorce, estate, relocation)? That informs how much negotiation room exists.
- What's the average days-on-market for RENTAL listings here right now (not sales)? A rising rental-DOM trend means longer vacancies and softer asking-rent achievability than the comps imply.
- What's the recent tenant-quality profile in this submarket — average credit score on applications, eviction rate, late-payment / NSF rate, and stable-employment percentage? A property-management company in the area should have these aggregated.
- How much new apartment / multifamily construction is in the pipeline within 1–3 miles? Heavy new supply (>2% of stock underway) typically softens rents 12–24 months out; light construction supports rent growth.
Investment metrics
- 1% rule
- 1.36% ✓
- Cap rate
- 9.55%
- Cash-on-cash
- 11.62%
- DSCR
- 1.52
- GRM
- 6.1
CMA / ARV
No comps found within radius.
Projected returns pro-forma
-3.0% appreciation · 2.46% rent growth · sell at horizon
- IRR
- 0.4%
- Equity multiple
- 1.02×
- Total profit
- $505
- Equity at exit
- $17,743
- IRR
- 9.5%
- Equity multiple
- 1.71×
- Total profit
- $23,791
- Equity at exit
- $10,289
Cash invested: $33,320 (down + closing). Projections, not guarantees.
Landlord ↔ Tenant lean methodology
- Overall (STATE)
- 90 Strongly Landlord-Friendly
- State Indiana
- 90 Strongly Landlord-Friendly · R+11
- County
- — inherits STATE
- City
- — inherits STATE
ZIP-level market 46227
- Rents YoY
- 2.5%
- Active inventory
- 248
- Price-to-rent
- 6.1×
Monthly cashflow live
- Estimated rent
- $1,624 high interval (Pro) →
- Mortgage (P&I)
- −$624
- Tax from tax record
- −$108 /mo · $1,301/yr
- Insurance
- −$50
- HOA est. from 1 same-building comp
- −$178
- Vacancy / Maint / Mgmt
- −$341
- Net cashflow
- $323
Break-even live
Sensitivity live
| Price | -10% $390 | -5% $356 | +0% $323 | +5% $289 | +10% $255 |
|---|---|---|---|---|---|
| Rent | -10% $194 | -5% $259 | +0% $323 | +5% $387 | +10% $451 |
| Rate | -1.0pp $383 | -0.5pp $353 | base $323 | +0.5pp $292 | +1.0pp $261 |
UW: 25.0% down · 7.5% · 30yr · 1.5% tax · 5.0% vac · 8.0% maint · 8.0% mgmt
Financing live
Cash to close
- Down payment
- $29,750
- Closing costs
- $3,570
- Reserves months
- —
- Total cash needed
- —
Loan-product check · same deal, 3 products live
Conventional
25% down · 7.5% · 30yr
- Down + closing
- —
- Monthly P&I
- —
- Monthly cashflow
- —
- DSCR
- —
- Eligible?
- —
Personal DTI + credit; lowest rate.
DSCR
20% down · 8.5% · 30yr
- Down + closing
- —
- Monthly P&I
- —
- Monthly cashflow
- —
- DSCR
- —
- Eligible?
- —
No personal income docs; deal must DSCR.
Hard money
10% down · 12.0% · 12mo
- Down + closing
- —
- Monthly P&I
- —
- Monthly cashflow
- —
- DSCR
- —
- Eligible?
- —
Short-term bridge; refi at stabilization.
Rent comps 22 comps
| Address | Beds | Baths | Sqft | Rent | $/sqft | DOM | Units | Dist |
|---|---|---|---|---|---|---|---|---|
| 8213 Zona Dr Indianapolis, IN | 1.0–3.0 | 1.0–1.5 | 935 | $1,480 | $1.58 | 3d | 16 | 0.36mi |
| 2816 E County Line Rd Indianapolis, IN | 2.0 | 1.0 | 1265 | $910 | $0.72 | 25d | 1 | 0.41mi |
| 8631 Pleasant Creek Ct Indianapolis, IN | 3.0 | 2.0 | 1120 | $1,706 | $1.52 | 9d | 1 | 0.46mi |
| 3503 Pleasant Lake Dr Indianapolis, IN | 3.0 | 1.0 | 1064 | $1,615 | $1.52 | 14d | 1 | 0.58mi |
| 1703 E 12 Rd Stop 12 Indianapolis, IN | 3.0 | 2.0 | 1840 | $1,899 | $1.03 | 12d | 1 | 0.58mi |
| 8126 Xenia Dr Indianapolis, IN | 3.0 | 2.0 | 1176 | $4,500 | $3.83 | 0d | 1 | 0.59mi |
| 7909 Southfield Dr Indianapolis, IN | 3.0 | 2.0 | 1056 | $1,445 | $1.37 | 9d | 1 | 0.60mi |
| 3624 Fredricksburg Dr Indianapolis, IN | 3.0 | 2.5 | 1904 | $1,776 | $0.93 | 3d | 1 | 0.65mi |
| 3717 Piermont Dr Indianapolis, IN | 1.0–3.0 | 1.0–2.0 | 1038 | $1,730 | $1.67 | 4d | 23 | 0.69mi |
| 1039 N Paz Dr Greenwood, IN | 1.0–3.0 | 1.0–2.0 | 925 | $1,434 | $1.55 | 0d | 9 | 0.76mi |
| 1933 Lisa Walk Dr Indianapolis, IN | 3.0 | 2.0 | 1374 | $1,670 | $1.22 | 16d | 1 | 0.83mi |
| 14 Greenwood Trl N Greenwood, IN | 2.0 | 1.5 | 1088 | $1,275 | $1.17 | 16d | 1 | 0.90mi |
| 7913 Ella Dobbs Ln Indianapolis, IN | 1.0–3.0 | 1.0–2.0 | 1021 | $1,650 | $1.62 | 25d | 1 | 0.92mi |
| 968 Greenwood Trl W Greenwood, IN | 2.0 | 2.0 | 1088 | $1,475 | $1.36 | 14d | 1 | 0.93mi |
| 921 Parliament Pl Greenwood, IN | 1.0–3.0 | 1.0–2.0 | 994 | $1,525 | $1.53 | 4d | 30 | 0.95mi |
| 49 Trails End Unit 1 Greenwood, IN | 2.0 | 1.5 | 1088 | $1,450 | $1.33 | 0d | 1 | 0.96mi |
| 1542 Citrin Pl Unit 1538 Indianapolis, IN | 3.0 | 2.5 | 1299 | $1,755 | $1.35 | 18d | 1 | 1.10mi |
| 1542 Citrin Pl Indianapolis, IN | 3.0 | 2.5 | 1299 | $1,755 | $1.35 | 4d | 1 | 1.10mi |
| 1043 Mikes Way Greenwood, IN | 3.0 | 2.0 | 1090 | $1,650 | $1.51 | 45d | 1 | 1.30mi |
| 1009 Lismore Ln Indianapolis, IN | 1.0–2.0 | 1.0–2.0 | 875 | $1,365 | $1.56 | 25d | 1 | 1.32mi |
| 614 Park Madison Dr Greenwood, IN | 2.0 | 2.0 | 1150 | $1,250 | $1.09 | 12d | 1 | 1.34mi |
| 4545 Scarlet Oak Way Indianapolis, IN | 1.0–3.0 | 1.0–2.0 | 1101 | $1,767 | $1.60 | 0d | 15 | 1.41mi |
HOA detail condo
- Monthly dues
- $0 · $0/yr
- Likely covers
- watertrashgaspool
- Assessments
- None detected in remarks — confirm with the listing agent.
Listing history 8 events
-
2026-06-21days on market $119,000 Active 12 DOM
-
2026-06-18days on market $119,000 Active 9 DOM
-
2026-06-17days on market $119,000 Active 8 DOM
-
2026-06-16days on market $119,000 Active 7 DOM
-
2026-06-15days on market $119,000 Active 6 DOM
-
2026-06-13days on market $119,000 Active 4 DOM
-
2026-06-10remarks 699-char remark
-
2026-06-10$119,000 Active 1 DOM
ⓘ Source: listings_history table (triggers on properties + properties_extension) + one-shot
backfill from property_details.listing_events for pre-trigger history.
Tax reassessment forecast IN · Partial reset (capped growth)
- Current annual tax
- $1,301 · $108/mo
- Projected year-2 tax
- $1,301 · $108/mo
- Expected delta
- $0/yr ($0/mo · 0.0%)
ⓘ Screening estimate from a state-policy table — verify with the county assessor before closing.
Climate risk First Street
- Flood 1/10 Low FEMA zone X (unshaded) · 0% chance over 30 yrs
- Wildfire 1/10 Low
- Heat 4/10 Moderate 7 d/yr ≥101°F today · 19 d/yr by 30 yrs out
- Wind 2/10 Low 100% chance of damaging wind over 30 yrs
- Air quality 2/10 Low 2 unhealthy d/yr today · 2 by 30 yrs out
Nearby sold comps map
Loading sold comps map…
Walkable amenities ~0.75 mi
Loading nearby amenities…
Taxation est. · year 1
- Rental income
- $19,485
- − Mortgage interest
- −$6,666
- − Property taxes
- −$1,301
- − Insurance
- −$595
- − Repairs & maintenance
- −$1,559
- − Management
- −$1,559
- − HOA
- −$2,136
- − Depreciation
- −$3,462
- Taxable income
- $2,208
- Est. tax owed @ 24.0%
- −$530
- After-tax cash flow
- $3,343/yr
For passive investors: Depreciation is non-cash, so a rental often shows a tax loss while cash-flowing — sheltering income. Rental losses are passive: they offset passive income freely, and up to $25,000/yr can offset ordinary (W-2) income if you actively participate and your MAGI is under $100k (phasing out to $0 by $150k); unused losses carry forward. On sale, claimed depreciation is recaptured at up to 25%, and gains may owe capital-gains tax (a 1031 exchange can defer both). Figures are a year-1 estimate at your 24.0% rate — not tax advice; consult a CPA.
Schools (NCES district)
- District
- Perry Township Schools
- NCES district ID
- 1808820
- Math proficiency
- 36% ▼ -13.00%
- Reading proficiency
- 45% ▼ -6.00%
- Median HH income
- $47,170
- Composite
- 34.61/100
- National rank
- #5153
- State rank
- #138 of 301 in IN
Livability — Indianapolis city (balance)
No livability data for this city. (Only ~50 U.S. cities are tracked.)
Census & demographics
- Census place
- Indianapolis city (balance), IN
- County
- Marion County · 998,460 people
- City population
- 881,119
- Metro
- Indianapolis-Carmel-Anderson, IN
- Population (ZIP)
- 57,587
- Household income
- $53,629
- Rent vs Own
- Severe rent burden
- 3583.0
Population outlook (Marion County) Hauer SSP2
- Today (2025)
- 1,025,572 people
- By 2030
- 1,065,727 · +3.9%
- By 2040
- 1,141,577 · +11.3%
- By 2050
- 1,208,920 · +17.9%
- By 2075
- 1,367,288 · +33.3%
- By 2100
- 1,438,201 · +40.2%
Race, ethnicity, and origin ACS 2023
- Neighborhood character
- Diverse neighborhood (Simpson 0.59)
- Race & ethnicity
- White 61% Asian 12% Black 11% Hispanic / Latino 10% Two or more races 8%
- Hispanic origin (detail)
- Mexican 8%
- Common ancestry
- Italian 2% Slovak 2% Lithuanian 1%
- Foreign-born
- 17% · Philippines, Canada, Vietnam
- Languages at home
- 79% English-only · Other Asian/Pacific 9% Spanish 7% Other Indo-European 1%
Political lean MEDSL · Marion
- 2024 margin
- Strong D (+27.7) · D 63.0% · R 35.3% · Other 1.7%
- 2008→2024 swing
- -0.7pp no change · 2008: 28.4pp · 2024: 27.7pp
- All cycles
- 2024: D+27.7 2020: D+29.1 2016: D+22.8 2012: D+22.2 2008: D+28.4
Not yet ingested
- Civics
- —
Market trends
- HPI YoY
- ▼ -260.49%
- Current HPI
- 276.8271
- Rent YoY
- ▲ 2.46%
- Metro
- Indianapolis-Carmel-Anderson, IN
- State GDP YoY
- ▲ 2.90%
- F500 in state
- 18
Industry mix (Fortune 500 HQ in IN)
| Industry | F500 HQs | Revenue |
|---|---|---|
| Industrial Machinery | 2 | $37B |
|
||
| Healthcare | 1 | $177B |
|
||
| Pharmaceuticals | 1 | $45B |
|
||
| Metals / Steel | 1 | $18B |
|
||
| Agriculture | 1 | $17B |
|
||
| Packaging | 1 | $12B |
|
||
Price history
+89.2% since first listed9 events — show timeline
- 2026-06-10 Listed $119,000 FSBO.com
- 2017-04-07 Sold (MLS) $42,000 MIBOR as Distributed by MLS Grid
- 2017-03-29 Pending — MIBOR as Distributed by MLS Grid
- 2017-02-22 Price Changed $46,290 MIBOR as Distributed by MLS Grid
- 2017-01-18 Price Changed $48,735 MIBOR as Distributed by MLS Grid
- 2016-12-06 Price Changed $51,300 MIBOR as Distributed by MLS Grid
- 2016-11-15 Price Changed $54,000 MIBOR as Distributed by MLS Grid
- 2016-09-28 Price Changed $57,900 MIBOR as Distributed by MLS Grid
- 2016-08-09 Listed $62,900 MIBOR as Distributed by MLS Grid
Property tax history
-0.5%/yrLatest (2025): $1,301 · +2.4% YoY. Source: county tax records.
Cash-flow waterfall
monthlySold comps — $/sqft
last 12 mo · ≤1 miLoading sold comps…