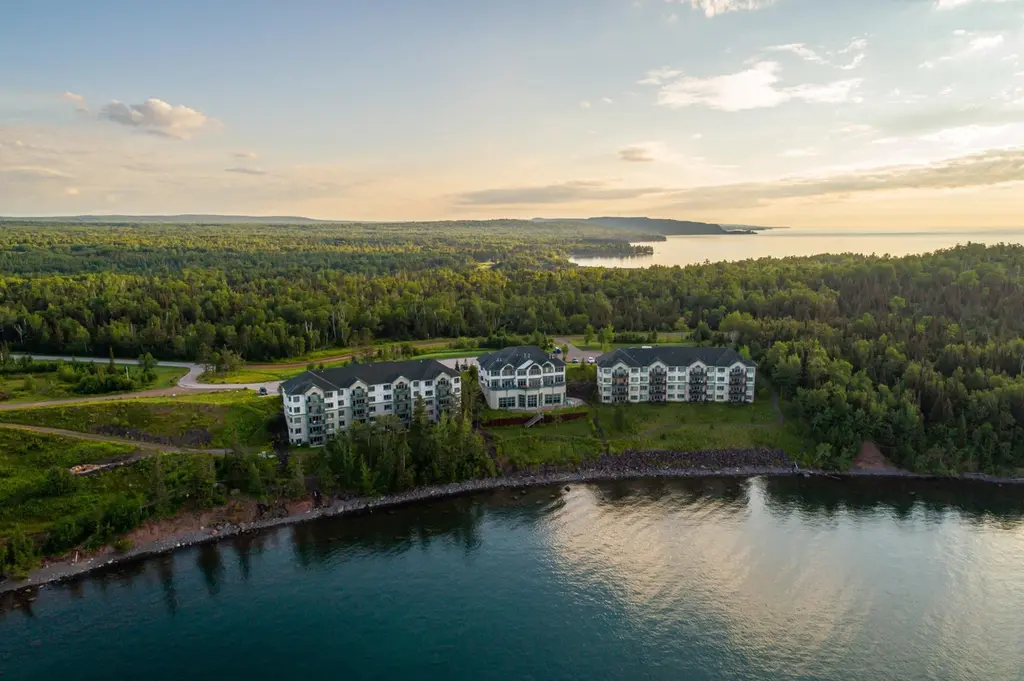
 🌊 Lakefront
1412 #3-206a N Burlington Rd Unit 3-206 · Two Harbors, MN
Flood risk 1/10 · Minimal
- FEMA flood zone
- —
- Chance of flooding over 30 yrs
- 0.0%
- Est. flood insurance / yr
- —
Fire risk 4/10 · Minor
- Est. fire insurance / yr
- $888 – $1,650
Heat risk 1/10 · Minimal
- Hot days now (above 88°F)
- 7 days/yr
- Hot days in 30 yrs
- 13 days/yr
Wind risk 1/10 · Minimal
- Chance of severe wind over 30 yrs
- —
Air-quality risk 1/10 · Minimal
- Unhealthy air days now
- 0 days/yr
- Unhealthy air days in 30 yrs
- 0 days/yr
Risk factors via First Street. Map © Google.
Why this score? — see what drove the B+ grade
The composite is a weighted blend of 9 inputs, each scored 0–100. Each bar is that input's sub-score; the figure is the points it added to the 100-point composite (weight × sub-score).
- Cash flow +30.0/30.0
- ARV discount +14.8/15.0
- 1% rule +10.0/10.0
- DSCR +10.0/10.0
- Condition / age +4.8/5.0
- Livability +4.0/5.0
- Schools +3.8/10.0
- Rent growth +2.5/5.0
- Appreciation +0.0/10.0
$59,000
🖨 Deal sheet (PDF) 📄 Offer letter ✓ Due diligence
Listing remarks
Sale price is for a 1/8 interval share of this unit. Are you looking for a beautiful, serene, and luxurious condo along Minnesota's Famous North Shore? Look no further! Burlington Bay is selling condos offering stunning views of Lake Superior and a luxurious living experience that you won't find anywhere else along the Shore. Inventory available along the North Shore is extremely low (at times non-existent). This is a rare opportunity to own a piece of paradise in one of the most desirable locations in the Midwest. The condos feature spacious living areas, modern appliances, and high-end finishes that will make you feel like royalty. Enjoy amenities such as an indoor pool, indoor and outdoo
Key facts
- Fitness center
- Sauna
- Indoor pool
Tags
Property features AI
Finance
- Other: Annual taxes listed (not included per instructions)
- HOA & community: Association: Superior Shores Resort; Monthly association fee of $93.75; HOA covers controlled access, hazard insurance, lawn care, grounds maintenance, parking, professional management, recreation facilities, shared amenities, and snow removal; Shared community rooms including amusement/party room, community room, exercise room and other shared spaces
Exterior
- Parking: Guest parking; Open parking lot
- Security: Controlled access (included in HOA)
- Utilities: City water; City sewer; Electric and natural gas
- Home design: Residential property; Attached property; Four-or-more-level split; Entry/main level finished (main level finished area listed); Above-grade finished living area
- Construction: Foundation dimensions 46x36 and 16x10; Foundation area listed; Stucco construction
- Exterior features: Stucco exterior; Lakefront on Lake Superior; No road between waterfront and home; Irregular lot shape
Interior
- Kitchen: Dishwasher; Range; Refrigerator; Freezer; Microwave; Disposal
- Bedrooms: 2 bedrooms
- Bathrooms: 1 full bathroom; 1 three-quarter bathroom
- Heating & cooling: Forced air heating; Fireplace heating; Wall unit cooling
- Interior features: Dishwasher; Disposal; Freezer; Microwave; Range; Refrigerator; Accessible elevator installed; Door lever handles; No internal stairs; Two fireplaces
Neighborhood map
What this means for you Summary
Snapshot
- This is a 2-bed/2.0-bath single-family listed at $59k. Condition is rated excellent.
Deal economics
- At list price, monthly cash flow is $482 ($6k/yr) — positive.
- The deal already cash-flows at list — no discount required.
- Meets the 1% rule at list price ($1k rent vs $59k).
- Recommended offer: $57k (3.0% below list) — sets the bar for market timing.
Location & tenants
- Location reads 81/100 on livability (#62 in MN, #1,444 nationally) — a professional / high-income tenant draw. Strengths: crime A+, cost of living A+, housing A+; Watch: amenities F, commute F.
- Lake Superior Public School District (rural): math 34% / reading 53% proficiency, ranked #191 of 301 in MN (top 64%) — families likely to look elsewhere, expect single-tenant / working-renter base with shorter leases.
- Market conditions: 85 active listings in the ZIP; 81 units permitted in Lake County in 2024 (0 in 5+ unit buildings).
Forward outlook
- Local home prices are declining (-3.0%/yr); year-one equity from $408 of loan paydown is wiped out by about $2k of value loss. Plan a longer hold.
- Lake County population projected at -26% by 2050 — secular population decline; favor cash flow + early exit over multi-decade hold.
- At projected returns (-3.0% appreciation + 3.0% rent growth), your $17k cash investment doubles in ~4 years — after that, you're playing with house money.
Negotiation context
- It's been on market 59 days — a 3% lower offer ($57k) is reasonable based on typical stale-listing flexibility.
Questions for the listing agent
- It's been on market 59 days. Have you received any prior offers? Is the seller open to a 3% concession, seller financing, or rate buy-down credit?
- What does the HOA fee cover, when was the last increase, and are there any pending special assessments or reserve-fund shortfalls?
- Is there a deadline driving the sale (1031 exchange, divorce, estate, relocation)? That informs how much negotiation room exists.
- Schools are B-rated — typically a magnet for longer-tenancy family renters. What's the average tenant stay here, and is there a school-zone premium baked into asking?
- This sits on a lake — are riparian / water-frontage rights deeded with the parcel? Any dock permits, shoreline easements, or HOA water-use restrictions?
- What's the documented flood / surge / shoreline-erosion history here (FEMA AND non-FEMA — e.g., storm surge, creek backup, septic-field saturation)?
- Any water-quality or seasonal algae-bloom issues that affect tenant satisfaction or short-term-rental demand?
- What's the average days-on-market for RENTAL listings here right now (not sales)? A rising rental-DOM trend means longer vacancies and softer asking-rent achievability than the comps imply.
- What's the recent tenant-quality profile in this submarket — average credit score on applications, eviction rate, late-payment / NSF rate, and stable-employment percentage? A property-management company in the area should have these aggregated.
- How much new for-sale + rental construction is in the pipeline within 1–3 miles? Heavy new supply typically softens prices + rents 12–24 months out; constrained supply supports both.
Investment metrics
- 1% rule
- 2.11% ✓
- Cap rate
- 16.10%
- Cash-on-cash
- 35.03%
- DSCR
- 2.56
- GRM
- 4.0
CMA / ARV
- ARV (median comp)
- $70,413
- List price
- $59,000
- Delta
- -16.21%
- Verdict
- UNDERPRICED
- Comps
- 4 within 1.0 mi
Show comp detail 12 sales within ~0.75 mi
| Address | Dist | Beds/Ba | Sqft | Sold | Price | $/sf | Match |
|---|---|---|---|---|---|---|---|
| 819 5th Ave | 1.27mi | 2/1.0 | 1,250 (0%) | 1mo | $212,000 | $170 | 60 |
| 135 1st Ave | 0.89mi | 2/2.0 | 1,204 (-4%) | 7mo | $290,000 | $241 | 53 |
| 836 7th Ave | 1.28mi | 2/1.5 | 1,295 (+4%) | 4mo | $212,000 | $164 | 53 |
| 315 2nd Ave | 0.96mi | 2/1.5 | 1,344 (+8%) | 9mo | $205,000 | $153 | 43 |
| 733 13th Ave | 1.16mi | 3/1.0 (+1) | 1,193 (-5%) | 8mo | $261,500 | $219 | 42 |
| 428 12th Ave | 0.87mi | 3/2.0 (+1) | 1,355 (+8%) | 6mo | $260,000 | $192 | 41 |
| 401 12th Ave | 0.82mi | 3/2.0 (+1) | 1,352 (+8%) | 8mo | $321,000 | $237 | 40 |
| 415 10th Ave | 0.84mi | 3/1.0 (+1) | 1,188 (-5%) | 10mo | $175,000 | $147 | 40 |
| 417 1st Ave | 1.08mi | 2/2.0 | 1,102 (-12%) | 8mo | $190,000 | $172 | 39 |
| 830 8th Ave | 1.25mi | 3/1.5 (+1) | 1,365 (+9%) | 6mo | $190,000 | $139 | 38 |
| 806 5th Ave | 1.25mi | 1/1.0 (-1) | 1,080 (-14%) | 1mo | $165,000 | $153 | 32 |
| 405 10th Ave | 0.82mi | 3/1.0 (+1) | 1,118 (-11%) | 11mo | $258,000 | $231 | 29 |
Match score weights: distance 35% · size 25% · config 20% · recency 20%. Top-matched comps best support the ARV.
Projected returns pro-forma
-3.0% appreciation · 3.0% rent growth · sell at horizon
- IRR
- 30.6%
- Equity multiple
- 2.29×
- Total profit
- $21,230
- Equity at exit
- $8,797
- IRR
- 37.9%
- Equity multiple
- 4.53×
- Total profit
- $58,345
- Equity at exit
- $5,101
Cash invested: $16,520 (down + closing). Projections, not guarantees.
Landlord ↔ Tenant lean methodology
- Overall (STATE)
- 46 Balanced
- State Minnesota
- 46 Balanced · D+2
- County
- — inherits STATE
- City
- — inherits STATE
ZIP-level market 55616
- Active inventory
- 85
- Price-to-rent
- 4.0×
Monthly cashflow live
- Estimated rent
- $1,244 medium interval (Pro) →
- Mortgage (P&I)
- −$309
- Tax est. 1.5%
- −$74 /mo · $885/yr
- Insurance
- −$25
- HOA
- −$93
- Vacancy / Maint / Mgmt
- −$261
- Net cashflow
- $482
Break-even live
Sensitivity live
| Price | -10% $523 | -5% $503 | +0% $482 | +5% $462 | +10% $441 |
|---|---|---|---|---|---|
| Rent | -10% $384 | -5% $433 | +0% $482 | +5% $531 | +10% $581 |
| Rate | -1.0pp $512 | -0.5pp $497 | base $482 | +0.5pp $467 | +1.0pp $451 |
UW: 25.0% down · 7.5% · 30yr · 1.5% tax · 5.0% vac · 8.0% maint · 8.0% mgmt
Financing live
Cash to close
- Down payment
- $14,750
- Closing costs
- $1,770
- Reserves months
- —
- Total cash needed
- —
Loan-product check · same deal, 3 products live
Conventional
25% down · 7.5% · 30yr
- Down + closing
- —
- Monthly P&I
- —
- Monthly cashflow
- —
- DSCR
- —
- Eligible?
- —
Personal DTI + credit; lowest rate.
DSCR
20% down · 8.5% · 30yr
- Down + closing
- —
- Monthly P&I
- —
- Monthly cashflow
- —
- DSCR
- —
- Eligible?
- —
No personal income docs; deal must DSCR.
Hard money
10% down · 12.0% · 12mo
- Down + closing
- —
- Monthly P&I
- —
- Monthly cashflow
- —
- DSCR
- —
- Eligible?
- —
Short-term bridge; refi at stabilization.
HOA detail
- Monthly dues
- $93 · $1,116/yr
- Likely covers
- pool
Listing history 16 events
-
2026-06-21days on market $59,000 Active 59 DOM
-
2026-06-18days on market $59,000 Active 56 DOM
-
2026-06-17days on market $59,000 Active 55 DOM
-
2026-06-16days on market $59,000 Active 54 DOM
-
2026-06-15days on market $59,000 Active 53 DOM
-
2026-06-14days on market $59,000 Active 51 DOM
-
2026-06-13days on market $59,000 Active 50 DOM
-
2026-06-10days on market $59,000 Active 48 DOM
-
2026-06-09days on market $59,000 Active 47 DOM
-
2026-06-08days on market $59,000 Active 46 DOM
-
2026-06-07days on market $59,000 Active 45 DOM
-
2026-06-02days on market $59,000 Active 40 DOM
-
2026-06-01days on market $59,000 Active 39 DOM
-
2026-05-31days on market $59,000 Active 38 DOM
-
2026-05-30days on market $59,000 Active 37 DOM
-
2026-04-23$59,000 Active 1187-char remark
ⓘ Source: listings_history table (triggers on properties + properties_extension) + one-shot
backfill from property_details.listing_events for pre-trigger history.
Climate risk First Street
- Flood 1/10 Low 0% chance over 30 yrs
- Wildfire 4/10 Moderate
- Heat 1/10 Low 7 d/yr ≥88°F today · 13 d/yr by 30 yrs out
- Wind 1/10 Low
- Air quality 1/10 Low 0 unhealthy d/yr today · 0 by 30 yrs out
Nearby sold comps map
Loading sold comps map…
Walkable amenities ~0.75 mi
Loading nearby amenities…
Taxation est. · year 1
- Rental income
- $14,931
- − Mortgage interest
- −$3,305
- − Property taxes
- −$885
- − Insurance
- −$295
- − Repairs & maintenance
- −$1,195
- − Management
- −$1,195
- − HOA
- −$1,116
- − Depreciation
- −$1,716
- Taxable income
- $5,225
- Est. tax owed @ 24.0%
- −$1,254
- After-tax cash flow
- $4,533/yr
For passive investors: Depreciation is non-cash, so a rental often shows a tax loss while cash-flowing — sheltering income. Rental losses are passive: they offset passive income freely, and up to $25,000/yr can offset ordinary (W-2) income if you actively participate and your MAGI is under $100k (phasing out to $0 by $150k); unused losses carry forward. On sale, claimed depreciation is recaptured at up to 25%, and gains may owe capital-gains tax (a 1031 exchange can defer both). Figures are a year-1 estimate at your 24.0% rate — not tax advice; consult a CPA.
Condition & rehab AI · 1 photo
This luxury condo is in excellent condition with stunning views of Lake Superior. It offers a serene and luxurious living experience, making it a rare opportunity in a desirable location.
Value-add opportunities
- Both Interior painting — Fresh paint can enhance the home's appeal and value
- Both Landscaping improvements — Enhanced curb appeal can attract more buyers and renters
- Both Outdoor lighting — Improved lighting can make the property more inviting and safer
Renovation cost estimate screening
Value-add ROI direction
- Both Interior painting — Fresh paint can enhance the home's appeal and value ↑
- Both Landscaping improvements — Enhanced curb appeal can attract more buyers and renters ↑
- Both Outdoor lighting — Improved lighting can make the property more inviting and safer ↑
ⓘ Cost ranges are severity-bucket heuristics (US national rule-of-thumb). Get contractor quotes + a written scope before underwriting a rehab budget.
Schools (NCES district)
- District
- Lake Superior Public School District
- NCES district ID
- 2740740
- Math proficiency
- 34% ▼ -24.00%
- Reading proficiency
- 53% ▼ -9.00%
- Median HH income
- $51,958
- Composite
- 37.51/100
- National rank
- #4399
- State rank
- #191 of 301 in MN
Livability — Two Harbors
- Score
- 81/100
- State rank
- #62
- US rank
- #1444
Category grades
Schools grade is shown separately in the Schools card above.
Census & demographics
- Census place
- Two Harbors, MN
- Population (ZIP)
- 7,277
Population outlook (Lake County) Hauer SSP2
- Today (2025)
- 9,943 people
- By 2030
- 9,437 · -5.1%
- By 2040
- 8,326 · -16.3%
- By 2050
- 7,365 · -25.9%
- By 2075
- 6,008 · -39.6%
- By 2100
- 5,038 · -49.3%
Race, ethnicity, and origin ACS 2023
- Neighborhood character
- Predominantly White (95%)
- Race & ethnicity
- White 95% Two or more races 3% Hispanic / Latino 1%
- Common ancestry
- Portuguese 18% Scottish 4% Romanian 3%
- Foreign-born
- 1% · Canada
- Languages at home
- 99% English-only · Spanish 1%
Political lean MEDSL · Lake
- 2024 margin
- Toss-up / Even · D 51.0% · R 47.1% · Other 1.9%
- 2008→2024 swing
- -18.2pp toward R · 2008: 22.1pp · 2024: 3.9pp
- All cycles
- 2024: D+3.9 2020: D+3.5 2016: D+2.2 2012: D+21.1 2008: D+22.1
Not yet ingested
- Civics
- —
Market trends
- HPI YoY
- ▼ -116.94%
- Current HPI
- 182.619
- Rent YoY
- —
- Metro
- —
- State GDP YoY
- ▲ 2.41%
- F500 in state
- 34
Industry mix (Fortune 500 HQ in MN)
| Industry | F500 HQs | Revenue |
|---|---|---|
| Healthcare | 2 | $407B |
|
||
| Retail | 2 | $150B |
|
||
| Consumer Goods | 2 | $32B |
|
||
| Industrial Machinery | 2 | $6B |
|
||
| Agriculture | 1 | $40B |
|
||
| Healthcare / Medical Devices | 1 | $32B |
|
||
Price history
1 event — show timeline
- 2026-04-23 Listed $59,000 NORTHSTARMLS as Distributed by MLS Grid
Cash-flow waterfall
monthlySold comps — $/sqft
last 12 mo · ≤1 miLoading sold comps…