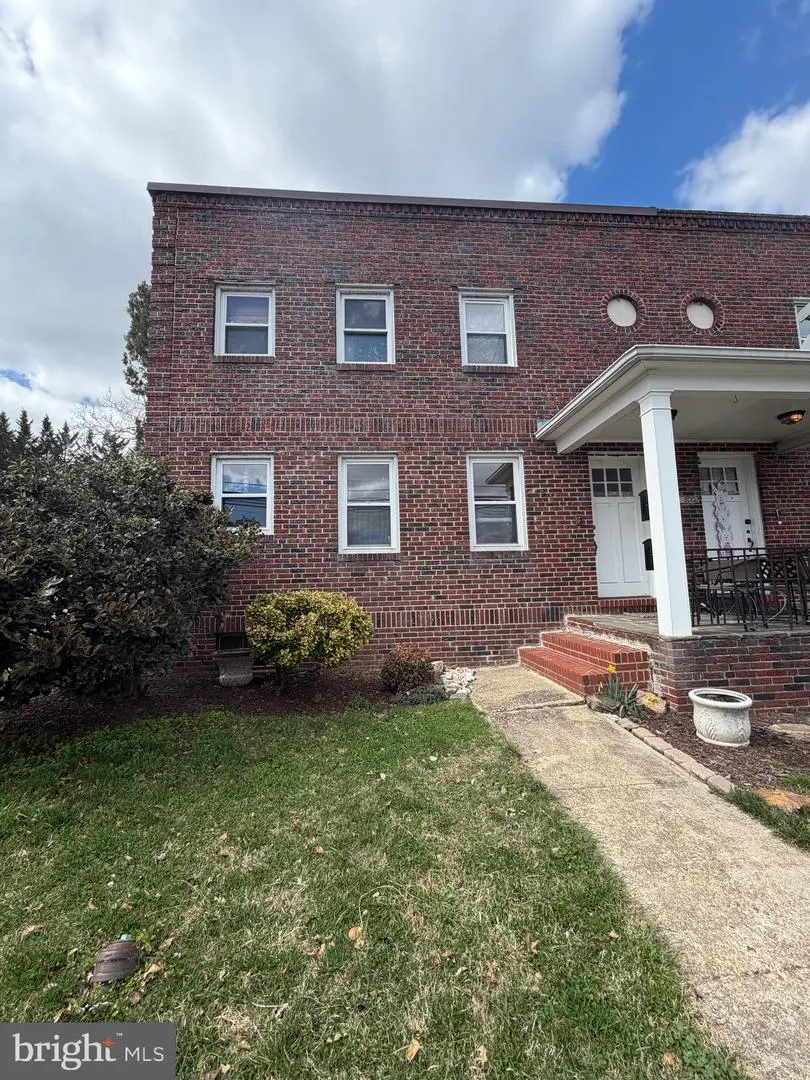
 Duplex
8000 Harford Rd · Parkville, MD
Flood risk 1/10 · Minimal
- FEMA flood zone
- X (unshaded)
- Chance of flooding over 30 yrs
- 0.0%
- Est. flood insurance / yr
- $473 – $860
Fire risk 1/10 · Minimal
- Est. fire insurance / yr
- $755 – $1,403
Heat risk 7/10 · Major
- Hot days now (above 104°F)
- 7 days/yr
- Hot days in 30 yrs
- 15 days/yr
Wind risk 6/10 · Moderate
- Chance of severe wind over 30 yrs
- 27.0%
Air-quality risk 4/10 · Minor
- Unhealthy air days now
- 5 days/yr
- Unhealthy air days in 30 yrs
- 7 days/yr
Risk factors via First Street. Map © Google.
Why this score? — see what drove the C grade
The composite is a weighted blend of 9 inputs, each scored 0–100. Each bar is that input's sub-score; the figure is the points it added to the 100-point composite (weight × sub-score).
- Cash flow +19.6/30.0
- ARV discount +15.0/15.0
- DSCR +6.2/10.0
- 1% rule +4.9/10.0
- Rent growth +4.2/5.0
- Livability +3.9/5.0
- Condition / age +2.5/5.0
- Schools +2.3/10.0
- Appreciation +0.0/10.0
$269,000
🖨 Deal sheet 📄 Offer letter ✓ Due diligence
Multi-family units
County records classify this as Multi-Family (2-4 Unit). Listing-text estimate: 2 units. confirmed
Listing remarks
Well maintained two unit apartment property featuring one - bedroom units plus a den that could be used as a second bedroom. Each unit offers beautiful hardwood floors and updated electrical systems. The property includes off street parking and a recently installed new roof for added peace of mind. Fully rented, making it a great turnkey investment opportunity. End of group location with convenient access to public transportation and walking distance to nearby shopping.
Key facts
- 3,821 sq ft lot
- Parking
- Built 1938
Neighborhood map
What this means for you Summary
Snapshot
- This is a 2 × 1-bed/1.0-bath units multifamily listed at $269k.
Deal economics
- At list price, monthly cash flow is $308 ($4k/yr) — positive. Per door: $154/mo.
- The deal already cash-flows at list — no discount required.
- To meet the 1% rule (rent ≥ 1% of price), the offer needs to be $268k (0.6% below list).
- Recommended offer: $265k (1.5% below list) — sets the bar for market timing.
- Cap rate 7.7% vs local median 5.3% in Parkville — top-decile yield for the area; either an underpriced asset or a hidden risk that comps aren't pricing in. Stress-test before assuming the spread holds.
Location & tenants
- Location reads 77/100 on livability (#77 in MD, #2,839 nationally) — a middle-class / working-renter tenant base. Strengths: commute A+, housing A+, health & safety A+; Watch: schools F, crime F.
- Baltimore County Public Schools (suburban): math 15% / reading 34% proficiency, ranked #11 of 24 in MD (top 46%) — low school quality limits family demand, transient renter base, plan for 1-2y turnover.
- Market conditions: Rents rising fast (+6.7%/yr); 225 active listings in the ZIP; 15 comparable units currently listed for rent nearby; rentals at typical pace (median 24d on market — plan ~3-4 weeks tenant-placement turnaround); 47% of comp listings sitting > 30 days — soft ceiling on asking rent; solid renter incomes; 1,511 units permitted in Baltimore County in 2024 (643 in 5+ unit buildings).
- This rent runs 38% of the median local income ($84k/yr) — at the standard rent-burdened threshold; future hikes will face affordability resistance.
Forward outlook
- Local home prices are declining (-3.0%/yr); year-one equity from $2k of loan paydown is wiped out by about $8k of value loss. Plan a longer hold.
- Baltimore County population projected at +12% by 2050 — modest demand growth; plan on rents tracking national, not racing it.
- At projected returns (-3.0% appreciation + 6.7% rent growth), your $75k cash investment doubles in ~10 years — after that, you're playing with house money.
Negotiation context
- It's been on market 17 days — a 2% lower offer ($265k) is reasonable based on typical stale-listing flexibility.
- Current owner paid $36k; list at $269k implies a 637% gain — meaningful room to come down on a strong offer.
Risks & watch-outs
- Watch-outs: built in 1938 — expect roof / HVAC / electrical / plumbing capex.
- Climate carrying-cost: major wind risk, 27% chance of damaging wind over 30y; extreme-heat days projected 7→15/yr by 2055 (HVAC capex compounding) — expect insurance premiums to compound above CPI over the hold.
Questions for the listing agent
- Can we see the unit-by-unit rent roll, current vacancy, and any below-market leases? What's the average tenancy length?
- What capital expenditures (roof, boiler, parking lot, exteriors) have been made in the last 5 years, and what's planned in the next 2?
- Built in 1938 — when were the roof, HVAC, electrical panel, plumbing, and water heater last replaced?
- Is there a deadline driving the sale (1031 exchange, divorce, estate, relocation)? That informs how much negotiation room exists.
- Schools are F-rated, which usually means shorter tenancies and higher turnover. Who's the typical renter profile here, and what's been the actual vacancy rate?
- Crime grade is F in this area — have there been break-ins, vandalism, or insurance claims at this property in the last 3 years? What carrier currently insures it and at what premium?
- What's the average days-on-market for RENTAL listings here right now (not sales)? A rising rental-DOM trend means longer vacancies and softer asking-rent achievability than the comps imply.
- What's the recent tenant-quality profile in this submarket — average credit score on applications, eviction rate, late-payment / NSF rate, and stable-employment percentage? A property-management company in the area should have these aggregated.
- How much new apartment / multifamily construction is in the pipeline within 1–3 miles? Heavy new supply (>2% of stock underway) typically softens rents 12–24 months out; light construction supports rent growth.
Investment metrics
- 1% rule
- 0.99% ✗
- Cap rate
- 7.67%
- Cash-on-cash
- 4.91%
- DSCR
- 1.22
- GRM
- 8.4
CMA / ARV
- ARV (on-the-fly)
- $362,250
- Comps found
- 1
Show comp detail 1 sale within ~0.75 mi
| Address | Dist | Beds/Ba | Sqft | Sold | Price | $/sf | Match |
|---|---|---|---|---|---|---|---|
| 2528 Wendover Rd | 0.52mi | 5/— (+1) | 1,704 (-3%) | 17mo | $351,900 | $207 | 52 |
Match score weights: distance 35% · size 25% · config 20% · recency 20%. Top-matched comps best support the ARV.
Projected returns pro-forma
-3.0% appreciation · 6.68% rent growth · sell at horizon
- IRR
- -4.7%
- Equity multiple
- 0.82×
- Total profit
- $-13,690
- Equity at exit
- $40,109
- IRR
- 8.8%
- Equity multiple
- 1.78×
- Total profit
- $58,839
- Equity at exit
- $23,258
Cash invested: $75,320 (down + closing). Projections, not guarantees.
Landlord ↔ Tenant lean methodology
- Overall (STATE)
- 27 Tenant-Leaning
- State Maryland
- 27 Tenant-Leaning · D+14
- County
- — inherits STATE
- City
- — inherits STATE
ZIP-level market 21234
- Rents YoY
- 6.7%
- Active inventory
- 225
- Price-to-rent
- 16.8×
Monthly cashflow live
- Estimated rent
- $2,675 high interval (Pro) →
- Mortgage (P&I)
- −$1,411
- Tax from tax record
- −$282 /mo · $3,389/yr
- Insurance
- −$112
- HOA
- −$0
- Vacancy / Maint / Mgmt
- −$562
- Net cashflow
- $308
Break-even live
2-unit breakdown (identical units grouped — click to expand)
| Units | Beds | Baths | Est. rent |
|---|---|---|---|
| 2× units | 1 | 1 | $2,676 |
| #1 | 1 | 1 | $1,338 |
| #2 | 1 | 1 | $1,338 |
| Total (2 units) | $2,675 | ||
UW: 25.0% down · 7.5% · 30yr · 1.5% tax · 5.0% vac · 8.0% maint · 8.0% mgmt
Financing live
Cash to close
- Down payment
- $67,250
- Closing costs
- $8,070
- Reserves months
- —
- Total cash needed
- —
Loan-product check · same deal, 3 products live
Conventional
25% down · 7.5% · 30yr
- Down + closing
- —
- Monthly P&I
- —
- Monthly cashflow
- —
- DSCR
- —
- Eligible?
- —
Personal DTI + credit; lowest rate.
DSCR
20% down · 8.5% · 30yr
- Down + closing
- —
- Monthly P&I
- —
- Monthly cashflow
- —
- DSCR
- —
- Eligible?
- —
No personal income docs; deal must DSCR.
Hard money
10% down · 12.0% · 12mo
- Down + closing
- —
- Monthly P&I
- —
- Monthly cashflow
- —
- DSCR
- —
- Eligible?
- —
Short-term bridge; refi at stabilization.
Rent comps 15 comps
| Address | Beds | Baths | Sqft | Rent | $/sqft | DOM | Units | Dist |
|---|---|---|---|---|---|---|---|---|
| 3017 Lavender Ave Parkville, MD | 3.0 | 3.0 | 2325 | $2,699 | $1.16 | 10d | 1 | 0.19mi |
| 2912 Hillcrest Ave Parkville, MD | 5.0 | 2.0 | 1648 | $2,900 | $1.76 | 43d | 1 | 0.34mi |
| 2518 Linwood Rd Parkville, MD | 3.0 | 1.5 | 1946 | $2,200 | $1.13 | 16d | 1 | 0.73mi |
| 8500 Arry Pl Parkville, MD | 3.0 | 2.5 | 2100 | $2,500 | $1.19 | 43d | 1 | 0.79mi |
| 2518 Moore Ave Parkville, MD | 4.0 | 1.5 | 1896 | $2,700 | $1.42 | 43d | 1 | 0.91mi |
| 3158 Woodring Ave Parkville, MD | 3.0 | 1.5 | 1500 | $1,950 | $1.30 | 23d | 1 | 0.93mi |
| 3617 Double Rock Ln Parkville, MD | 3.0 | 2.5 | 2000 | $2,395 | $1.20 | 5d | 1 | 1.12mi |
| 3412 Fleetwood Ave Baltimore, MD | 3.0 | 2.5 | 1620 | $2,195 | $1.35 | 43d | 1 | 1.17mi |
| 3407 Orbitan Rd Parkville, MD | 3.0 | 1.5 | 1508 | $2,200 | $1.46 | 23d | 1 | 1.28mi |
| 8768 Cimarron Cir Parkville, MD | 4.0 | 1.5 | 1752 | $2,395 | $1.37 | 23d | 1 | 1.29mi |
| 5 Belhaven Dr Nottingham, MD | 4.0 | 1.5 | 1554 | $2,000 | $1.29 | 43d | 1 | 1.33mi |
| 1376 Halstead Rd Parkville, MD | 3.0 | 1.0 | 1440 | $2,400 | $1.67 | 23d | 1 | 1.37mi |
| 7202 Sindall Rd Unit 7202 Parkville, MD | 3.0 | 1.0 | 1350 | $1,850 | $1.37 | 43d | 1 | 1.44mi |
| 7935 Belridge Rd Nottingham, MD | 1.0–3.0 | 1.0–1.5 | 974 | $2,172 | $2.23 | 2d | 17 | 1.47mi |
| 2908 5th Ave Parkville, MD | 3.0 | 1.0 | 1260 | $1,950 | $1.55 | 43d | 1 | 1.49mi |
Listing history 4 events
-
2026-04-23status Pending
-
2026-04-07$269,000 Active
-
2026-03-31historical $269,000
-
1979-05-18soldstatus $36,500
ⓘ Source: listings_history table (triggers on properties + properties_extension) + one-shot
backfill from property_details.listing_events for pre-trigger history.
Tax reassessment forecast MD · Partial reset (capped growth)
- Current annual tax
- $3,389 · $282/mo
- Projected year-2 tax
- $3,389 · $282/mo
- Expected delta
- $0/yr ($0/mo · 0.0%)
ⓘ Screening estimate from a state-policy table — verify with the county assessor before closing.
Climate risk First Street
- Flood 1/10 Low FEMA zone X (unshaded) · 0% chance over 30 yrs
- Wildfire 1/10 Low
- Heat 7/10 Severe 7 d/yr ≥104°F today · 15 d/yr by 30 yrs out
- Wind 6/10 Major 27% chance of damaging wind over 30 yrs
- Air quality 4/10 Moderate 5 unhealthy d/yr today · 7 by 30 yrs out
Nearby sold comps map
Loading sold comps map…
Walkable amenities ~0.75 mi
Loading nearby amenities…
Taxation est. · year 1
- Rental income
- $32,100
- − Mortgage interest
- −$15,068
- − Property taxes
- −$3,389
- − Insurance
- −$1,345
- − Repairs & maintenance
- −$2,568
- − Management
- −$2,568
- − Depreciation
- −$7,825
- Taxable loss
- −$664
- Est. tax savings @ 24.0%
- +$159
- After-tax cash flow
- $3,856/yr
For passive investors: Depreciation is non-cash, so a rental often shows a tax loss while cash-flowing — sheltering income. Rental losses are passive: they offset passive income freely, and up to $25,000/yr can offset ordinary (W-2) income if you actively participate and your MAGI is under $100k (phasing out to $0 by $150k); unused losses carry forward. On sale, claimed depreciation is recaptured at up to 25%, and gains may owe capital-gains tax (a 1031 exchange can defer both). Figures are a year-1 estimate at your 24.0% rate — not tax advice; consult a CPA.
Schools (NCES district)
- District
- Baltimore County Public Schools
- NCES district ID
- 2400120
- Math proficiency
- 15% ▼ -16.00%
- Reading proficiency
- 34% ▼ -5.00%
- Median HH income
- $66,746
- Composite
- 23.17/100
- National rank
- #7948
- State rank
- #11 of 24 in MD
Livability — Parkville
- Score
- 77/100
- State rank
- #77
- US rank
- #2839
Category grades
Schools grade is shown separately in the Schools card above.
Census & demographics
- Census place
- Parkville, MD
- County
- Baltimore County · 769,527 people
- City population
- 66,334
- Metro
- Baltimore-Columbia-Towson, MD
- Population (ZIP)
- 66,334
- Household income
- $83,517
- Rent vs Own
- Severe rent burden
- 2719.0
Population outlook (Baltimore County) Hauer SSP2
- Today (2025)
- 885,518 people
- By 2030
- 909,272 · +2.7%
- By 2040
- 951,547 · +7.5%
- By 2050
- 990,955 · +11.9%
- By 2075
- 1,086,411 · +22.7%
- By 2100
- 1,135,078 · +28.2%
Race, ethnicity, and origin ACS 2023
- Neighborhood character
- Diverse neighborhood (Simpson 0.58)
- Race & ethnicity
- White 58% Black 28% Asian 5% Hispanic / Latino 5% Two or more races 5%
- Common ancestry
- Romanian 5% Lithuanian 1% Italian 1%
- Foreign-born
- 10% · Canada, China, South Korea
- Languages at home
- 89% English-only · Spanish 3% Other Indo-European 2% Tagalog/Filipino 1%
Political lean MEDSL · Baltimore
- 2024 margin
- Strong D (+24.5) · D 61.0% · R 36.5% · Other 2.5%
- 2008→2024 swing
- +9.9pp toward D · 2008: 14.6pp · 2024: 24.5pp
- All cycles
- 2024: D+24.5 2020: D+27.0 2016: D+17.4 2012: D+16.4 2008: D+14.6
Not yet ingested
- Civics
- —
Market trends
- HPI YoY
- ▼ -247.04%
- Current HPI
- 254.3824
- Rent YoY
- ▲ 6.68%
- Metro
- Baltimore-Columbia-Towson, MD
- State GDP YoY
- ▲ 2.97%
- F500 in state
- 12
Industry mix (Fortune 500 HQ in MD)
| Industry | F500 HQs | Revenue |
|---|---|---|
| Aerospace / Defense | 1 | $71B |
|
||
| Utilities | 1 | $25B |
|
||
| Hotels | 1 | $24B |
|
||
| Consumer Goods | 1 | $7B |
|
||
| Real Estate | 1 | $6B |
|
||
| Chemicals | 1 | $2B |
|
||
Price history
+637.0% since first listed4 events — show timeline
- 2026-04-23 Pending — BRIGHT MLS
- 2026-04-07 Listed $269,000 BRIGHT MLS
- 2026-03-31 Coming Soon $269,000 BRIGHT MLS
- 1979-05-18 Sold (Public Records) $36,500 Public Records
Property tax history
+3.1%/yrLatest (2025): $3,389 · +11.9% YoY. Source: county tax records.
Cash-flow waterfall
monthlySold comps — $/sqft
last 12 mo · ≤1 miLoading sold comps…