507 S 14th St · Alpine, TX
Flood risk 1/10 · Minimal
- FEMA flood zone
- —
- Chance of flooding over 30 yrs
- 0.0%
- Est. flood insurance / yr
- —
Fire risk 10/10 · Severe
- Est. fire insurance / yr
- $1,222 – $2,270
Heat risk 4/10 · Minor
- Hot days now (above 93°F)
- 5 days/yr
- Hot days in 30 yrs
- 13 days/yr
Wind risk 1/10 · Minimal
- Chance of severe wind over 30 yrs
- —
Air-quality risk 1/10 · Minimal
- Unhealthy air days now
- 0 days/yr
- Unhealthy air days in 30 yrs
- 0 days/yr
Risk factors via First Street. Map © Google.
Why this score? — see what drove the B- grade
The composite is a weighted blend of 9 inputs, each scored 0–100. Each bar is that input's sub-score; the figure is the points it added to the 100-point composite (weight × sub-score).
- Cash flow +28.6/30.0
- DSCR +10.0/10.0
- ARV discount +7.5/15.0
- 1% rule +7.1/10.0
- Schools +4.0/10.0
- Livability +3.9/5.0
- Rent growth +2.5/5.0
- Condition / age +2.5/5.0
- Appreciation +0.0/10.0
$98,000
🖨 Deal sheet 📄 Offer letter ✓ Due diligence
Listing remarks
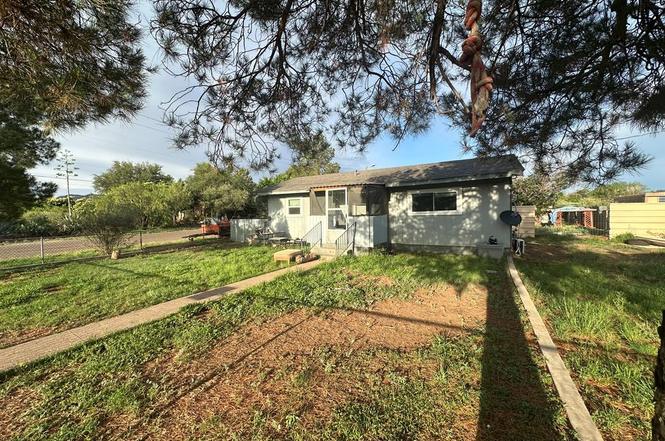
2 bedroom 1 bathroom home with a storage building on a 0.22 acre lot.
Key facts
- 9,583 sq ft lot
- Built 1968
- Listed 2 days
Property features AI
Exterior
- Parking: No designated parking
- Utilities: Public water; Public sewer; Propane service
- Home design: Single family residence; Residential property
- Construction: Frame construction; Composition roof; Pillar/Post/Pier foundation; Built on a 0.22-acre lot
- Exterior features: Paved road access; Solar energy generation; Storage building; Workshop
Interior
- Bathrooms: 1 full bathroom
- Heating & cooling: Has heating; Has cooling
- Interior features: Electric water heater; No fireplace
- Laundry & utility: Laundry in kitchen; Dryer included
Neighborhood map
What this means for you Summary
Snapshot
- This is a 2-bed/1.0-bath single-family listed at $98k.
Deal economics
- At list price, monthly cash flow is $324 ($4k/yr) — positive.
- The deal already cash-flows at list — no discount required.
- Meets the 1% rule at list price ($1k rent vs $98k).
Location & tenants
- Location reads 78/100 on livability (#73 in TX, #2,631 nationally) — a middle-class / working-renter tenant base. Strengths: crime A+, cost of living A+, housing A+; Watch: amenities D+, commute F, employment F.
- Alpine ISD (town): math 43% / reading 53% proficiency, ranked #235 of 826 in TX (top 28%) — families likely to look elsewhere, expect single-tenant / working-renter base with shorter leases.
- Zoned schools: Alpine El (math 27% / reading 37%, grade F, #2,268 of 4,322 statewide, top 55%, 377 students, 47% FRL); Alpine Middle (math 38% / reading 55%, grade D+, #443 of 1,662 statewide, top 28%, 269 students, 58% FRL); Alpine H S (math 77% / reading 62%, grade B, #119 of 1,632 statewide, top 9%, 308 students, 54% FRL).
- Market conditions: 167 active listings in the ZIP; 2 comparable units currently listed for rent nearby; 7 units permitted in Brewster County in 2024 (0 in 5+ unit buildings).
Forward outlook
- Local home prices are declining (-3.0%/yr); year-one equity from $678 of loan paydown is wiped out by about $3k of value loss. Plan a longer hold.
- Brewster County population projected at -17% by 2050 — secular population decline; favor cash flow + early exit over multi-decade hold.
- At projected returns (-3.0% appreciation + 3.0% rent growth), your $27k cash investment doubles in ~9 years — after that, you're playing with house money.
Negotiation context
- Only 2 days on market — expect competitive offers; lowballing is unlikely to land.
Risks & watch-outs
- Climate carrying-cost: severe wildfire risk — expect insurance premiums to compound above CPI over the hold.
Questions for the listing agent
- Built in 1968 — when were the roof, HVAC, electrical panel, plumbing, and water heater last replaced?
- Is there a deadline driving the sale (1031 exchange, divorce, estate, relocation)? That informs how much negotiation room exists.
- What's the average days-on-market for RENTAL listings here right now (not sales)? A rising rental-DOM trend means longer vacancies and softer asking-rent achievability than the comps imply.
- What's the recent tenant-quality profile in this submarket — average credit score on applications, eviction rate, late-payment / NSF rate, and stable-employment percentage? A property-management company in the area should have these aggregated.
- How much new for-sale + rental construction is in the pipeline within 1–3 miles? Heavy new supply typically softens prices + rents 12–24 months out; constrained supply supports both.
Investment metrics
- 1% rule
- 1.21% ✓
- Cap rate
- 10.27%
- Cash-on-cash
- 14.19%
- DSCR
- 1.63
- GRM
- 6.9
CMA / ARV
No comps found within radius.
Projected returns pro-forma
-3.0% appreciation · 3.0% rent growth · sell at horizon
- IRR
- 4.5%
- Equity multiple
- 1.17×
- Total profit
- $4,763
- Equity at exit
- $14,612
- IRR
- 13.9%
- Equity multiple
- 2.12×
- Total profit
- $30,664
- Equity at exit
- $8,473
Cash invested: $27,440 (down + closing). Projections, not guarantees.
Landlord ↔ Tenant lean methodology
- Overall (STATE)
- 87 Strongly Landlord-Friendly
- State Texas
- 87 Strongly Landlord-Friendly · R+5
- County
- — inherits STATE
- City
- — inherits STATE
ZIP-level market 79830
- Home prices YoY
- -32.6%
- Active inventory
- 167
- Price-to-rent
- 6.9×
Monthly cashflow live
- Estimated rent
- $1,183 medium interval (Pro) →
- Mortgage (P&I)
- −$514
- Tax from tax record
- −$55 /mo · $665/yr
- Insurance
- −$41
- HOA
- −$0
- Vacancy / Maint / Mgmt
- −$248
- Net cashflow
- $324
Break-even live
UW: 25.0% down · 7.5% · 30yr · 1.5% tax · 5.0% vac · 8.0% maint · 8.0% mgmt
Financing live
Cash to close
- Down payment
- $24,500
- Closing costs
- $2,940
- Reserves months
- —
- Total cash needed
- —
Loan-product check · same deal, 3 products live
Conventional
25% down · 7.5% · 30yr
- Down + closing
- —
- Monthly P&I
- —
- Monthly cashflow
- —
- DSCR
- —
- Eligible?
- —
Personal DTI + credit; lowest rate.
DSCR
20% down · 8.5% · 30yr
- Down + closing
- —
- Monthly P&I
- —
- Monthly cashflow
- —
- DSCR
- —
- Eligible?
- —
No personal income docs; deal must DSCR.
Hard money
10% down · 12.0% · 12mo
- Down + closing
- —
- Monthly P&I
- —
- Monthly cashflow
- —
- DSCR
- —
- Eligible?
- —
Short-term bridge; refi at stabilization.
Rent comps 2 comps
| Address | Beds | Baths | Sqft | Rent | $/sqft | DOM | Units | Dist |
|---|---|---|---|---|---|---|---|---|
| 504 East Ave E Unit 3 Alpine, TX | 1.0 | 1.0 | 700 | $750 | $1.07 | 14d | 1 | 0.91mi |
| 1104 Lechuguilla Alpine, TX | 1.0 | 1.0 | 700 | $801 | $1.14 | 43d | 1 | 1.28mi |
Listing history 3 events
-
2026-06-18days on market $98,000 Active 2 DOM
-
2026-06-16remarks 69-char remark
-
2026-06-16$98,000 Active 1 DOM
ⓘ Source: listings_history table (triggers on properties + properties_extension) + one-shot
backfill from property_details.listing_events for pre-trigger history.
Tax reassessment forecast TX · Resets to sale price
- Current annual tax
- $665 · $55/mo
- Projected year-2 tax
- $1,793 · $149/mo
- Expected delta
- +$1,128/yr (+$94/mo · 169.7%)
ⓘ Screening estimate from a state-policy table — verify with the county assessor before closing.
Climate risk First Street
- Flood 1/10 Low 0% chance over 30 yrs
- Wildfire 10/10 Extreme
- Heat 4/10 Moderate 5 d/yr ≥93°F today · 13 d/yr by 30 yrs out
- Wind 1/10 Low
- Air quality 1/10 Low 0 unhealthy d/yr today · 0 by 30 yrs out
Nearby sold comps map
Loading sold comps map…
Walkable amenities ~0.75 mi
Loading nearby amenities…
Taxation est. · year 1
- Rental income
- $14,197
- − Mortgage interest
- −$5,490
- − Property taxes
- −$665
- − Insurance
- −$490
- − Repairs & maintenance
- −$1,136
- − Management
- −$1,136
- − Depreciation
- −$2,851
- Taxable income
- $2,430
- Est. tax owed @ 24.0%
- −$583
- After-tax cash flow
- $3,311/yr
For passive investors: Depreciation is non-cash, so a rental often shows a tax loss while cash-flowing — sheltering income. Rental losses are passive: they offset passive income freely, and up to $25,000/yr can offset ordinary (W-2) income if you actively participate and your MAGI is under $100k (phasing out to $0 by $150k); unused losses carry forward. On sale, claimed depreciation is recaptured at up to 25%, and gains may owe capital-gains tax (a 1031 exchange can defer both). Figures are a year-1 estimate at your 24.0% rate — not tax advice; consult a CPA.
Schools (NCES district)
- District
- Alpine ISD
- NCES district ID
- 4807950
- Math proficiency
- 43% ▼ -4.00%
- Reading proficiency
- 53% ▲ 2.00%
- Median HH income
- $39,184
- Composite
- 40.06/100
- National rank
- #3814
- State rank
- #235 of 826 in TX
Livability — Alpine
- Score
- 78/100
- State rank
- #73
- US rank
- #2631
Category grades
Schools grade is shown separately in the Schools card above.
Census & demographics
- Census place
- Alpine, TX
- County
- Brewster County · 7,853 people
- City population
- 7,853
- Metro
- nan
- Population (ZIP)
- 7,853
- Household income
- $66,546
- Rent vs Own
- Severe rent burden
- 229.0
Population outlook (Brewster County) Hauer SSP2
- Today (2025)
- 8,850 people
- By 2030
- 8,577 · -3.1%
- By 2040
- 7,903 · -10.7%
- By 2050
- 7,338 · -17.1%
- By 2075
- 5,950 · -32.8%
- By 2100
- 4,678 · -47.1%
Race, ethnicity, and origin ACS 2023
- Neighborhood character
- Majority White (52%)
- Race & ethnicity
- White 52% Hispanic / Latino 46% Two or more races 15% Asian 1%
- Hispanic origin (detail)
- Mexican 37%
- Common ancestry
- Serbian 5% Slovak 3% Romanian 2%
- Foreign-born
- 9% · Canada
- Languages at home
- 69% English-only · Spanish 29% Tagalog/Filipino 1%
Political lean MEDSL · Brewster
- 2024 margin
- R (+12.6) · D 43.0% · R 55.6% · Other 1.4%
- 2008→2024 swing
- -15.5pp toward R · 2008: 3.0pp · 2024: -12.6pp
- All cycles
- 2024: R+12.6 2020: R+4.2 2016: R+4.8 2012: R+5.4 2008: D+3.0
Not yet ingested
- Civics
- —
Market trends
- HPI YoY
- ▼ -86.21%
- Current HPI
- 178.4899
- Rent YoY
- —
- Metro
- nan
- State GDP YoY
- ▲ 3.95%
- F500 in state
- 110
Industry mix (Fortune 500 HQ in TX)
| Industry | F500 HQs | Revenue |
|---|---|---|
| Energy | 16 | $1,198B |
|
||
| Technology | 5 | $198B |
|
||
| Engineering / Construction | 4 | $72B |
|
||
| Energy Services | 3 | $60B |
|
||
| Utilities | 3 | $41B |
|
||
| Healthcare | 2 | $330B |
|
||
Price history
3 events — show timeline
- 2026-06-16 Listed $98,000 ODMLS
- 2001-08-21 Sold (Public Records) — Public Records
- 1993-08-05 Sold (Public Records) — Public Records
Property tax history
-3.0%/yrLatest (2025): $665 · -5.6% YoY. Source: county tax records.
Cash-flow waterfall
monthlySold comps — $/sqft
last 12 mo · ≤1 miLoading sold comps…