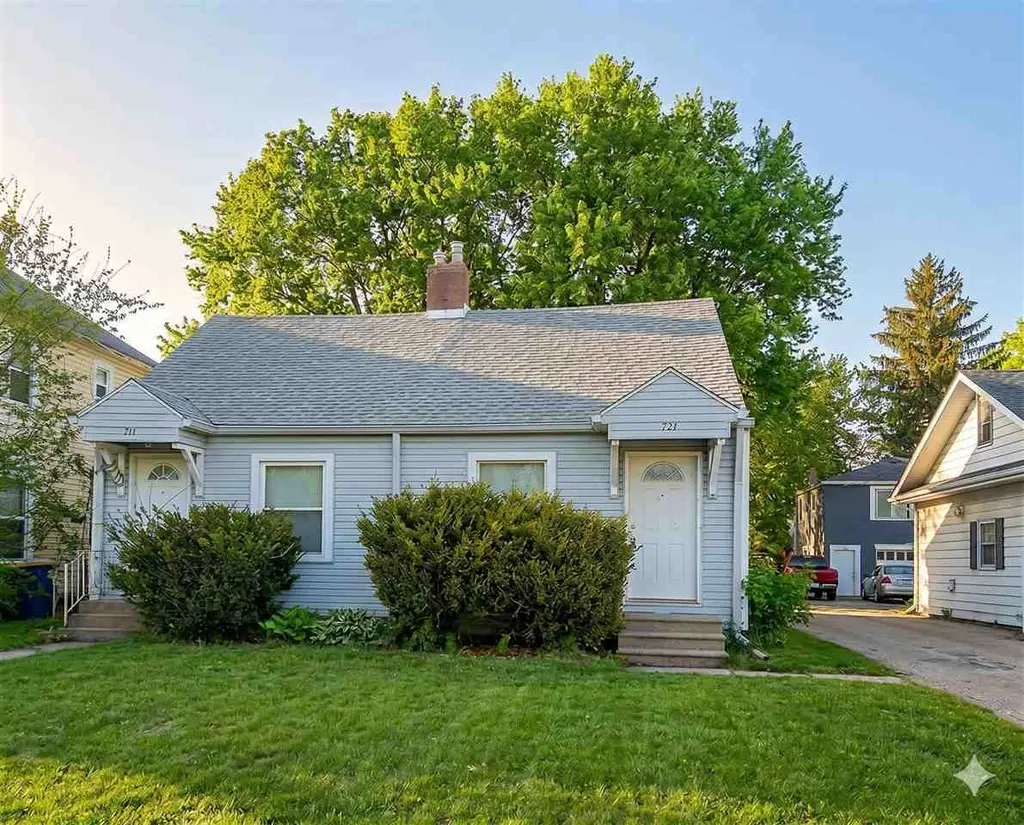
 Duplex
731-733 W 9th St · Anderson, IN
Flood risk 1/10 · Minimal
- FEMA flood zone
- X (unshaded)
- Chance of flooding over 30 yrs
- 0.0%
- Est. flood insurance / yr
- $473 – $860
Fire risk 1/10 · Minimal
- Est. fire insurance / yr
- $717 – $1,331
Heat risk 3/10 · Minor
- Hot days now (above 100°F)
- 7 days/yr
- Hot days in 30 yrs
- 18 days/yr
Wind risk 2/10 · Minimal
- Chance of severe wind over 30 yrs
- —
Air-quality risk 3/10 · Minor
- Unhealthy air days now
- 2 days/yr
- Unhealthy air days in 30 yrs
- 3 days/yr
Risk factors via First Street. Map © Google.
Why this score? — see what drove the B grade
The composite is a weighted blend of 9 inputs, each scored 0–100. Each bar is that input's sub-score; the figure is the points it added to the 100-point composite (weight × sub-score).
- Cash flow +30.0/30.0
- ARV discount +11.4/15.0
- 1% rule +10.0/10.0
- DSCR +10.0/10.0
- Rent growth +4.5/5.0
- Livability +3.0/5.0
- Condition / age +2.5/5.0
- Schools +1.6/10.0
- Appreciation +0.0/10.0
$92,150
🖨 Deal sheet 📄 Offer letter ✓ Due diligence
Multi-family units
County records classify this as Multi-Family (2-4 Unit). Listing-text estimate: 2 units. confirmed
Listing remarks
Welcome to this charming duplex at 731-733 West 9th Street, Anderson, Indiana. Built in 1941, this property offers an excellent investment opportunity with two units, each designed to provide comfortable living spaces. Unit 731 features one bedroom and one bathroom, perfect for singles or couples. Unit 733 offers two bedrooms and one bathroom, ideal for small families or tenants needing extra space. Both units enjoy a spacious layout, plenty of natural light, and modern updates that enhance the property's overall appeal. With a total square footage of 1,344 sq ft, the property sits on a 6,098 sq ft lot, providing ample outdoor space. The duplex also includes a 2-car detached garage, ensurin
Key facts
- Ample outdoor space
- Modern updates
- Natural light
Tags
Neighborhood map
What this means for you Summary
Snapshot
- This is a 1×1bd/1.0ba + 1×2bd/1.0ba units multifamily listed at $92k.
Deal economics
- At list price, monthly cash flow is $536 ($6k/yr) — positive. Per door: $268/mo.
- The deal already cash-flows at list — no discount required.
- Meets the 1% rule at list price ($1k rent vs $92k).
- Recommended offer: $89k (3.0% below list) — sets the bar for market timing.
- Cap rate 13.3% vs local median 6.5% in Anderson — top-decile yield for the area; either an underpriced asset or a hidden risk that comps aren't pricing in. Stress-test before assuming the spread holds.
Location & tenants
- Location reads 60/100 on livability (#521 in IN) — a middle-class / working-renter tenant base. Strengths: cost of living A+, housing A+; Watch: schools F, crime D-, amenities F.
- Anderson Community School Corporation (urban): math 15% / reading 23% proficiency, ranked #280 of 301 in IN (top 93%) — low school quality limits family demand, transient renter base, plan for 1-2y turnover; 70% free/reduced lunch — lower-income household profile, screen leases tightly.
- Market conditions: Rents rising fast (+7.9%/yr); 185 active listings in the ZIP; 32 comparable units currently listed for rent nearby; rentals at typical pace (median 24d on market — plan ~3-4 weeks tenant-placement turnaround); lower-income renter base — watch delinquency; 184 units permitted in Madison County in 2024 (0 in 5+ unit buildings).
- At $1,498/mo this rent would consume 50% of the median local household income ($36k/yr) (locally 1193% of renters already pay >50% of income on rent) — very limited rent-growth headroom before tenants either downsize or default.
Forward outlook
- Local home prices are declining (-3.0%/yr); year-one equity from $638 of loan paydown is wiped out by about $3k of value loss. Plan a longer hold.
- Madison County population projected at -14% by 2050 — secular population decline; favor cash flow + early exit over multi-decade hold.
- At projected returns (-3.0% appreciation + 7.9% rent growth), your $26k cash investment doubles in ~5 years — after that, you're playing with house money.
Negotiation context
- It's been on market 41 days — a 3% lower offer ($89k) is reasonable based on typical stale-listing flexibility.
- 3 sale attempts since 20y ago; this cycle's ask is 32% above the opening price — seller raised mid-cycle; expect resistance to lowballs.
- Current owner paid $46k; list at $92k implies a 98% gain — meaningful room to come down on a strong offer.
Risks & watch-outs
- Watch-outs: built in 1941 — expect roof / HVAC / electrical / plumbing capex.
Questions for the listing agent
- It's been on market 41 days. Have you received any prior offers? Is the seller open to a 3% concession, seller financing, or rate buy-down credit?
- Can we see the unit-by-unit rent roll, current vacancy, and any below-market leases? What's the average tenancy length?
- What capital expenditures (roof, boiler, parking lot, exteriors) have been made in the last 5 years, and what's planned in the next 2?
- Built in 1941 — when were the roof, HVAC, electrical panel, plumbing, and water heater last replaced?
- Is there a deadline driving the sale (1031 exchange, divorce, estate, relocation)? That informs how much negotiation room exists.
- Schools are F-rated, which usually means shorter tenancies and higher turnover. Who's the typical renter profile here, and what's been the actual vacancy rate?
- Crime grade is D in this area — have there been break-ins, vandalism, or insurance claims at this property in the last 3 years? What carrier currently insures it and at what premium?
- What's the average days-on-market for RENTAL listings here right now (not sales)? A rising rental-DOM trend means longer vacancies and softer asking-rent achievability than the comps imply.
- What's the recent tenant-quality profile in this submarket — average credit score on applications, eviction rate, late-payment / NSF rate, and stable-employment percentage? A property-management company in the area should have these aggregated.
- How much new apartment / multifamily construction is in the pipeline within 1–3 miles? Heavy new supply (>2% of stock underway) typically softens rents 12–24 months out; light construction supports rent growth.
Investment metrics
- 1% rule
- 1.63% ✓
- Cap rate
- 13.28%
- Cash-on-cash
- 24.95%
- DSCR
- 2.11
- GRM
- 5.1
CMA / ARV
- ARV (median comp)
- $100,806
- List price
- $92,150
- Delta
- -8.59%
- Verdict
- FAIR
- Comps
- 3 within 1.0 mi
Projected returns pro-forma
-3.0% appreciation · 7.88% rent growth · sell at horizon
- IRR
- 23.9%
- Equity multiple
- 2.05×
- Total profit
- $26,978
- Equity at exit
- $13,740
- IRR
- 34.7%
- Equity multiple
- 4.98×
- Total profit
- $102,637
- Equity at exit
- $7,967
Cash invested: $25,802 (down + closing). Projections, not guarantees.
Landlord ↔ Tenant lean methodology
- Overall (STATE)
- 90 Strongly Landlord-Friendly
- State Indiana
- 90 Strongly Landlord-Friendly · R+11
- County
- — inherits STATE
- City
- — inherits STATE
ZIP-level market 46016
- Home prices YoY
- -3.5%
- Rents YoY
- 7.9%
- Active inventory
- 185
- Price-to-rent
- 10.5×
Monthly cashflow live
- Estimated rent
- $1,498 high interval (Pro) →
- Mortgage (P&I)
- −$483
- Tax from tax record
- −$125 /mo · $1,504/yr
- Insurance
- −$38
- HOA
- −$0
- Vacancy / Maint / Mgmt
- −$315
- Net cashflow
- $536
Break-even live
2-unit breakdown (identical units grouped — click to expand)
| Units | Beds | Baths | Est. rent |
|---|---|---|---|
| 1× unit | 1 | 1 | $730 |
| 1× unit | 2 | 1 | $768 |
| Total (2 units) | $1,498 | ||
UW: 25.0% down · 7.5% · 30yr · 1.5% tax · 5.0% vac · 8.0% maint · 8.0% mgmt
Financing live
Cash to close
- Down payment
- $23,038
- Closing costs
- $2,764
- Reserves months
- —
- Total cash needed
- —
Loan-product check · same deal, 3 products live
Conventional
25% down · 7.5% · 30yr
- Down + closing
- —
- Monthly P&I
- —
- Monthly cashflow
- —
- DSCR
- —
- Eligible?
- —
Personal DTI + credit; lowest rate.
DSCR
20% down · 8.5% · 30yr
- Down + closing
- —
- Monthly P&I
- —
- Monthly cashflow
- —
- DSCR
- —
- Eligible?
- —
No personal income docs; deal must DSCR.
Hard money
10% down · 12.0% · 12mo
- Down + closing
- —
- Monthly P&I
- —
- Monthly cashflow
- —
- DSCR
- —
- Eligible?
- —
Short-term bridge; refi at stabilization.
Rent comps 32 comps
| Address | Beds | Baths | Sqft | Rent | $/sqft | DOM | Units | Dist |
|---|---|---|---|---|---|---|---|---|
| 921 W 9th St Anderson, IN | 3.0 | 2.0 | 1611 | $1,375 | $0.85 | 23d | 1 | 0.16mi |
| 820 W 7th St Apt A Anderson, IN | 2.0 | 2.0 | 1400 | $1,200 | $0.86 | 23d | 1 | 0.16mi |
| 510 W 5th St Anderson, IN | 3.0 | 1.5 | 1617 | $995 | $0.62 | 43d | 1 | 0.29mi |
| 120 W 10th St Anderson, IN | 1.0–3.0 | 1.0 | 1066 | $1,150 | $1.08 | 1d | 1 | 0.34mi |
| 1222 Nichol Ave Unit 4 Anderson, IN | 3.0 | 1.0 | 1000 | $1,135 | $1.14 | 7d | 1 | 0.42mi |
| 1212 W 5th St Anderson, IN | 3.0 | 1.0 | 1252 | $1,295 | $1.03 | 12d | 1 | 0.45mi |
| 506 W 2nd St Anderson, IN | 3.0 | 1.0 | 964 | $1,095 | $1.14 | 23d | 1 | 0.49mi |
| 1502 Cedar St Anderson, IN | 2.0 | 1.0 | 1104 | $850 | $0.77 | 43d | 1 | 0.50mi |
| 1310 W 13th St Anderson, IN | 2.0 | 1.0 | 1178 | $895 | $0.76 | 2d | 1 | 0.50mi |
| 1010 W 2nd St Unit 2 Anderson, IN | 2.0 | 1.0 | 875 | $1,025 | $1.17 | 21d | 1 | 0.53mi |
| 1010 W 2nd St Unit 3 Anderson, IN | 3.0 | 1.0 | 1025 | $1,125 | $1.10 | 14d | 1 | 0.53mi |
| 1631 W 7th St Anderson, IN | 3.0 | 1.0 | 900 | $1,000 | $1.11 | 43d | 1 | 0.68mi |
| 219 E 13th St Anderson, IN | 3.0 | 1.0 | 882 | $1,000 | $1.13 | 4d | 1 | 0.69mi |
| 229 W 19th St Anderson, IN | 3.0 | 1.0 | 1200 | $1,000 | $0.83 | 43d | 1 | 0.71mi |
| 1529 W 2nd St Anderson, IN | 3.0 | 1.0 | 884 | $1,200 | $1.36 | 23d | 1 | 0.73mi |
| 1616 W 16th St Anderson, IN | 2.0 | 1.0 | 1038 | $1,050 | $1.01 | 43d | 1 | 0.79mi |
| 618 W 22nd St Anderson, IN | 3.0 | 1.0 | 900 | $1,250 | $1.39 | 43d | 1 | 0.86mi |
| 1136 Irving Way Anderson, IN | 2.0 | 1.0 | 900 | $895 | $0.99 | 21d | 1 | 0.88mi |
| 2233 Fairview St Anderson, IN | 3.0 | 1.5 | 1452 | $1,195 | $0.82 | 23d | 1 | 0.93mi |
| 2301 Sheridan St Anderson, IN | 2.0 | 1.0 | 900 | $950 | $1.06 | 43d | 1 | 0.94mi |
| 1726-1728 Walnut St Anderson, IN | 2.0 | 2.0 | 900 | $995 | $1.11 | 2d | 1 | 1.00mi |
| 2111 Central Ave Anderson, IN | 3.0 | 1.0 | 1026 | $1,250 | $1.22 | 43d | 1 | 1.01mi |
| 706 University Blvd Anderson, IN | 2.0 | 1.0 | 1250 | $1,050 | $0.84 | 2d | 1 | 1.06mi |
| 1404 Walton St Anderson, IN | 3.0 | 1.0 | 1090 | $995 | $0.91 | 43d | 1 | 1.07mi |
| 1532 Walton St Anderson, IN | 3.0 | 1.0 | 1342 | $1,100 | $0.82 | 43d | 1 | 1.11mi |
| 1023 E 8th St Unit 3 Anderson, IN | 2.0 | 1.5 | 1200 | $1,175 | $0.98 | 7d | 1 | 1.16mi |
| 2627 Chase St Anderson, IN | 3.0 | 1.0 | 1050 | $850 | $0.81 | 17d | 1 | 1.23mi |
| 2023 McKinley St Anderson, IN | 2.0 | 1.0 | 1500 | $950 | $0.63 | 43d | 1 | 1.28mi |
| 2625 Main St Anderson, IN | 2.0 | 1.0 | 988 | $895 | $0.91 | 23d | 1 | 1.32mi |
| 3021 Delaware St Anderson, IN | 2.0 | 1.0 | 1154 | $1,150 | $1.00 | 7d | 1 | 1.49mi |
| 228 E 29th St Anderson, IN | 3.0 | 2.0 | 1440 | $1,295 | $0.90 | 4d | 1 | 1.49mi |
| 2613 Louise St Anderson, IN | 2.0 | 1.0 | 1096 | $950 | $0.87 | 21d | 1 | 1.49mi |
Listing history 17 events
-
2026-06-09days on market $92,150 Active 41 DOM
-
2026-06-08days on market $92,150 Active 40 DOM
-
2026-06-07days on market $92,150 Active 39 DOM
-
2026-06-05days on market $92,150 Active 36 DOM
-
2026-06-03days on market $92,150 Active 35 DOM
-
2026-06-02days on market $92,150 Active 34 DOM
-
2026-06-01days on market $92,150 Active 33 DOM
-
2026-05-31days on market $92,150 Active 32 DOM
-
2026-04-29$92,150 Active 1301-char remark
-
2025-04-02price $92,150
-
2015-08-14historical
-
2015-02-13$69,900 Active
-
2013-08-26historical
-
2013-08-26soldstatus $46,500
-
2013-07-22$49,900
-
2006-06-01historical
-
2006-03-02$79,900
ⓘ Source: listings_history table (triggers on properties + properties_extension) + one-shot
backfill from property_details.listing_events for pre-trigger history.
Tax reassessment forecast IN · Partial reset (capped growth)
- Current annual tax
- $1,504 · $125/mo
- Projected year-2 tax
- $1,504 · $125/mo
- Expected delta
- $0/yr ($0/mo · 0.0%)
ⓘ Screening estimate from a state-policy table — verify with the county assessor before closing.
Climate risk First Street
- Flood 1/10 Low FEMA zone X (unshaded) · 0% chance over 30 yrs
- Wildfire 1/10 Low
- Heat 3/10 Moderate 7 d/yr ≥100°F today · 18 d/yr by 30 yrs out
- Wind 2/10 Low
- Air quality 3/10 Moderate 2 unhealthy d/yr today · 3 by 30 yrs out
Nearby sold comps map
Loading sold comps map…
Walkable amenities ~0.75 mi
Loading nearby amenities…
Taxation est. · year 1
- Rental income
- $17,976
- − Mortgage interest
- −$5,162
- − Property taxes
- −$1,504
- − Insurance
- −$461
- − Repairs & maintenance
- −$1,438
- − Management
- −$1,438
- − Depreciation
- −$2,681
- Taxable income
- $5,292
- Est. tax owed @ 24.0%
- −$1,270
- After-tax cash flow
- $5,167/yr
For passive investors: Depreciation is non-cash, so a rental often shows a tax loss while cash-flowing — sheltering income. Rental losses are passive: they offset passive income freely, and up to $25,000/yr can offset ordinary (W-2) income if you actively participate and your MAGI is under $100k (phasing out to $0 by $150k); unused losses carry forward. On sale, claimed depreciation is recaptured at up to 25%, and gains may owe capital-gains tax (a 1031 exchange can defer both). Figures are a year-1 estimate at your 24.0% rate — not tax advice; consult a CPA.
Schools (NCES district)
- District
- Anderson Community School Corporation
- NCES district ID
- 1800150
- Math proficiency
- 15% ▼ -14.00%
- Reading proficiency
- 23% ▼ -7.00%
- Median HH income
- $38,208
- Composite
- 15.93/100
- National rank
- #9250
- State rank
- #280 of 301 in IN
Livability — Anderson
- Score
- 60/100
- State rank
- #521
- US rank
- #18709
Category grades
Schools grade is shown separately in the Schools card above.
Census & demographics
- Census place
- Anderson, IN
- County
- Madison County · 69,445 people
- City population
- 57,762
- Metro
- Indianapolis-Carmel-Anderson, IN
- Population (ZIP)
- 17,834
- Household income
- $36,029
- Rent vs Own
- Severe rent burden
- 1193.0
Population outlook (Madison County) Hauer SSP2
- Today (2025)
- 125,800 people
- By 2030
- 122,640 · -2.5%
- By 2040
- 115,420 · -8.3%
- By 2050
- 108,148 · -14.0%
- By 2075
- 91,838 · -27.0%
- By 2100
- 75,670 · -39.8%
Race, ethnicity, and origin ACS 2023
- Neighborhood character
- Diverse neighborhood (Simpson 0.58)
- Race & ethnicity
- White 61% Black 18% Hispanic / Latino 13% Two or more races 11% Native American 1%
- Hispanic origin (detail)
- Mexican 10% Puerto Rican 1%
- Common ancestry
- Italian 2% Slovak 1% Iranian 1%
- Foreign-born
- 4% · Canada
- Languages at home
- 86% English-only · Spanish 12%
Political lean MEDSL · Madison
- 2024 margin
- Strong R (+26.9) · D 35.6% · R 62.5% · Other 1.9%
- 2008→2024 swing
- -33.5pp toward R · 2008: 6.5pp · 2024: -26.9pp
- All cycles
- 2024: R+26.9 2020: R+22.6 2016: R+25.7 2012: R+4.5 2008: D+6.5
Not yet ingested
- Civics
- —
Market trends
- HPI YoY
- ▼ -11.12%
- Current HPI
- 302.7437
- Rent YoY
- ▲ 7.88%
- Metro
- Indianapolis-Carmel-Anderson, IN
- State GDP YoY
- ▲ 2.90%
- F500 in state
- 18
Industry mix (Fortune 500 HQ in IN)
| Industry | F500 HQs | Revenue |
|---|---|---|
| Industrial Machinery | 2 | $37B |
|
||
| Healthcare | 1 | $177B |
|
||
| Pharmaceuticals | 1 | $45B |
|
||
| Metals / Steel | 1 | $18B |
|
||
| Agriculture | 1 | $17B |
|
||
| Packaging | 1 | $12B |
|
||
Price history
+15.3% since first listed8 events — show timeline
- 2025-04-02 Price Changed $92,150 RRELMS
- 2015-08-14 Listing Removed — MIBOR as Distributed by MLS Grid
- 2015-02-13 Listed $69,900 MIBOR as Distributed by MLS Grid
- 2013-08-26 Listing Removed — MIBOR as Distributed by MLS Grid
- 2013-08-26 Sold (MLS) $46,500 MIBOR as Distributed by MLS Grid
- 2013-07-22 Listed $49,900 MIBOR as Distributed by MLS Grid
- 2006-06-01 Listing Removed — MIBOR as Distributed by MLS Grid
- 2006-03-02 Listed $79,900 MIBOR as Distributed by MLS Grid
Property tax history
+6.8%/yrLatest (2024): $1,504 · +8.8% YoY. Source: county tax records.
Cash-flow waterfall
monthlySold comps — $/sqft
last 12 mo · ≤1 miLoading sold comps…