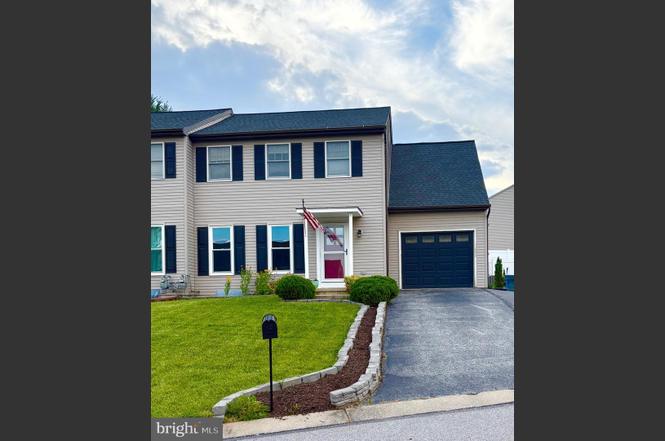
14 Steeple Ave · York, PA
Flood risk 1/10 · Minimal
- FEMA flood zone
- X (unshaded)
- Chance of flooding over 30 yrs
- 0.0%
- Est. flood insurance / yr
- $473 – $860
Fire risk 1/10 · Minimal
- Est. fire insurance / yr
- $511 – $949
Heat risk 5/10 · Moderate
- Hot days now (above 100°F)
- 7 days/yr
- Hot days in 30 yrs
- 15 days/yr
Wind risk 4/10 · Minor
- Chance of severe wind over 30 yrs
- 14.0%
Air-quality risk 3/10 · Minor
- Unhealthy air days now
- 2 days/yr
- Unhealthy air days in 30 yrs
- 5 days/yr
Risk factors via First Street. Map © Google.
Why this score? — see what drove the F grade
The composite is a weighted blend of 9 inputs, each scored 0–100. Each bar is that input's sub-score; the figure is the points it added to the 100-point composite (weight × sub-score).
- Cash flow +7.8/30.0
- Schools +4.8/10.0
- Livability +3.8/5.0
- 1% rule +2.5/10.0
- Rent growth +2.5/5.0
- Condition / age +2.5/5.0
- DSCR +1.9/10.0
- ARV discount +0.0/15.0
- Appreciation +0.0/10.0
$232,500
🖨 Deal sheet 📄 Offer letter ✓ Due diligence
Listing remarks MLS
Fannie Mae HomePath property. Bring your decorating ideas & move right in. Fresh paint, new carpet, over 1200 SqFt Of Finished Living Area. Dining Room, 1-Car Garage, kitchen With appliances, 3 BedRooms, Ceiling fans, 2.5 Baths & more. Buyer pays all transfer costs. Equal Housing Opportunity.
Key facts
- Finished basement
- Pergola
- Close to amenities
Tags
Property features AI
Finance
- Other: Pets allowed (cats and dogs permitted)
- HOA & community: Ground rent paid annually
Exterior
- Parking: Front-entry attached garage (1 garage space); Driveway with 2 spaces; Total of 3 garage/parking spaces
- Utilities: Public water; Public sewer; Natural gas for heating, hot water, and cooling
- Home design: Semi-detached property; Fee simple ownership
- Construction: Vinyl and aluminum siding; Block foundation; Asphalt roof; Building not winterized
- Exterior features: Patio(s); Outbuilding(s); Partially fenced yard with vinyl fencing; Not in a federal flood zone
Interior
- Kitchen: Kitchen (appliance details not provided)
- Bedrooms: Three bedrooms on the upper level
- Flooring: Luxury vinyl plank; Ceramic tile; Carpet
- Bathrooms: Two full bathrooms; One half bathroom on the main level
- Heating & cooling: 90% forced air heating (natural gas); Central air conditioning (natural gas cooling fuel)
- Interior features: Fully finished basement; 10 total rooms; Living room and family room; Dining room
- Laundry & utility: Utilities include natural gas hot water and heating
Neighborhood map
What this means for you Summary
Snapshot
- This is a 3-bed/1.5-bath townhouse listed at $232k.
Deal economics
- At list price, monthly cash flow is $-255 ($-3k/yr) — negative.
- To cash-flow at today's rent, offer at most $187k (19.4% below list).
- To meet the 1% rule (rent ≥ 1% of price), the offer needs to be $175k (24.6% below list).
- Recommended offer: $175k (24.6% below list) — sets the bar for 1% rule.
Location & tenants
- Location reads 75/100 on livability (#427 in PA, #3,987 nationally) — a middle-class / working-renter tenant base. Strengths: cost of living A+, health & safety A+, housing A; Watch: amenities D+, crime F, employment F.
- Dallastown Area SD (suburban): math 47% / reading 63% proficiency, ranked #102 of 539 in PA (top 19%) — acceptable for families but not a draw, mixed tenant base, ~2y average lease.
- Market conditions: 147 active listings in the ZIP; 6 comparable units currently listed for rent nearby; rentals at typical pace (median 21d on market — plan ~3-4 weeks tenant-placement turnaround); solid renter incomes; 1,328 units permitted in York County in 2024 (338 in 5+ unit buildings).
Forward outlook
- Local home prices are declining (-3.0%/yr); year-one equity from $2k of loan paydown is wiped out by about $7k of value loss. Plan a longer hold.
Negotiation context
- Only 1 days on market — expect competitive offers; lowballing is unlikely to land.
- 5 sale attempts since 28y ago; this cycle's ask is 111% above the opening price — seller raised mid-cycle; expect resistance to lowballs.
Risks & watch-outs
- Climate carrying-cost: extreme-heat days projected 7→15/yr by 2055 (HVAC capex compounding) — expect insurance premiums to compound above CPI over the hold.
Questions for the listing agent
- What do current leases actually rent for vs. the listed asking? Can we see a recent rent roll and the last 12 months of T-12 income?
- Is there a deadline driving the sale (1031 exchange, divorce, estate, relocation)? That informs how much negotiation room exists.
- Crime grade is F in this area — have there been break-ins, vandalism, or insurance claims at this property in the last 3 years? What carrier currently insures it and at what premium?
- The area grade is low — what's the realistic commute time and amenity access for the typical tenant pool here? Any planned neighborhood developments (good or bad) we should know about?
- What's the average days-on-market for RENTAL listings here right now (not sales)? A rising rental-DOM trend means longer vacancies and softer asking-rent achievability than the comps imply.
- What's the recent tenant-quality profile in this submarket — average credit score on applications, eviction rate, late-payment / NSF rate, and stable-employment percentage? A property-management company in the area should have these aggregated.
- How much new for-sale + rental construction is in the pipeline within 1–3 miles? Heavy new supply typically softens prices + rents 12–24 months out; constrained supply supports both.
Investment metrics
- 1% rule
- 0.75% ✗
- Cap rate
- 4.98%
- Cash-on-cash
- -4.70%
- DSCR
- 0.79
- GRM
- 11.1
CMA / ARV
- ARV (on-the-fly)
- $192,192
- Comps found
- 1
Show comp detail 1 sale within ~0.75 mi
| Address | Dist | Beds/Ba | Sqft | Sold | Price | $/sf | Match |
|---|---|---|---|---|---|---|---|
| 143 W Broad St | 0.51mi | 2/2.0 (-1) | 1,055 (-14%) | 4mo | $165,000 | $156 | 42 |
Match score weights: distance 35% · size 25% · config 20% · recency 20%. Top-matched comps best support the ARV.
Projected returns pro-forma
-3.0% appreciation · 3.0% rent growth · sell at horizon
- IRR
- -24.2%
- Equity multiple
- 0.17×
- Total profit
- $-53,882
- Equity at exit
- $34,667
- IRR
- -19.5%
- Equity multiple
- -0.04×
- Total profit
- $-67,660
- Equity at exit
- $20,102
Cash invested: $65,100 (down + closing). Projections, not guarantees.
Landlord ↔ Tenant lean methodology
- Overall (STATE)
- 62 Landlord-Friendly
- State Pennsylvania
- 62 Landlord-Friendly · EVEN
- County
- — inherits STATE
- City
- — inherits STATE
ZIP-level market 17356
- Home prices YoY
- -21.0%
- Active inventory
- 147
- Price-to-rent
- 11.1×
Monthly cashflow live
- Estimated rent
- $1,753 high interval (Pro) →
- Mortgage (P&I)
- −$1,219
- Tax from tax record
- −$324 /mo · $3,884/yr
- Insurance
- −$97
- HOA
- −$0
- Vacancy / Maint / Mgmt
- −$368
- Net cashflow
- $-255
Break-even live
UW: 25.0% down · 7.5% · 30yr · 1.5% tax · 5.0% vac · 8.0% maint · 8.0% mgmt
Financing live
Cash to close
- Down payment
- $58,125
- Closing costs
- $6,975
- Reserves months
- —
- Total cash needed
- —
Loan-product check · same deal, 3 products live
Conventional
25% down · 7.5% · 30yr
- Down + closing
- —
- Monthly P&I
- —
- Monthly cashflow
- —
- DSCR
- —
- Eligible?
- —
Personal DTI + credit; lowest rate.
DSCR
20% down · 8.5% · 30yr
- Down + closing
- —
- Monthly P&I
- —
- Monthly cashflow
- —
- DSCR
- —
- Eligible?
- —
No personal income docs; deal must DSCR.
Hard money
10% down · 12.0% · 12mo
- Down + closing
- —
- Monthly P&I
- —
- Monthly cashflow
- —
- DSCR
- —
- Eligible?
- —
Short-term bridge; refi at stabilization.
Rent comps 6 comps
| Address | Beds | Baths | Sqft | Rent | $/sqft | DOM | Units | Dist |
|---|---|---|---|---|---|---|---|---|
| 306 Orchard Ct Red Lion, PA | 2.0 | 1.5 | 1300 | $1,495 | $1.15 | 21d | 1 | 0.31mi |
| 224 Sienna Ln Yoe, PA | 3.0 | 2.5 | 1252 | $1,979 | $1.58 | 21d | 1 | 0.54mi |
| 406 Valor Way Red Lion, PA | 3.0 | 2.5 | 1252 | $1,875 | $1.50 | 21d | 1 | 0.54mi |
| 21 Windsor Way Red Lion, PA | 3.0 | 2.0–2.5 | 1385 | $2,150 | $1.55 | 13d | 8 | 0.55mi |
| 100 E Broad St Dallastown, PA | 2.0 | 1.0 | 920 | $950 | $1.03 | 13d | 1 | 1.06mi |
| 361 E Maple St Dallastown, PA | 2.0 | 1.0 | 750 | $1,005 | $1.34 | 21d | 1 | 1.12mi |
Listing history 2 events
-
2026-06-19remarks 699-char remark
-
2026-06-19$232,500 Coming Soon 1 DOM
ⓘ Source: listings_history table (triggers on properties + properties_extension) + one-shot
backfill from property_details.listing_events for pre-trigger history.
Tax reassessment forecast PA · Partial reset (capped growth)
- Current annual tax
- $3,884 · $324/mo
- Projected year-2 tax
- $3,884 · $324/mo
- Expected delta
- $0/yr ($0/mo · 0.0%)
ⓘ Screening estimate from a state-policy table — verify with the county assessor before closing.
Climate risk First Street
- Flood 1/10 Low FEMA zone X (unshaded) · 0% chance over 30 yrs
- Wildfire 1/10 Low
- Heat 5/10 Major 7 d/yr ≥100°F today · 15 d/yr by 30 yrs out
- Wind 4/10 Moderate 14% chance of damaging wind over 30 yrs
- Air quality 3/10 Moderate 2 unhealthy d/yr today · 5 by 30 yrs out
Nearby sold comps map
Loading sold comps map…
Walkable amenities ~0.75 mi
Loading nearby amenities…
Taxation est. · year 1
- Rental income
- $21,031
- − Mortgage interest
- −$13,024
- − Property taxes
- −$3,884
- − Insurance
- −$1,162
- − Repairs & maintenance
- −$1,683
- − Management
- −$1,683
- − Depreciation
- −$6,764
- Taxable loss
- −$7,167
- Est. tax savings @ 24.0%
- +$1,720
- After-tax cash flow
- $-1,342/yr
For passive investors: Depreciation is non-cash, so a rental often shows a tax loss while cash-flowing — sheltering income. Rental losses are passive: they offset passive income freely, and up to $25,000/yr can offset ordinary (W-2) income if you actively participate and your MAGI is under $100k (phasing out to $0 by $150k); unused losses carry forward. On sale, claimed depreciation is recaptured at up to 25%, and gains may owe capital-gains tax (a 1031 exchange can defer both). Figures are a year-1 estimate at your 24.0% rate — not tax advice; consult a CPA.
Schools (NCES district)
- District
- Dallastown Area SD
- NCES district ID
- 4207230
- Math proficiency
- 47% ▼ -5.00%
- Reading proficiency
- 63% ▼ -9.00%
- Median HH income
- $61,805
- Composite
- 48.0/100
- National rank
- #2199
- State rank
- #102 of 539 in PA
Livability — York
- Score
- 75/100
- State rank
- #427
- US rank
- #3987
Category grades
Schools grade is shown separately in the Schools card above.
Census & demographics
- County
- York County · 278,806 people
- City population
- 184,764
- Metro
- York-Hanover, PA
- Population (ZIP)
- 22,869
- Household income
- $86,561
- Rent vs Own
- Severe rent burden
- 559.0
Population outlook (York County) Hauer SSP2
- Today (2025)
- 454,205 people
- By 2030
- 457,407 · +0.7%
- By 2040
- 457,529 · +0.7%
- By 2050
- 448,261 · -1.3%
- By 2075
- 427,388 · -5.9%
- By 2100
- 384,218 · -15.4%
Race, ethnicity, and origin ACS 2023
- Neighborhood character
- Predominantly White (89%)
- Race & ethnicity
- White 89% Black 4% Two or more races 4% Asian 2% Hispanic / Latino 2%
- Common ancestry
- Romanian 3% Slovak 3% Serbian 2%
- Foreign-born
- 4% · China
- Languages at home
- 95% English-only · Russian/Polish/Slavic 1% Chinese 1% Other Indo-European 1%
Political lean MEDSL · York
- 2024 margin
- Strong R (+25.3) · D 36.9% · R 62.1%
- 2008→2024 swing
- -11.7pp toward R · 2008: -13.6pp · 2024: -25.3pp
- All cycles
- 2024: R+25.3 2020: R+24.6 2016: R+29.3 2012: R+21.2 2008: R+13.6
Not yet ingested
- Civics
- —
Market trends
- HPI YoY
- ▼ -69.16%
- Current HPI
- 259.7294
- Rent YoY
- —
- Metro
- York-Hanover, PA
- State GDP YoY
- ▲ 1.68%
- F500 in state
- 34
Industry mix (Fortune 500 HQ in PA)
| Industry | F500 HQs | Revenue |
|---|---|---|
| Healthcare | 2 | $309B |
|
||
| Insurance | 2 | $27B |
|
||
| Telecommunications / Media | 1 | $124B |
|
||
| Industrial Distribution | 1 | $22B |
|
||
| Financial Services | 1 | $20B |
|
||
| Chemicals / Materials | 1 | $18B |
|
||
Price history
+145.0% since first listed17 events — show timeline
- 2026-06-18 Coming Soon $232,500 BRIGHT MLS
- 2022-07-22 Sold (Public Records) $248,000 Public Records
- 2015-12-17 Sold (MLS) $116,000 BRIGHT MLS
- 2015-10-13 Listing Removed — BRIGHT MLS
- 2015-08-10 Listed $110,000 BRIGHT MLS
- 2014-03-13 Listing Removed — BRIGHT MLS
- 2012-09-13 Listed $105,000 BRIGHT MLS
- 2006-06-01 Listing Removed — BRIGHT MLS
- 2006-01-31 Listed $179,900 BRIGHT MLS
- 2003-11-03 Sold (Public Records) $112,500 Public Records
- 2003-10-31 Sold (MLS) $112,500 BRIGHT MLS
- 2003-08-22 Listed $114,899 BRIGHT MLS
- 1999-05-19 Sold (Public Records) $92,000 Public Records
- 1999-05-17 Sold (MLS) $92,000 BRIGHT MLS
- 1999-03-30 Listing Removed — BRIGHT MLS
- 1998-11-10 Listed $94,900 BRIGHT MLS
- 1993-09-22 Sold (Public Records) $94,900 Public Records
Property tax history
+2.1%/yrLatest (2026): $3,884 · +4.1% YoY. Source: county tax records.
Cash-flow waterfall
monthlySold comps — $/sqft
last 12 mo · ≤1 miLoading sold comps…