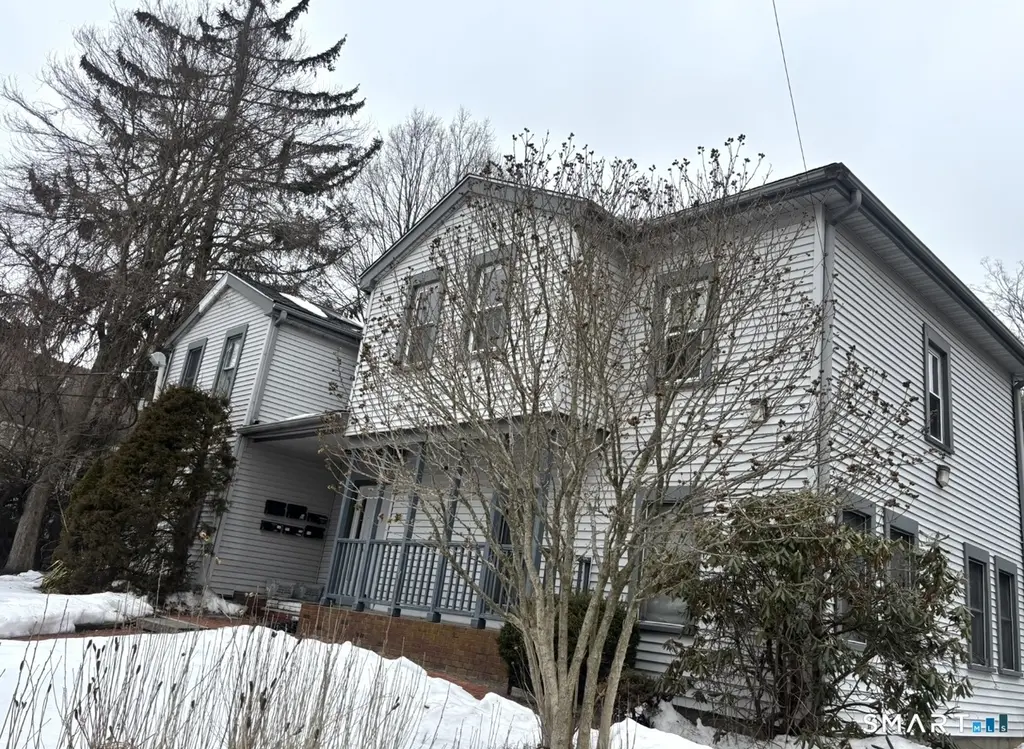
44 Hard St #2 · New Haven, CT
Flood risk 1/10 · Minimal
- FEMA flood zone
- X (unshaded)
- Chance of flooding over 30 yrs
- 0.0%
- Est. flood insurance / yr
- $507 – $1,088
Fire risk 2/10 · Minimal
- Est. fire insurance / yr
- $829 – $1,539
Heat risk 6/10 · Moderate
- Hot days now (above 99°F)
- 7 days/yr
- Hot days in 30 yrs
- 17 days/yr
Wind risk 6/10 · Moderate
- Chance of severe wind over 30 yrs
- 53.0%
Air-quality risk 5/10 · Moderate
- Unhealthy air days now
- 5 days/yr
- Unhealthy air days in 30 yrs
- 8 days/yr
Risk factors via First Street. Map © Google.
Why this score? — see what drove the C+ grade
The composite is a weighted blend of 9 inputs, each scored 0–100. Each bar is that input's sub-score; the figure is the points it added to the 100-point composite (weight × sub-score).
- Cash flow +20.5/30.0
- ARV discount +15.0/15.0
- 1% rule +8.4/10.0
- DSCR +6.5/10.0
- Livability +4.0/5.0
- Rent growth +3.1/5.0
- Condition / age +2.5/5.0
- Schools +1.5/10.0
- Appreciation +0.0/10.0
$155,000
🖨 Deal sheet 📄 Offer letter ✓ Due diligence
Listing remarks MLS
In a complex of 5 condo's this is the most unique!Step down lr.&Dr.W/11 ft. Ceilings,many windows &private rear door w/brick patio & 2 adj.Park. Spaces.Fully equip.Eat in kit,2full baths.Well maintained.Shows well!
Key facts
- $350 HOA
- 2 parking spots
- Built 1875
Property features AI
Finance
- Other: Pets allowed with restrictions; Part of a 5-unit building
- HOA & community: Homeowners association with monthly fee; HOA fee $350 monthly; HOA covers grounds maintenance, snow removal, water and sewer
Exterior
- Parking: Off-street parking; 2 parking spaces
- Utilities: Public water; Public sewer; Natural gas hot water
- Home design: Condominium (Condo/Co-Op For Sale)
- Construction: Frame construction
- Exterior features: Vinyl siding; Level lot
Interior
- Kitchen: Dishwasher; Oven/Range; Refrigerator
- Bedrooms: 2 bedrooms
- Bathrooms: 2 full bathrooms
- Heating & cooling: Hot water heat (natural gas); Central air
- Interior features: Central air conditioning; Full, unfinished basement
Neighborhood map
What this means for you Summary
Snapshot
- This is a 2-bed/2.0-bath condo listed at $155k.
Deal economics
- At list price, monthly cash flow is $205 ($2k/yr) — positive.
- The deal already cash-flows at list — no discount required.
- Meets the 1% rule at list price ($2k rent vs $155k).
- Cap rate 7.9% vs local median 4.8% in New Haven — top-decile yield for the area; either an underpriced asset or a hidden risk that comps aren't pricing in. Stress-test before assuming the spread holds.
Location & tenants
- Location reads 79/100 on livability (#31 in CT, #2,190 nationally) — a middle-class / working-renter tenant base. Strengths: amenities A+, commute A+, health & safety A+; Watch: schools D+, employment D, crime F.
- New Haven School District (urban): math 12% / reading 25% proficiency, ranked #147 of 153 in CT (top 96%) — low school quality limits family demand, transient renter base, plan for 1-2y turnover; 66% free/reduced lunch — lower-income household profile, screen leases tightly.
- Market conditions: Rents rising (+2.4%/yr); 37 active listings in the ZIP; 40 comparable units currently listed for rent nearby; rentals at typical pace (median 23d on market — plan ~3-4 weeks tenant-placement turnaround); 1,059 units permitted in South Central Connecticut Planning Region in 2024 (779 in 5+ unit buildings).
- This rent runs 34% of the median local income ($74k/yr) — at the standard rent-burdened threshold; future hikes will face affordability resistance.
Forward outlook
- Local home prices are declining (-3.0%/yr); year-one equity from $1k of loan paydown is wiped out by about $5k of value loss. Plan a longer hold.
Negotiation context
- Only 6 days on market — expect competitive offers; lowballing is unlikely to land.
- 3 sale attempts since 26y ago with the ask held roughly flat each time — persistent listings suggest the price (not the market) is what's stuck; bring a comps-based counter.
- Current owner paid $70k; list at $155k implies a 122% gain — meaningful room to come down on a strong offer.
Risks & watch-outs
- Watch-outs: built in 1875 — expect roof / HVAC / electrical / plumbing capex.
- Climate carrying-cost: major wind risk, 53% chance of damaging wind over 30y; extreme-heat days projected 7→17/yr by 2055 (HVAC capex compounding) — expect insurance premiums to compound above CPI over the hold.
Questions for the listing agent
- Built in 1875 — when were the roof, HVAC, electrical panel, plumbing, and water heater last replaced?
- What does the HOA fee cover, when was the last increase, and are there any pending special assessments or reserve-fund shortfalls?
- Any open or pending special assessments — roof, HVAC, plumbing, elevator, façade? What's the per-unit balance and payoff schedule, and is the seller paying it off at close or rolling it to the buyer?
- Is there a deadline driving the sale (1031 exchange, divorce, estate, relocation)? That informs how much negotiation room exists.
- Schools are D-rated, which usually means shorter tenancies and higher turnover. Who's the typical renter profile here, and what's been the actual vacancy rate?
- Crime grade is F in this area — have there been break-ins, vandalism, or insurance claims at this property in the last 3 years? What carrier currently insures it and at what premium?
- What's the average days-on-market for RENTAL listings here right now (not sales)? A rising rental-DOM trend means longer vacancies and softer asking-rent achievability than the comps imply.
- What's the recent tenant-quality profile in this submarket — average credit score on applications, eviction rate, late-payment / NSF rate, and stable-employment percentage? A property-management company in the area should have these aggregated.
- How much new apartment / multifamily construction is in the pipeline within 1–3 miles? Heavy new supply (>2% of stock underway) typically softens rents 12–24 months out; light construction supports rent growth.
Investment metrics
- 1% rule
- 1.34% ✓
- Cap rate
- 7.88%
- Cash-on-cash
- 5.67%
- DSCR
- 1.25
- GRM
- 6.2
CMA / ARV
- ARV (median comp)
- $237,467
- List price
- $155,000
- Delta
- -34.73%
- Verdict
- UNDERPRICED
- Comps
- 20 within 1.0 mi
Projected returns pro-forma
-3.0% appreciation · 2.42% rent growth · sell at horizon
- IRR
- -8.2%
- Equity multiple
- 0.70×
- Total profit
- $-13,006
- Equity at exit
- $23,111
- IRR
- 0.6%
- Equity multiple
- 1.04×
- Total profit
- $1,641
- Equity at exit
- $13,402
Cash invested: $43,400 (down + closing). Projections, not guarantees.
Landlord ↔ Tenant lean methodology
- Overall (STATE)
- 27 Tenant-Leaning
- State Connecticut
- 27 Tenant-Leaning · D+7
- County
- — inherits STATE
- City
- — inherits STATE
ZIP-level market 06515
- Home prices YoY
- -12.3%
- Rents YoY
- 2.4%
- Active inventory
- 37
- Price-to-rent
- 6.2×
Monthly cashflow live
- Estimated rent
- $2,079 high interval (Pro) →
- Mortgage (P&I)
- −$813
- Tax from tax record
- −$210 /mo · $2,521/yr
- Insurance
- −$65
- HOA
- −$350
- Vacancy / Maint / Mgmt
- −$437
- Net cashflow
- $205
Break-even live
UW: 25.0% down · 7.5% · 30yr · 1.5% tax · 5.0% vac · 8.0% maint · 8.0% mgmt
Financing live
Cash to close
- Down payment
- $38,750
- Closing costs
- $4,650
- Reserves months
- —
- Total cash needed
- —
Loan-product check · same deal, 3 products live
Conventional
25% down · 7.5% · 30yr
- Down + closing
- —
- Monthly P&I
- —
- Monthly cashflow
- —
- DSCR
- —
- Eligible?
- —
Personal DTI + credit; lowest rate.
DSCR
20% down · 8.5% · 30yr
- Down + closing
- —
- Monthly P&I
- —
- Monthly cashflow
- —
- DSCR
- —
- Eligible?
- —
No personal income docs; deal must DSCR.
Hard money
10% down · 12.0% · 12mo
- Down + closing
- —
- Monthly P&I
- —
- Monthly cashflow
- —
- DSCR
- —
- Eligible?
- —
Short-term bridge; refi at stabilization.
Rent comps 40 comps
| Address | Beds | Baths | Sqft | Rent | $/sqft | DOM | Units | Dist |
|---|---|---|---|---|---|---|---|---|
| 25 Springside Ave New Haven, CT | 2.0–3.0 | 1.0 | 800 | $1,595 | $1.99 | 3d | 3 | 0.13mi |
| 25 Springside Ave Unit 35 Springside 1B New Haven, CT | 3.0 | 1.0 | 900 | $1,895 | $2.11 | 23d | 1 | 0.13mi |
| 433 Blake St #433 New Haven, CT | 2.0 | 2.5 | 1414 | $2,700 | $1.91 | 2d | 1 | 0.15mi |
| 400 Blake St New Haven, CT | 1.0–2.0 | 1.0–2.0 | 965 | $2,895 | $3.00 | 2d | 30 | 0.21mi |
| 330 Blake St Unit C-2 New Haven, CT | 3.0 | 2.0 | 1200 | $1,995 | $1.66 | 23d | 1 | 0.24mi |
| 841 Whalley Ave Unit B New Haven, CT | 2.0 | 1.0 | 972 | $2,200 | $2.26 | 2d | 1 | 0.35mi |
| 1005 Whalley Ave Unit 2 New Haven, CT | 2.0 | 1.0 | 1200 | $1,700 | $1.42 | 43d | 1 | 0.36mi |
| 115 Diamond St New Haven, CT | 2.0 | 1.0 | 1067 | $2,055 | $1.93 | 14d | 6 | 0.42mi |
| 195 Valley St New Haven, CT | 2.0 | 1.0 | 832 | $1,700 | $2.04 | 43d | 1 | 0.42mi |
| 326 W Rock Ave Unit 2 New Haven, CT | 2.0 | 1.0 | 1500 | $2,000 | $1.33 | 43d | 1 | 0.49mi |
| 315 Alden Ave Unit 1 New Haven, CT | 2.0 | 2.0 | 1212 | $1,915 | $1.58 | 43d | 1 | 0.54mi |
| 188 Fountain St Unit 3 New Haven, CT | 2.0 | 1.0 | 926 | $2,800 | $3.02 | 43d | 1 | 0.57mi |
| 252 Goffe Ter Unit 2 New Haven, CT | 3.0 | 1.0 | 1191 | $2,000 | $1.68 | 14d | 1 | 0.64mi |
| 252 Goffe Ter Unit 2 New Haven, CT | 3.0 | 1.0 | 1191 | $2,000 | $1.68 | 3d | 1 | 0.64mi |
| 252 Goffe Ter Unit 3 New Haven, CT | 3.0 | 1.0 | 1100 | $1,995 | $1.81 | 14d | 1 | 0.64mi |
| 1253 Forest Rd #2 New Haven, CT | 2.0 | 1.0 | 1100 | $2,250 | $2.05 | 23d | 1 | 0.67mi |
| 209 Willard St Unit 3 New Haven, CT | 1.0 | 1.0 | 957 | $1,800 | $1.88 | 43d | 1 | 0.68mi |
| 48 Pardee Pl New Haven, CT | 2.0 | 1.0 | 1000 | $1,800 | $1.80 | 23d | 1 | 0.69mi |
| 37 Fairfield St Unit 2nd Floor New Haven, CT | 2.0 | 1.0 | 1233 | $1,850 | $1.50 | 23d | 1 | 0.69mi |
| 218 W Rock Ave #3 New Haven, CT | 2.0 | 1.0 | 924 | $1,800 | $1.95 | 3d | 1 | 0.70mi |
| 26 Whittlesey Ave Unit 2 New Haven, CT | 3.0 | 1.0 | 1300 | $1,900 | $1.46 | 14d | 1 | 0.70mi |
| 26 Whittlesey Ave Unit 1 New Haven, CT | 3.0 | 1.0 | 1300 | $1,900 | $1.46 | 43d | 1 | 0.70mi |
| 134 Hubinger St Unit 2 New Haven, CT | 3.0 | 2.0 | 1358 | $2,700 | $1.99 | 43d | 1 | 0.70mi |
| 134 Hubinger St Unit 2 New Haven, CT | 3.0 | 2.0 | 1358 | $2,700 | $1.99 | 23d | 1 | 0.70mi |
| 253 W Elm St Unit 2 New Haven, CT | 3.0 | 1.0 | 1434 | $2,650 | $1.85 | 2d | 1 | 0.72mi |
| 207 Alden Ave Unit 3 New Haven, CT | 1.0 | 1.0 | 900 | $1,750 | $1.94 | 19d | 1 | 0.74mi |
| 69 Fairfield St New Haven, CT | 2.0 | 1.0 | 1280 | $1,900 | $1.48 | 23d | 1 | 0.75mi |
| 47 W Prospect St Unit 2 New Haven, CT | 2.0 | 1.0 | 1298 | $2,450 | $1.89 | 3d | 1 | 0.79mi |
| 43 W Prospect St Unit 3 New Haven, CT | 2.0 | 1.0 | 1250 | $2,575 | $2.06 | 2d | 1 | 0.79mi |
| 101 E Ramsdell St New Haven, CT | 2.0 | 1.0 | 995 | $1,555 | $1.56 | 14d | 4 | 0.81mi |
| 55 Marvel Rd Unit B1 New Haven, CT | 1.0 | 1.0 | 1200 | $2,000 | $1.67 | 14d | 1 | 0.81mi |
| 55 Marvel Rd Unit A3 New Haven, CT | 3.0 | 1.0 | 1300 | $2,750 | $2.12 | 2d | 1 | 0.81mi |
| 126 Hobart St Unit 1 New Haven, CT | 2.0 | 1.0 | 1212 | $1,850 | $1.53 | 23d | 1 | 0.83mi |
| 471 Whalley Ave Unit D New Haven, CT | 2.0 | 2.0 | 1150 | $2,200 | $1.91 | 43d | 1 | 0.84mi |
| 52 Hilltop Rd Unit 52 New Haven, CT | 2.0 | 1.0 | 1000 | $1,800 | $1.80 | 43d | 1 | 0.84mi |
| 306 Pine Rock Ave Unit D11 Hamden, CT | 2.0 | 1.0 | 825 | $1,600 | $1.94 | 2d | 1 | 0.86mi |
| 111 Hobart St Apt 2 New Haven, CT | 3.0 | 1.0 | 1220 | $2,500 | $2.05 | 43d | 1 | 0.86mi |
| 109 Hobart St Apt 1 New Haven, CT | 3.0 | 1.0 | 1220 | $2,500 | $2.05 | 43d | 1 | 0.87mi |
| 954 Elm St Unit 3 New Haven, CT | 2.0 | 1.0 | 866 | $2,350 | $2.71 | 23d | 1 | 0.87mi |
| 954 Elm St Unit 2 New Haven, CT | 2.0 | 1.0 | 1154 | $3,000 | $2.60 | 43d | 1 | 0.87mi |
HOA detail condo
- Monthly dues
- $350 · $4,200/yr
- Assessments
- None detected in remarks — confirm with the listing agent.
Listing history 7 events
-
2026-05-04status Under Contract 349-char remark
-
2026-04-28$155,000 Active 349-char remark
-
2008-09-08historical
-
2008-03-07$149,900
-
2000-10-26soldstatus $69,937
-
2000-10-24soldstatus $67,900
Show marketing remark (226 chars)
In a complex of 5 condo's this is the most unique!Step down lr.&Dr.W/11 ft. Ceilings,many windows &private rear door w/brick patio & 2 adj.Park. Spaces.Fully equip.Eat in kit,2full baths.Well maintained.Shows well!
-
2000-07-04$67,900
Show marketing remark (226 chars)
In a complex of 5 condo's this is the most unique!Step down lr.&Dr.W/11 ft. Ceilings,many windows &private rear door w/brick patio & 2 adj.Park. Spaces.Fully equip.Eat in kit,2full baths.Well maintained.Shows well!
ⓘ Source: listings_history table (triggers on properties + properties_extension) + one-shot
backfill from property_details.listing_events for pre-trigger history.
Tax reassessment forecast CT · Partial reset (capped growth)
- Current annual tax
- $2,521 · $210/mo
- Projected year-2 tax
- $2,919 · $243/mo
- Expected delta
- +$398/yr (+$33/mo · 15.8%)
ⓘ Screening estimate from a state-policy table — verify with the county assessor before closing.
Climate risk First Street
- Flood 1/10 Low FEMA zone X (unshaded) · 0% chance over 30 yrs
- Wildfire 2/10 Low
- Heat 6/10 Major 7 d/yr ≥99°F today · 17 d/yr by 30 yrs out
- Wind 6/10 Major 53% chance of damaging wind over 30 yrs
- Air quality 5/10 Major 5 unhealthy d/yr today · 8 by 30 yrs out
Nearby sold comps map
Loading sold comps map…
Walkable amenities ~0.75 mi
Loading nearby amenities…
Taxation est. · year 1
- Rental income
- $24,950
- − Mortgage interest
- −$8,682
- − Property taxes
- −$2,521
- − Insurance
- −$775
- − Repairs & maintenance
- −$1,996
- − Management
- −$1,996
- − HOA
- −$4,200
- − Depreciation
- −$4,509
- Taxable income
- $271
- Est. tax owed @ 24.0%
- −$65
- After-tax cash flow
- $2,396/yr
For passive investors: Depreciation is non-cash, so a rental often shows a tax loss while cash-flowing — sheltering income. Rental losses are passive: they offset passive income freely, and up to $25,000/yr can offset ordinary (W-2) income if you actively participate and your MAGI is under $100k (phasing out to $0 by $150k); unused losses carry forward. On sale, claimed depreciation is recaptured at up to 25%, and gains may owe capital-gains tax (a 1031 exchange can defer both). Figures are a year-1 estimate at your 24.0% rate — not tax advice; consult a CPA.
Schools (NCES district)
- District
- New Haven School District
- NCES district ID
- 0902790
- Math proficiency
- 12% ▼ -10.00%
- Reading proficiency
- 25% ▼ -10.00%
- Median HH income
- $38,058
- Composite
- 15.48/100
- National rank
- #9308
- State rank
- #147 of 153 in CT
Livability — New Haven
- Score
- 79/100
- State rank
- #31
- US rank
- #2190
Category grades
Schools grade is shown separately in the Schools card above.
Census & demographics
- Census place
- New Haven, CT
- County
- New Haven County · 688,236 people
- City population
- 132,813
- Metro
- New Haven-Milford, CT
- Population (ZIP)
- 19,006
- Household income
- $73,709
- Rent vs Own
- Severe rent burden
- 1156.0
Population outlook (South Central Connecticut County) Hauer SSP2
- By 2040
- 608,362
Race, ethnicity, and origin ACS 2023
- Neighborhood character
- Highly diverse neighborhood (Simpson 0.71)
- Race & ethnicity
- White 38% Black 31% Hispanic / Latino 21% Two or more races 13% Asian 4%
- Hispanic origin (detail)
- Mexican 2% Puerto Rican 14%
- Common ancestry
- Romanian 3% Scotch-Irish 1% Lithuanian 1%
- Foreign-born
- 11% · Canada, China, Jamaica
- Languages at home
- 78% English-only · Spanish 15% Other Indo-European 2% Chinese 1%
Political lean MEDSL · South Central Connecticut
- 2024 margin
- Strong D (+20.1) · D 59.0% · R 38.9% · Other 2.1%
- All cycles
- 2024: D+20.1
Not yet ingested
- Civics
- —
Market trends
- HPI YoY
- ▼ -44.45%
- Current HPI
- 317.0482
- Rent YoY
- ▲ 2.42%
- Metro
- New Haven-Milford, CT
- State GDP YoY
- ▲ 1.06%
- F500 in state
- 38
Industry mix (Fortune 500 HQ in CT)
| Industry | F500 HQs | Revenue |
|---|---|---|
| Industrial Machinery | 4 | $38B |
|
||
| Insurance | 3 | $71B |
|
||
| Financial Services | 2 | $25B |
|
||
| Transportation / Logistics | 2 | $18B |
|
||
| Healthcare | 1 | $247B |
|
||
| Telecommunications | 1 | $55B |
|
||
Price history
+128.3% since first listed7 events — show timeline
- 2026-05-04 Pending — Smart MLS
- 2026-04-28 Listed $155,000 Smart MLS
- 2008-09-08 Listing Removed — Smart MLS
- 2008-03-07 Listed $149,900 Smart MLS
- 2000-10-26 Sold (Public Records) $69,937 Public Records
- 2000-10-24 Sold (MLS) $67,900 Smart MLS
- 2000-07-04 Listed $67,900 Smart MLS
Property tax history
+0.1%/yrLatest (2023): $2,521 · -6.4% YoY. Source: county tax records.
Cash-flow waterfall
monthlySold comps — $/sqft
last 12 mo · ≤1 miLoading sold comps…