 🏷️ Likely Rental
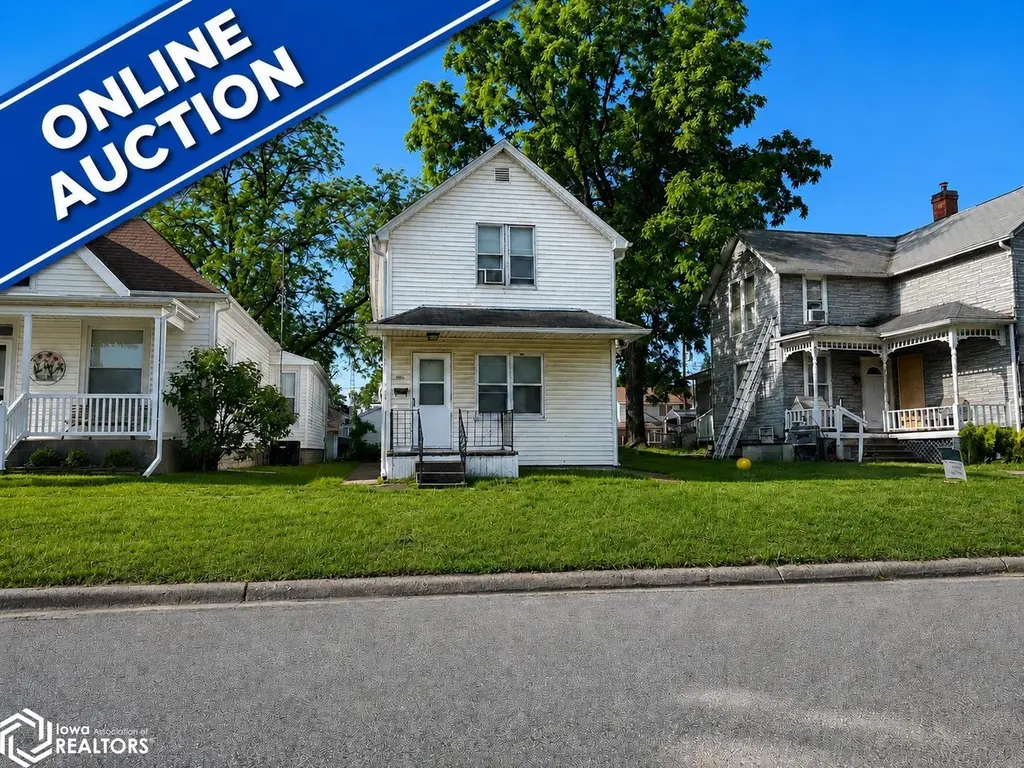
2806 Avenue K · Fort Madison, IA
Flood risk 1/10 · Minimal
- FEMA flood zone
- X (unshaded)
- Chance of flooding over 30 yrs
- 0.0%
- Est. flood insurance / yr
- $473 – $860
Fire risk 3/10 · Minor
- Est. fire insurance / yr
- $902 – $1,676
Heat risk 4/10 · Minor
- Hot days now (above 107°F)
- 7 days/yr
- Hot days in 30 yrs
- 16 days/yr
Wind risk 2/10 · Minimal
- Chance of severe wind over 30 yrs
- —
Air-quality risk 2/10 · Minimal
- Unhealthy air days now
- 0 days/yr
- Unhealthy air days in 30 yrs
- 1 days/yr
Risk factors via First Street. Map © Google.
Why this score? — see what drove the B grade
The composite is a weighted blend of 9 inputs, each scored 0–100. Each bar is that input's sub-score; the figure is the points it added to the 100-point composite (weight × sub-score).
- Cash flow +30.0/30.0
- 1% rule +10.0/10.0
- DSCR +10.0/10.0
- ARV discount +7.5/15.0
- Schools +4.8/10.0
- Livability +3.8/5.0
- Rent growth +2.5/5.0
- Condition / age +2.5/5.0
- Appreciation +0.0/10.0
$41,490
🖨 Deal sheet 📄 Offer letter ✓ Due diligence
Listing remarks
Property selling at Online Only Auction! Modest 2 bedroom, 1 ½ bath home with 1,155 sq. ft. of living space and detached 1 car garage off of the alley. It has a gas forced air furnace, window air and appliances remain with the home. It needs updating (one tenant occupied for the past 18 years) but could be a great rental or starter home. It has a current rental permit from the City of Fort Madison. Bidding is open to everyone and can be completed conveniently from anywhere using your phone, tablet, or computer. List price is assessed value and has no bearing on final sale price.
Key facts
- 3,485 sq ft lot
- Garage
- Built 1895
Property features AI
Exterior
- Parking: Detached 1-car garage
- Utilities: Public water; Public sewer
- Home design: Single-family residence; Two levels
- Construction: Vinyl siding
- Exterior features: Lot approximately 25 x 130 (0.08 acres); Directions: Between 28th and 29th Streets on Avenue K
Interior
- Bathrooms: 1 full bathroom; 1 half bathroom
- Heating & cooling: Forced air heating; Window unit cooling
- Interior features: Basement
Neighborhood map
What this means for you Summary
Snapshot
- This is a 2-bed/1.5-bath single-family listed at $41k.
Deal economics
- At list price, monthly cash flow is $262 ($3k/yr) — positive.
- The deal already cash-flows at list — no discount required.
- Meets the 1% rule at list price ($715 rent vs $41k).
- Cap rate 13.9% vs local median 5.3% in Fort Madison — top-decile yield for the area; either an underpriced asset or a hidden risk that comps aren't pricing in. Stress-test before assuming the spread holds.
Location & tenants
- Location reads 75/100 on livability (#230 in IA, #4,353 nationally) — a middle-class / working-renter tenant base. Strengths: cost of living A+, housing A+, health & safety A+; Watch: commute F, employment D-.
- Fort Madison Community School District (town): math 55% / reading 58% proficiency, ranked #260 of 289 in IA (top 90%) — acceptable for families but not a draw, mixed tenant base, ~2y average lease.
- Market conditions: 64 active listings in the ZIP; 1 comparable units currently listed for rent nearby; 15 units permitted in Lee County in 2024 (0 in 5+ unit buildings).
Forward outlook
- Local home prices are declining (-3.0%/yr); year-one equity from $286 of loan paydown is wiped out by about $1k of value loss. Plan a longer hold.
- Lee County population projected at -15% by 2050 — secular population decline; favor cash flow + early exit over multi-decade hold.
- At projected returns (-3.0% appreciation + 3.0% rent growth), your $12k cash investment doubles in ~5 years — after that, you're playing with house money.
Negotiation context
- Only 14 days on market — expect competitive offers; lowballing is unlikely to land.
Risks & watch-outs
- Watch-outs: built in 1895 — expect roof / HVAC / electrical / plumbing capex.
Questions for the listing agent
- Built in 1895 — when were the roof, HVAC, electrical panel, plumbing, and water heater last replaced?
- Is there a deadline driving the sale (1031 exchange, divorce, estate, relocation)? That informs how much negotiation room exists.
- Schools are B-rated — typically a magnet for longer-tenancy family renters. What's the average tenant stay here, and is there a school-zone premium baked into asking?
- What's the average days-on-market for RENTAL listings here right now (not sales)? A rising rental-DOM trend means longer vacancies and softer asking-rent achievability than the comps imply.
- What's the recent tenant-quality profile in this submarket — average credit score on applications, eviction rate, late-payment / NSF rate, and stable-employment percentage? A property-management company in the area should have these aggregated.
- How much new for-sale + rental construction is in the pipeline within 1–3 miles? Heavy new supply typically softens prices + rents 12–24 months out; constrained supply supports both.
Investment metrics
- 1% rule
- 1.72% ✓
- Cap rate
- 13.88%
- Cash-on-cash
- 27.08%
- DSCR
- 2.20
- GRM
- 4.8
CMA / ARV
- ARV (on-the-fly)
- $131,670
- Comps found
- 12
Show comp detail 12 sales within ~0.75 mi
| Address | Dist | Beds/Ba | Sqft | Sold | Price | $/sf | Match |
|---|---|---|---|---|---|---|---|
| 2805 Avenue K | 0.02mi | 2/1.5 | 1,110 (-4%) | 4mo | $35,000 | $32 | 89 |
| 3030 Avenue I | 0.28mi | 3/1.5 (+1) | 1,096 (-5%) | 0mo | $74,000 | $68 | 73 |
| 23 Oak Dr Dr | 0.44mi | 3/2.0 (+1) | 1,164 (+1%) | 2mo | $160,000 | $137 | 70 |
| 3401 Avenue L | 0.48mi | 3/1.0 (+1) | 1,148 (-1%) | 3mo | $97,000 | $84 | 67 |
| 28 Oak Dr | 0.48mi | 3/1.5 (+1) | 1,200 (+4%) | 1mo | $180,000 | $150 | 65 |
| 45 Richards Dr | 0.36mi | 2/1.0 | 1,250 (+8%) | 4mo | $122,000 | $98 | 64 |
| 916 30th St | 0.19mi | 3/1.0 (+1) | 1,000 (-13%) | 2mo | $140,000 | $140 | 60 |
| 10 Oak Dr | 0.36mi | 3/2.0 (+1) | 1,038 (-10%) | 1mo | $153,000 | $147 | 58 |
| 225 Vica Ln | 0.61mi | 3/2.0 (+1) | 1,118 (-3%) | 2mo | $160,000 | $143 | 57 |
| 2301 Avenue E | 0.59mi | 3/1.0 (+1) | 1,056 (-9%) | 0mo | $119,900 | $114 | 51 |
| 33 Storms Ct | 0.45mi | 3/2.5 (+1) | 1,296 (+12%) | 3mo | $148,000 | $114 | 47 |
| 1317 23rd St. St | 0.46mi | 1/1.0 (-1) | 983 (-15%) | 2mo | $17,000 | $17 | 45 |
Match score weights: distance 35% · size 25% · config 20% · recency 20%. Top-matched comps best support the ARV.
Projected returns pro-forma
-3.0% appreciation · 3.0% rent growth · sell at horizon
- IRR
- 21.1%
- Equity multiple
- 1.86×
- Total profit
- $9,994
- Equity at exit
- $6,186
- IRR
- 29.2%
- Equity multiple
- 3.61×
- Total profit
- $30,286
- Equity at exit
- $3,587
Cash invested: $11,617 (down + closing). Projections, not guarantees.
Landlord ↔ Tenant lean methodology
- Overall (STATE)
- 83 Strongly Landlord-Friendly
- State Iowa
- 83 Strongly Landlord-Friendly · R+6
- County
- — inherits STATE
- City
- — inherits STATE
ZIP-level market 52627
- Home prices YoY
- -28.6%
- Active inventory
- 64
- Price-to-rent
- 4.8×
Monthly cashflow live
- Estimated rent
- $715 medium interval (Pro) →
- Mortgage (P&I)
- −$218
- Tax from tax record
- −$68 /mo · $814/yr
- Insurance
- −$17
- HOA
- −$0
- Vacancy / Maint / Mgmt
- −$150
- Net cashflow
- $262
Break-even live
UW: 25.0% down · 7.5% · 30yr · 1.5% tax · 5.0% vac · 8.0% maint · 8.0% mgmt
Financing live
Cash to close
- Down payment
- $10,372
- Closing costs
- $1,245
- Reserves months
- —
- Total cash needed
- —
Loan-product check · same deal, 3 products live
Conventional
25% down · 7.5% · 30yr
- Down + closing
- —
- Monthly P&I
- —
- Monthly cashflow
- —
- DSCR
- —
- Eligible?
- —
Personal DTI + credit; lowest rate.
DSCR
20% down · 8.5% · 30yr
- Down + closing
- —
- Monthly P&I
- —
- Monthly cashflow
- —
- DSCR
- —
- Eligible?
- —
No personal income docs; deal must DSCR.
Hard money
10% down · 12.0% · 12mo
- Down + closing
- —
- Monthly P&I
- —
- Monthly cashflow
- —
- DSCR
- —
- Eligible?
- —
Short-term bridge; refi at stabilization.
Rent comps 1 comps
| Address | Beds | Baths | Sqft | Rent | $/sqft | DOM | Units | Dist |
|---|---|---|---|---|---|---|---|---|
| 3421 Avenue N Fort Madison, IA | 1.0–2.0 | 1.0 | 572 | $715 | $1.25 | 43d | 5 | 0.53mi |
Listing history 12 events
-
2026-06-19days on market $41,490 Active 14 DOM
-
2026-06-18days on market $41,490 Active 13 DOM
-
2026-06-17days on market $41,490 Active 12 DOM
-
2026-06-16days on market $41,490 Active 11 DOM
-
2026-06-15days on market $41,490 Active 10 DOM
-
2026-06-14days on market $41,490 Active 8 DOM
-
2026-06-12days on market $41,490 Active 7 DOM
-
2026-06-09days on market $41,490 Active 4 DOM
-
2026-06-08days on market $41,490 Active 3 DOM
-
2026-06-07days on market $41,490 Active 2 DOM
-
2026-06-07remarks 585-char remark
-
2026-06-07$41,490 Active 1 DOM
ⓘ Source: listings_history table (triggers on properties + properties_extension) + one-shot
backfill from property_details.listing_events for pre-trigger history.
Tax reassessment forecast IA · Partial reset (capped growth)
- Current annual tax
- $814 · $68/mo
- Projected year-2 tax
- $814 · $68/mo
- Expected delta
- $0/yr ($0/mo · 0.0%)
ⓘ Screening estimate from a state-policy table — verify with the county assessor before closing.
Climate risk First Street
- Flood 1/10 Low FEMA zone X (unshaded) · 0% chance over 30 yrs
- Wildfire 3/10 Moderate
- Heat 4/10 Moderate 7 d/yr ≥107°F today · 16 d/yr by 30 yrs out
- Wind 2/10 Low
- Air quality 2/10 Low 0 unhealthy d/yr today · 1 by 30 yrs out
Nearby sold comps map
Loading sold comps map…
Walkable amenities ~0.75 mi
Loading nearby amenities…
Taxation est. · year 1
- Rental income
- $8,580
- − Mortgage interest
- −$2,324
- − Property taxes
- −$814
- − Insurance
- −$207
- − Repairs & maintenance
- −$686
- − Management
- −$686
- − Depreciation
- −$1,207
- Taxable income
- $2,655
- Est. tax owed @ 24.0%
- −$637
- After-tax cash flow
- $2,509/yr
For passive investors: Depreciation is non-cash, so a rental often shows a tax loss while cash-flowing — sheltering income. Rental losses are passive: they offset passive income freely, and up to $25,000/yr can offset ordinary (W-2) income if you actively participate and your MAGI is under $100k (phasing out to $0 by $150k); unused losses carry forward. On sale, claimed depreciation is recaptured at up to 25%, and gains may owe capital-gains tax (a 1031 exchange can defer both). Figures are a year-1 estimate at your 24.0% rate — not tax advice; consult a CPA.
Schools (NCES district)
- District
- Fort Madison Community School District
- NCES district ID
- 1911850
- Math proficiency
- 55% ▼ -7.00%
- Reading proficiency
- 58% ▼ -2.00%
- Median HH income
- $46,801
- Composite
- 47.87/100
- National rank
- #2218
- State rank
- #260 of 289 in IA
Livability — Fort Madison
- Score
- 75/100
- State rank
- #230
- US rank
- #4353
Category grades
Schools grade is shown separately in the Schools card above.
Census & demographics
- Census place
- Fort Madison, IA
- Population (ZIP)
- 12,585
Population outlook (Lee County) Hauer SSP2
- Today (2025)
- 33,813 people
- By 2030
- 32,835 · -2.9%
- By 2040
- 30,690 · -9.2%
- By 2050
- 28,777 · -14.9%
- By 2075
- 25,568 · -24.4%
- By 2100
- 21,983 · -35.0%
Race, ethnicity, and origin ACS 2023
- Neighborhood character
- Predominantly White (88%)
- Race & ethnicity
- White 88% Two or more races 5% Hispanic / Latino 5% Black 4%
- Common ancestry
- Slovak 2% Portuguese 1% Italian 1%
- Foreign-born
- 1%
- Languages at home
- 98% English-only · Spanish 2%
Political lean MEDSL · Lee
- 2024 margin
- Strong R (+27.8) · D 35.0% · R 62.9% · Other 2.1%
- 2008→2024 swing
- -43.8pp toward R · 2008: 16.0pp · 2024: -27.8pp
- All cycles
- 2024: R+27.8 2020: R+19.3 2016: R+16.1 2012: D+16.0 2008: D+16.0
Not yet ingested
- Civics
- —
Market trends
- HPI YoY
- ▼ -70.32%
- Current HPI
- 175.7708
- Rent YoY
- —
- Metro
- —
- State GDP YoY
- ▲ 2.48%
- F500 in state
- 4
Industry mix (Fortune 500 HQ in IA)
| Industry | F500 HQs | Revenue |
|---|---|---|
| Financial Services | 1 | $16B |
|
||
| Retail / Convenience | 1 | $15B |
|
||
Price history
1 event — show timeline
- 2026-06-05 Listed $41,490 IAR
Property tax history
+3.3%/yrLatest (2025): $814 · +1.5% YoY. Source: county tax records.
Cash-flow waterfall
monthlySold comps — $/sqft
last 12 mo · ≤1 miLoading sold comps…