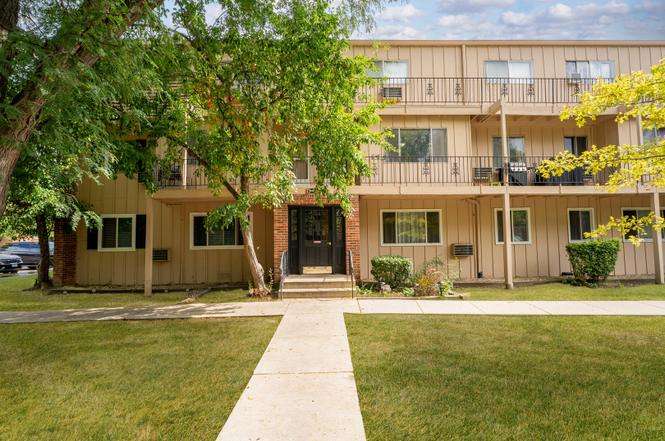
2504 Algonquin Rd #14 · Rolling Meadows, IL
Flood risk 5/10 · Moderate
- FEMA flood zone
- X (unshaded)
- Chance of flooding over 30 yrs
- 0.59%
- Est. flood insurance / yr
- $507 – $1,088
Fire risk 1/10 · Minimal
- Est. fire insurance / yr
- $804 – $1,492
Heat risk 3/10 · Minor
- Hot days now (above 100°F)
- 7 days/yr
- Hot days in 30 yrs
- 14 days/yr
Wind risk 2/10 · Minimal
- Chance of severe wind over 30 yrs
- 0.0%
Air-quality risk 3/10 · Minor
- Unhealthy air days now
- 3 days/yr
- Unhealthy air days in 30 yrs
- 4 days/yr
Risk factors via First Street. Map © Google.
Why this score? — see what drove the C grade
The composite is a weighted blend of 9 inputs, each scored 0–100. Each bar is that input's sub-score; the figure is the points it added to the 100-point composite (weight × sub-score).
- Cash flow +22.3/30.0
- 1% rule +9.2/10.0
- ARV discount +7.5/15.0
- DSCR +7.1/10.0
- Schools +3.9/10.0
- Livability +3.9/5.0
- Condition / age +2.5/5.0
- Rent growth +2.1/5.0
- Appreciation +0.0/10.0
$147,500
🖨 Deal sheet 📄 Offer letter ✓ Due diligence
Listing remarks MLS
**NEW LIVING ROOM FLOOR**NEW DINNING ROOM FLOOR**NEW KITCHEN FLOOR**UPDATED BATH**NEW CARPET**FRESHLY PAINTED**1 1/2 BATH**NEWER REFRIGERATOR**NEW STOVE**READY TO MOVE IN***
Key facts
- $418 HOA
- 2 parking spots
- Built 1970
Property features AI
Finance
- Other: Living area reported as estimated
- Financial info: Special service area: No
- HOA & community: Monthly association fee of $418; Association fee includes heat, water, gas, parking, insurance, exterior maintenance, lawn care, trash (scavenger) and snow removal; Pets allowed (cats and dogs permitted; max pet weight listed as 999)
Exterior
- Parking: Two parking spaces (total)
- Utilities: Water source: Lake Michigan; Public sewer
- Home design: Attached single condo; Entry level: 2
- Construction: Brick construction; Built approximately 51–60 years ago; Built before 1978
- Exterior features: Condo setting; Located in a multi-unit building (18 units)
Interior
- Kitchen: Kitchen on main level (approximately 9 x 9)
- Bedrooms: Two bedrooms (master and second-floor bedroom — second floor); Master bedroom approximately 14 x 13; Second bedroom approximately 13 x 10
- Bathrooms: One full bathroom; One half bathroom
- Heating & cooling: Natural gas heating; Wall cooling units
- Interior features: Five total rooms
- Laundry & utility: Laundry room
Neighborhood map
What this means for you Summary
Snapshot
- This is a 2-bed/1.5-bath condo listed at $148k.
Deal economics
- At list price, monthly cash flow is $243 ($3k/yr) — positive.
- The deal already cash-flows at list — no discount required.
- Meets the 1% rule at list price ($2k rent vs $148k).
- Recommended offer: $130k (12.0% below list) — sets the bar for market timing.
- Cap rate 8.3% vs local median 3.6% in Rolling Meadows — top-decile yield for the area; either an underpriced asset or a hidden risk that comps aren't pricing in. Stress-test before assuming the spread holds.
Location & tenants
- Location reads 77/100 on livability (#162 in IL, #2,994 nationally) — a middle-class / working-renter tenant base. Strengths: employment A+, housing A+, crime A; Watch: health & safety C-, amenities F.
- Township Hsd 214 (suburban): math 42% / reading 45% proficiency, ranked #103 of 620 in IL (top 17%) — families likely to look elsewhere, expect single-tenant / working-renter base with shorter leases.
- Zoned schools: Rolling Meadows High School (math 35% / reading 39%, grade F, #107 of 693 statewide, top 17%, 2,044 students, 0% FRL).
- Market conditions: Rents soft (-1.4%/yr); 39 active listings in the ZIP; 14 comparable units currently listed for rent nearby; rentals leasing fast (median 10d on market — plan ~1-2 weeks tenant-placement turnaround); solid renter incomes; 6,272 units permitted in Cook County in 2024 (4,658 in 5+ unit buildings).
Forward outlook
- Local home prices are declining (-3.0%/yr); year-one equity from $1k of loan paydown is wiped out by about $4k of value loss. Plan a longer hold.
Negotiation context
- It's been on market 245 days — a 12% lower offer ($130k) is reasonable based on typical stale-listing flexibility.
- 8 sale attempts since 11y ago; this cycle's ask has dropped $12k (8%) from the opening price — seller is motivated, your offer sets the floor, not the list.
- Current owner paid $63k; list at $148k implies a 134% gain — meaningful room to come down on a strong offer.
Risks & watch-outs
- Watch-outs: HOA is 20% of rent.
- Climate carrying-cost: moderate flood risk — expect insurance premiums to compound above CPI over the hold.
Questions for the listing agent
- It's been on market 245 days. Have you received any prior offers? Is the seller open to a 12% concession, seller financing, or rate buy-down credit?
- Built in 1970 — when were the roof, HVAC, electrical panel, plumbing, and water heater last replaced?
- What does the HOA fee cover, when was the last increase, and are there any pending special assessments or reserve-fund shortfalls?
- Any open or pending special assessments — roof, HVAC, plumbing, elevator, façade? What's the per-unit balance and payoff schedule, and is the seller paying it off at close or rolling it to the buyer?
- Why hasn't it sold? Are there any deal-killer items the seller is aware of (foundation, flood, title, zoning, code violations)?
- Is there a deadline driving the sale (1031 exchange, divorce, estate, relocation)? That informs how much negotiation room exists.
- What's the average days-on-market for RENTAL listings here right now (not sales)? A rising rental-DOM trend means longer vacancies and softer asking-rent achievability than the comps imply.
- What's the recent tenant-quality profile in this submarket — average credit score on applications, eviction rate, late-payment / NSF rate, and stable-employment percentage? A property-management company in the area should have these aggregated.
- How much new apartment / multifamily construction is in the pipeline within 1–3 miles? Heavy new supply (>2% of stock underway) typically softens rents 12–24 months out; light construction supports rent growth.
Investment metrics
- 1% rule
- 1.42% ✓
- Cap rate
- 8.27%
- Cash-on-cash
- 7.06%
- DSCR
- 1.31
- GRM
- 5.9
CMA / ARV
No comps found within radius.
Projected returns pro-forma
-3.0% appreciation · 0.0% rent growth · sell at horizon
- IRR
- -9.8%
- Equity multiple
- 0.65×
- Total profit
- $-14,266
- Equity at exit
- $21,993
- IRR
- -6.9%
- Equity multiple
- 0.64×
- Total profit
- $-15,033
- Equity at exit
- $12,753
Cash invested: $41,300 (down + closing). Projections, not guarantees.
Landlord ↔ Tenant lean methodology
- Overall (STATE)
- 43 Moderately Tenant-Leaning
- State Illinois
- 43 Moderately Tenant-Leaning · D+7
- County
- — inherits STATE
- City
- — inherits STATE
ZIP-level market 60008
- Rents YoY
- -1.4%
- Active inventory
- 39
- Price-to-rent
- 5.9×
Monthly cashflow live
- Estimated rent
- $2,087 high interval (Pro) →
- Mortgage (P&I)
- −$774
- Tax from tax record
- −$153 /mo · $1,835/yr
- Insurance
- −$61
- HOA
- −$418
- Vacancy / Maint / Mgmt
- −$438
- Net cashflow
- $243
Break-even live
UW: 25.0% down · 7.5% · 30yr · 1.5% tax · 5.0% vac · 8.0% maint · 8.0% mgmt
Financing live
Cash to close
- Down payment
- $36,875
- Closing costs
- $4,425
- Reserves months
- —
- Total cash needed
- —
Loan-product check · same deal, 3 products live
Conventional
25% down · 7.5% · 30yr
- Down + closing
- —
- Monthly P&I
- —
- Monthly cashflow
- —
- DSCR
- —
- Eligible?
- —
Personal DTI + credit; lowest rate.
DSCR
20% down · 8.5% · 30yr
- Down + closing
- —
- Monthly P&I
- —
- Monthly cashflow
- —
- DSCR
- —
- Eligible?
- —
No personal income docs; deal must DSCR.
Hard money
10% down · 12.0% · 12mo
- Down + closing
- —
- Monthly P&I
- —
- Monthly cashflow
- —
- DSCR
- —
- Eligible?
- —
Short-term bridge; refi at stabilization.
Rent comps 14 comps
| Address | Beds | Baths | Sqft | Rent | $/sqft | DOM | Units | Dist |
|---|---|---|---|---|---|---|---|---|
| 4730 Calvert Dr Unit C2 Rolling Meadows, IL | 2.0 | 1.0 | 1200 | $2,195 | $1.83 | 24d | 1 | 0.16mi |
| 5300 Carriageway Dr #107 Rolling Meadows, IL | 2.0 | 1.0 | 1100 | $2,175 | $1.98 | 24d | 1 | 0.17mi |
| 2402 Birch Ln Rolling Meadows, IL | 3.0 | 1.0 | 1160 | $1,649 | $1.42 | 5d | 1 | 0.18mi |
| 2850 Southampton Dr Rolling Meadows, IL | 1.0–3.0 | 1.0–2.0 | 1212 | $2,213 | $1.83 | 1d | 34 | 0.18mi |
| 2205 Fulle St Rolling Meadows, IL | 3.0 | 2.0 | 1340 | $2,400 | $1.79 | 24d | 1 | 0.55mi |
| 4700 Arbor Dr Rolling Meadows, IL | 1.0–3.0 | 1.0–2.0 | 1050 | $1,938 | $1.85 | 1d | 20 | 1.00mi |
| 829 S Dwyer Ave Unit D Arlington Heights, IL | 2.0 | 1.0 | 1000 | $1,800 | $1.80 | 7d | 1 | 1.05mi |
| 3609 Bobwhite Ln Rolling Meadows, IL | 3.0 | 1.0 | 1017 | $2,850 | $2.80 | 10d | 1 | 1.13mi |
| 1243 S Mitchell Ave Arlington Heights, IL | 3.0 | 2.0 | 1486 | $3,300 | $2.22 | 10d | 1 | 1.29mi |
| 1243 S Mitchell Ave Unit HSE Arlington Heights, IL | 3.0 | 2.0 | 1486 | $3,300 | $2.22 | 1d | 1 | 1.30mi |
| 1708 Arbor Sq Schaumburg, IL | 2.0 | 1.0 | 738 | $2,143 | $2.90 | 1d | 49 | 1.30mi |
| 3265 Kirchoff Rd #215 Rolling Meadows, IL | 2.0 | 2.0 | 1000 | $2,000 | $2.00 | 18d | 1 | 1.33mi |
| 1919 Prairie Sq Schaumburg, IL | 2.0 | 2.0 | 960 | $2,075 | $2.16 | 2d | 2 | 1.37mi |
| 1926 Prairie Sq Schaumburg, IL | 1.0 | 1.0 | 775 | $1,560 | $2.01 | 18d | 1 | 1.47mi |
HOA detail condo
- Monthly dues
- $418 · $5,016/yr
- Assessments
- None detected in remarks — confirm with the listing agent.
Listing history 35 events
-
2026-06-18days on market $147,500 Active 245 DOM
-
2026-06-17days on market $147,500 Active 244 DOM
-
2026-06-16days on market $147,500 Active 243 DOM
-
2026-06-15days on market $147,500 Active 242 DOM
-
2026-06-13days on market $147,500 Active 240 DOM
-
2026-06-09days on market $147,500 Active 236 DOM
-
2026-06-08days on market $147,500 Active 235 DOM
-
2026-06-07days on market $147,500 Active 234 DOM
-
2026-06-04days on market $147,500 Active 231 DOM
-
2026-06-03days on market $147,500 Active 230 DOM
-
2026-06-02days on market $147,500 Active 229 DOM
-
2026-06-01days on market $147,500 Active 228 DOM
-
2026-05-31days on market $147,500 Active 227 DOM
-
2026-05-19status Active
-
2026-05-11historical Contingent - No Showings
-
2026-05-06status Active
-
2026-05-05historical
-
2026-05-05status Active
-
2026-04-28historical Contingent - No Showings
-
2026-04-28historical
-
2026-04-20status Active
-
2026-04-02historical Contingent - No Showings
-
2026-04-02status Active
-
2026-03-21historical Contingent - No Showings
-
2026-03-19historical
-
2026-03-07price $147,500
-
2025-12-23status Active
-
2025-12-17historical Contingent - Continue to Show
-
2025-11-21price $154,900
-
2025-09-26$159,900 Active
-
2015-10-26soldstatus $63,000
-
2015-10-23soldstatus $63,000 Closed Sale 173-char remark
Show marketing remark (173 chars)
**NEW LIVING ROOM FLOOR**NEW DINNING ROOM FLOOR**NEW KITCHEN FLOOR**UPDATED BATH**NEW CARPET**FRESHLY PAINTED**1 1/2 BATH**NEWER REFRIGERATOR**NEW STOVE**READY TO MOVE IN***
-
2015-09-04Contingent 173-char remark
Show marketing remark (173 chars)
**NEW LIVING ROOM FLOOR**NEW DINNING ROOM FLOOR**NEW KITCHEN FLOOR**UPDATED BATH**NEW CARPET**FRESHLY PAINTED**1 1/2 BATH**NEWER REFRIGERATOR**NEW STOVE**READY TO MOVE IN***
-
1989-11-09soldstatus $46,000
-
1986-10-01soldstatus $36,000
ⓘ Source: listings_history table (triggers on properties + properties_extension) + one-shot
backfill from property_details.listing_events for pre-trigger history.
Tax reassessment forecast IL · Partial reset (capped growth)
- Current annual tax
- $1,835 · $153/mo
- Projected year-2 tax
- $2,592 · $216/mo
- Expected delta
- +$756/yr (+$63/mo · 41.2%)
ⓘ Screening estimate from a state-policy table — verify with the county assessor before closing.
Climate risk First Street
- Flood 5/10 Major FEMA zone X (unshaded) · 59% chance over 30 yrs
- Wildfire 1/10 Low
- Heat 3/10 Moderate 7 d/yr ≥100°F today · 14 d/yr by 30 yrs out
- Wind 2/10 Low 0% chance of damaging wind over 30 yrs
- Air quality 3/10 Moderate 3 unhealthy d/yr today · 4 by 30 yrs out
Nearby sold comps map
Loading sold comps map…
Walkable amenities ~0.75 mi
Loading nearby amenities…
Taxation est. · year 1
- Rental income
- $25,048
- − Mortgage interest
- −$8,262
- − Property taxes
- −$1,835
- − Insurance
- −$738
- − Repairs & maintenance
- −$2,004
- − Management
- −$2,004
- − HOA
- −$5,016
- − Depreciation
- −$4,291
- Taxable income
- $899
- Est. tax owed @ 24.0%
- −$216
- After-tax cash flow
- $2,702/yr
For passive investors: Depreciation is non-cash, so a rental often shows a tax loss while cash-flowing — sheltering income. Rental losses are passive: they offset passive income freely, and up to $25,000/yr can offset ordinary (W-2) income if you actively participate and your MAGI is under $100k (phasing out to $0 by $150k); unused losses carry forward. On sale, claimed depreciation is recaptured at up to 25%, and gains may owe capital-gains tax (a 1031 exchange can defer both). Figures are a year-1 estimate at your 24.0% rate — not tax advice; consult a CPA.
Schools (NCES district)
- District
- Township Hsd 214
- NCES district ID
- 1704170
- Math proficiency
- 42% ▼ -10.00%
- Reading proficiency
- 45% ▼ -4.00%
- Median HH income
- $68,267
- Composite
- 39.13/100
- National rank
- #4035
- State rank
- #103 of 620 in IL
Livability — Rolling Meadows
- Score
- 77/100
- State rank
- #162
- US rank
- #2994
Category grades
Schools grade is shown separately in the Schools card above.
Census & demographics
- Census place
- Rolling Meadows, IL
- County
- Cook County · 4,486,803 people
- City population
- 22,800
- Metro
- Chicago-Naperville-Elgin, IL-IN-WI
- Population (ZIP)
- 22,800
- Household income
- $94,336
- Rent vs Own
- Severe rent burden
- 736.0
Population outlook (Cook County) Hauer SSP2
- Today (2025)
- 5,347,519 people
- By 2030
- 5,357,703 · +0.2%
- By 2040
- 5,324,924 · -0.4%
- By 2050
- 5,230,762 · -2.2%
- By 2075
- 4,785,735 · -10.5%
- By 2100
- 4,188,836 · -21.7%
Race, ethnicity, and origin ACS 2023
- Neighborhood character
- Diverse neighborhood (Simpson 0.60)
- Race & ethnicity
- White 54% Hispanic / Latino 31% Two or more races 13% Asian 9% Black 4%
- Hispanic origin (detail)
- Mexican 24% Puerto Rican 1%
- Common ancestry
- Romanian 10% Italian 2% Portuguese 2%
- Foreign-born
- 27% · Canada, South Korea, China
- Languages at home
- 56% English-only · Spanish 25% Russian/Polish/Slavic 7% Other Indo-European 4%
Political lean MEDSL · Cook
- 2024 margin
- Solid D (+42.0) · D 70.4% · R 28.4% · Other 1.2%
- 2008→2024 swing
- -11.4pp toward R · 2008: 53.4pp · 2024: 42.0pp
- All cycles
- 2024: D+42.0 2020: D+50.3 2016: D+53.0 2012: D+49.4 2008: D+53.4
Not yet ingested
- Civics
- —
Market trends
- HPI YoY
- ▼ -218.62%
- Current HPI
- 214.0901
- Rent YoY
- ▼ -1.43%
- Metro
- Chicago-Naperville-Elgin, IL-IN-WI
- State GDP YoY
- ▲ 1.59%
- F500 in state
- 60
Industry mix (Fortune 500 HQ in IL)
| Industry | F500 HQs | Revenue |
|---|---|---|
| Insurance | 4 | $201B |
|
||
| Consumer Goods | 4 | $87B |
|
||
| Industrial Machinery | 3 | $64B |
|
||
| Healthcare | 2 | $55B |
|
||
| Retail / Pharmacy | 1 | $148B |
|
||
| Agriculture / Food | 1 | $86B |
|
||
Price history
+309.7% since first listed22 events — show timeline
- 2026-05-19 Relisted — MRED as Distributed by MLS Grid
- 2026-05-11 Contingent — MRED as Distributed by MLS Grid
- 2026-05-06 Relisted — MRED as Distributed by MLS Grid
- 2026-05-05 Listing Removed — MRED as Distributed by MLS Grid
- 2026-05-05 Relisted — MRED as Distributed by MLS Grid
- 2026-04-28 Contingent — MRED as Distributed by MLS Grid
- 2026-04-28 Listing Removed — MRED as Distributed by MLS Grid
- 2026-04-20 Relisted — MRED as Distributed by MLS Grid
- 2026-04-02 Contingent — MRED as Distributed by MLS Grid
- 2026-04-02 Relisted — MRED as Distributed by MLS Grid
- 2026-03-21 Contingent — MRED as Distributed by MLS Grid
- 2026-03-19 Listing Removed — MRED as Distributed by MLS Grid
- 2026-03-07 Price Changed $147,500 MRED as Distributed by MLS Grid
- 2025-12-23 Relisted — MRED as Distributed by MLS Grid
- 2025-12-17 Contingent — MRED as Distributed by MLS Grid
- 2025-11-21 Price Changed $154,900 MRED as Distributed by MLS Grid
- 2025-09-26 Listed $159,900 MRED as Distributed by MLS Grid
- 2015-10-26 Sold (Public Records) $63,000 Public Records
- 2015-10-23 Sold (MLS) $63,000 MRED as Distributed by MLS Grid
- 2015-09-04 Listed — MRED as Distributed by MLS Grid
- 1989-11-09 Sold (Public Records) $46,000 Public Records
- 1986-10-01 Sold (Public Records) $36,000 Public Records
Property tax history
+12.8%/yrLatest (2023): $1,835 · -12.5% YoY. Source: county tax records.
Cash-flow waterfall
monthlySold comps — $/sqft
last 12 mo · ≤1 miLoading sold comps…