 Duplex
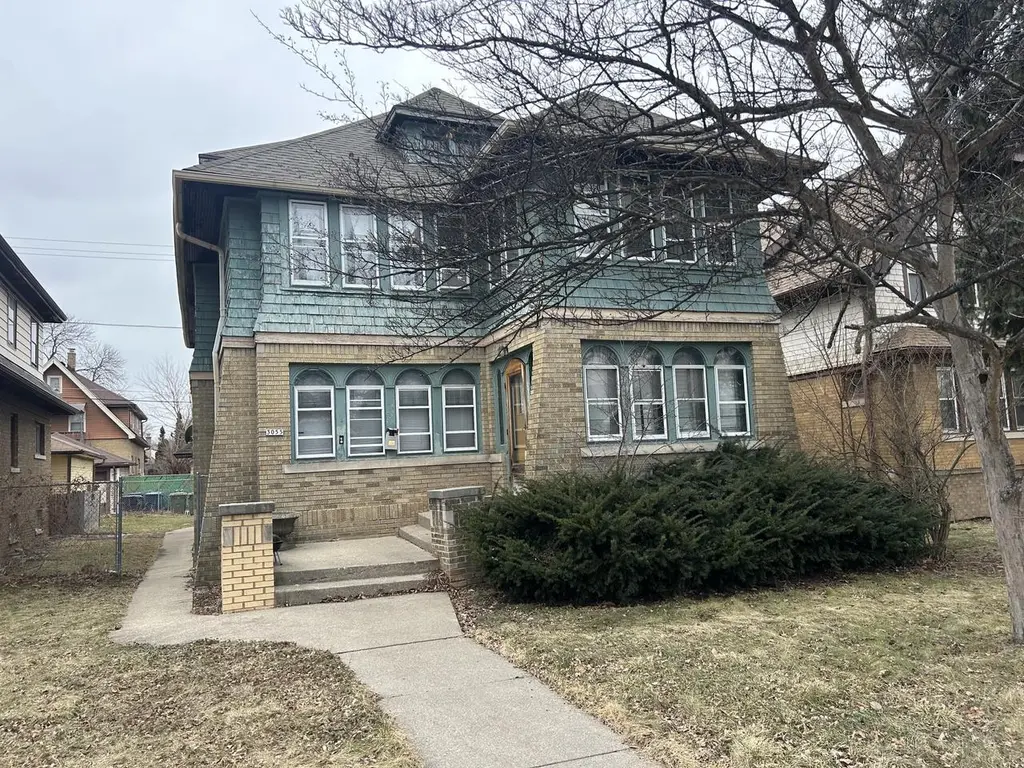
3055 N 54th St Unit 3055A · Milwaukee, WI
Flood risk 1/10 · Minimal
- FEMA flood zone
- X (unshaded)
- Chance of flooding over 30 yrs
- 0.0%
- Est. flood insurance / yr
- $473 – $860
Fire risk 1/10 · Minimal
- Est. fire insurance / yr
- $636 – $1,182
Heat risk 2/10 · Minimal
- Hot days now (above 100°F)
- 7 days/yr
- Hot days in 30 yrs
- 13 days/yr
Wind risk 2/10 · Minimal
- Chance of severe wind over 30 yrs
- —
Air-quality risk 2/10 · Minimal
- Unhealthy air days now
- 2 days/yr
- Unhealthy air days in 30 yrs
- 2 days/yr
Risk factors via First Street. Map © Google.
Why this score? — see what drove the D grade
The composite is a weighted blend of 9 inputs, each scored 0–100. Each bar is that input's sub-score; the figure is the points it added to the 100-point composite (weight × sub-score).
- Cash flow +20.6/30.0
- DSCR +6.5/10.0
- 1% rule +5.4/10.0
- Livability +4.0/5.0
- Condition / age +3.8/5.0
- Rent growth +3.5/5.0
- Schools +1.2/10.0
- ARV discount +0.0/15.0
- Appreciation +0.0/10.0
$225,000
🖨 Deal sheet (PDF) 📄 Offer letter ✓ Due diligence
Multi-family units
County records classify this as Multi-Family (2-4 Unit). Listing-text estimate: 2 units. confirmed
Listing remarks MLS
Beautiful duplex perfectly blending old home charm with modern update. Perfect for any home owner or investor. All the major items have been updated - New roof and boilers. Hardwood floors throughout. Partially finished basement. This is truly one of a kind!
Key facts
- New boilers
- New roof
- Hardwood floors
Tags
Neighborhood map
What this means for you Summary
Snapshot
- This is a 2 × 2-bed/1.0-bath units multifamily listed at $225k. Condition is rated good.
Deal economics
- At list price, monthly cash flow is $300 ($4k/yr) — positive. Per door: $150/mo.
- The deal already cash-flows at list — no discount required.
- Meets the 1% rule at list price ($2k rent vs $225k).
- Recommended offer: $205k (9.0% below list) — sets the bar for market timing.
- Cap rate 7.9% vs local median 5.1% in Milwaukee — top-decile yield for the area; either an underpriced asset or a hidden risk that comps aren't pricing in. Stress-test before assuming the spread holds.
Location & tenants
- Location reads 81/100 on livability (#55 in WI, #1,534 nationally) — a professional / high-income tenant draw. Strengths: amenities A+, commute A+, cost of living A+; Watch: employment D+, schools F, crime F.
- Milwaukee School District (urban): math 10% / reading 18% proficiency, ranked #337 of 342 in WI (top 98%) — low school quality limits family demand, transient renter base, plan for 1-2y turnover; 77% free/reduced lunch — lower-income household profile, screen leases tightly.
- Market conditions: Rents rising (+3.8%/yr); 143 active listings in the ZIP; 3 comparable units currently listed for rent nearby; rentals at typical pace (median 19d on market — plan ~3-4 weeks tenant-placement turnaround); 1,017 units permitted in Milwaukee County in 2024 (803 in 5+ unit buildings).
- At $2,348/mo this rent would consume 58% of the median local household income ($48k/yr) (locally 1730% of renters already pay >50% of income on rent) — very limited rent-growth headroom before tenants either downsize or default.
Forward outlook
- Local home prices are declining (-3.0%/yr); year-one equity from $2k of loan paydown is wiped out by about $7k of value loss. Plan a longer hold.
- Milwaukee County population projected at +4% by 2050 — modest demand growth; plan on rents tracking national, not racing it.
Negotiation context
- It's been on market 101 days — a 9% lower offer ($205k) is reasonable based on typical stale-listing flexibility.
Risks & watch-outs
- Watch-outs: built in 1928 — expect roof / HVAC / electrical / plumbing capex.
Questions for the listing agent
- It's been on market 101 days. Have you received any prior offers? Is the seller open to a 9% concession, seller financing, or rate buy-down credit?
- Can we see the unit-by-unit rent roll, current vacancy, and any below-market leases? What's the average tenancy length?
- What capital expenditures (roof, boiler, parking lot, exteriors) have been made in the last 5 years, and what's planned in the next 2?
- Built in 1928 — when were the roof, HVAC, electrical panel, plumbing, and water heater last replaced?
- Why hasn't it sold? Are there any deal-killer items the seller is aware of (foundation, flood, title, zoning, code violations)?
- Is there a deadline driving the sale (1031 exchange, divorce, estate, relocation)? That informs how much negotiation room exists.
- Schools are F-rated, which usually means shorter tenancies and higher turnover. Who's the typical renter profile here, and what's been the actual vacancy rate?
- Crime grade is F in this area — have there been break-ins, vandalism, or insurance claims at this property in the last 3 years? What carrier currently insures it and at what premium?
- The area grade is low — what's the realistic commute time and amenity access for the typical tenant pool here? Any planned neighborhood developments (good or bad) we should know about?
- What's the average days-on-market for RENTAL listings here right now (not sales)? A rising rental-DOM trend means longer vacancies and softer asking-rent achievability than the comps imply.
- What's the recent tenant-quality profile in this submarket — average credit score on applications, eviction rate, late-payment / NSF rate, and stable-employment percentage? A property-management company in the area should have these aggregated.
- How much new apartment / multifamily construction is in the pipeline within 1–3 miles? Heavy new supply (>2% of stock underway) typically softens rents 12–24 months out; light construction supports rent growth.
Investment metrics
- 1% rule
- 1.04% ✓
- Cap rate
- 7.89%
- Cash-on-cash
- 5.71%
- DSCR
- 1.25
- GRM
- 8.0
CMA / ARV
- ARV (median comp)
- $185,297
- List price
- $225,000
- Delta
- 21.43%
- Verdict
- OVERPRICED
- Comps
- 20 within 1.0 mi
Show comp detail 12 sales within ~0.75 mi
| Address | Dist | Beds/Ba | Sqft | Sold | Price | $/sf | Match |
|---|---|---|---|---|---|---|---|
| 3044 N 54th St #3046 | 0.04mi | 4/2.0 | 2,279 (-1%) | 1mo | $200,000 | $88 | 95 |
| 3128 N 52nd St #3130 | 0.17mi | 4/2.0 | 2,400 (+4%) | 0mo | $283,000 | $118 | 85 |
| 2808 N 52nd St #2810 | 0.35mi | 4/2.0 | 2,292 (-1%) | 1mo | $153,000 | $67 | 81 |
| 2866 N 52nd St #2868 | 0.28mi | 4/2.0 | 2,215 (-4%) | 1mo | $257,000 | $116 | 79 |
| 2977 N 60th St #2979 | 0.35mi | 5/2.0 (+1) | 2,273 (-2%) | 1mo | $179,900 | $79 | 76 |
| 2642 N 51st St #2644 | 0.56mi | 4/2.0 | 2,294 (-1%) | 1mo | $122,500 | $53 | 72 |
| 5601 W Brooklyn Pl | 0.29mi | 3/2.0 (-1) | 2,186 (-5%) | 1mo | $310,000 | $142 | 71 |
| 5601 W Philip Pl #5603 | 0.37mi | 3/2.0 (-1) | 2,224 (-4%) | 0mo | $265,000 | $119 | 71 |
| 2834 N 54th St Unit 2834A | 0.29mi | 4/2.0 | 2,080 (-10%) | 0mo | $175,000 | $84 | 70 |
| 3031 N 60th St | 0.33mi | 4/2.0 | 1,990 (-14%) | 1mo | $215,000 | $108 | 60 |
| 2576 N 51st St #2578 | 0.64mi | 4/2.0 | 2,178 (-6%) | 1mo | $149,900 | $69 | 60 |
| 3024 N 44th St | 0.65mi | 4/2.0 | 1,998 (-14%) | 1mo | $120,775 | $60 | 46 |
Match score weights: distance 35% · size 25% · config 20% · recency 20%. Top-matched comps best support the ARV.
Projected returns pro-forma
-3.0% appreciation · 3.82% rent growth · sell at horizon
- IRR
- -6.5%
- Equity multiple
- 0.76×
- Total profit
- $-15,364
- Equity at exit
- $33,548
- IRR
- 4.1%
- Equity multiple
- 1.31×
- Total profit
- $19,517
- Equity at exit
- $19,454
Cash invested: $63,000 (down + closing). Projections, not guarantees.
Landlord ↔ Tenant lean methodology
- Overall (STATE)
- 73 Landlord-Friendly
- State Wisconsin
- 73 Landlord-Friendly · R+2
- County
- — inherits STATE
- City
- — inherits STATE
ZIP-level market 53210
- Home prices YoY
- -21.5%
- Rents YoY
- 3.8%
- Active inventory
- 143
- Price-to-rent
- 16.0×
Monthly cashflow live
- Estimated rent
- $2,348 high interval (Pro) →
- Mortgage (P&I)
- −$1,180
- Tax est. 1.5%
- −$281 /mo · $3,375/yr
- Insurance
- −$94
- HOA
- −$0
- Vacancy / Maint / Mgmt
- −$493
- Net cashflow
- $300
Break-even live
Sensitivity live
| Price | -10% $455 | -5% $378 | +0% $300 | +5% $222 | +10% $145 |
|---|---|---|---|---|---|
| Rent | -10% $115 | -5% $207 | +0% $300 | +5% $393 | +10% $485 |
| Rate | -1.0pp $413 | -0.5pp $357 | base $300 | +0.5pp $242 | +1.0pp $182 |
2-unit breakdown (identical units grouped — click to expand)
| Units | Beds | Baths | Est. rent |
|---|---|---|---|
| 2× units | 2 | 1 | $2,348 |
| #1 | 2 | 1 | $1,174 |
| #2 | 2 | 1 | $1,174 |
| Total (2 units) | $2,348 | ||
UW: 25.0% down · 7.5% · 30yr · 1.5% tax · 5.0% vac · 8.0% maint · 8.0% mgmt
Financing live
Cash to close
- Down payment
- $56,250
- Closing costs
- $6,750
- Reserves months
- —
- Total cash needed
- —
Loan-product check · same deal, 3 products live
Conventional
25% down · 7.5% · 30yr
- Down + closing
- —
- Monthly P&I
- —
- Monthly cashflow
- —
- DSCR
- —
- Eligible?
- —
Personal DTI + credit; lowest rate.
DSCR
20% down · 8.5% · 30yr
- Down + closing
- —
- Monthly P&I
- —
- Monthly cashflow
- —
- DSCR
- —
- Eligible?
- —
No personal income docs; deal must DSCR.
Hard money
10% down · 12.0% · 12mo
- Down + closing
- —
- Monthly P&I
- —
- Monthly cashflow
- —
- DSCR
- —
- Eligible?
- —
Short-term bridge; refi at stabilization.
Rent comps 3 comps
| Address | Beds | Baths | Sqft | Rent | $/sqft | DOM | Units | Dist |
|---|---|---|---|---|---|---|---|---|
| 2976 N 49th St Milwaukee, WI | 3.0 | 1.0 | 1700 | $1,300 | $0.76 | 19d | 1 | 0.35mi |
| 2137 N 47th St Milwaukee, WI | 5.0 | 2.0 | 1723 | $1,850 | $1.07 | 16d | 1 | 1.25mi |
| 4079 N 63rd St Milwaukee, WI | 3.0 | 1.0 | 1600 | $1,595 | $1.00 | 21d | 1 | 1.26mi |
Listing history 16 events
-
2026-06-21days on market $225,000 Active 101 DOM
-
2026-06-18days on market $225,000 Active 98 DOM
-
2026-06-17days on market $225,000 Active 97 DOM
-
2026-06-16days on market $225,000 Active 96 DOM
-
2026-06-15days on market $225,000 Active 95 DOM
-
2026-06-13days on market $225,000 Active 93 DOM
-
2026-06-13days on market $225,000 Active 92 DOM
-
2026-06-09days on market $225,000 Active 89 DOM
-
2026-06-08days on market $225,000 Active 88 DOM
-
2026-06-07days on market $225,000 Active 87 DOM
-
2026-06-05days on market $225,000 Active 84 DOM
-
2026-06-03days on market $225,000 Active 83 DOM
-
2026-06-02days on market $225,000 Active 82 DOM
-
2026-06-01days on market $225,000 Active 81 DOM
-
2026-05-31days on market $225,000 Active 80 DOM
-
2026-03-12$225,000 Active 258-char remark
Show marketing remark (258 chars)
Beautiful duplex perfectly blending old home charm with modern update. Perfect for any home owner or investor. All the major items have been updated - New roof and boilers. Hardwood floors throughout. Partially finished basement. This is truly one of a kind!
ⓘ Source: listings_history table (triggers on properties + properties_extension) + one-shot
backfill from property_details.listing_events for pre-trigger history.
Climate risk First Street
- Flood 1/10 Low FEMA zone X (unshaded) · 0% chance over 30 yrs
- Wildfire 1/10 Low
- Heat 2/10 Low 7 d/yr ≥100°F today · 13 d/yr by 30 yrs out
- Wind 2/10 Low
- Air quality 2/10 Low 2 unhealthy d/yr today · 2 by 30 yrs out
Nearby sold comps map
Loading sold comps map…
Walkable amenities ~0.75 mi
Loading nearby amenities…
Taxation est. · year 1
- Rental income
- $28,176
- − Mortgage interest
- −$12,603
- − Property taxes
- −$3,375
- − Insurance
- −$1,125
- − Repairs & maintenance
- −$2,254
- − Management
- −$2,254
- − Depreciation
- −$6,545
- Taxable income
- $19
- Est. tax owed @ 24.0%
- −$5
- After-tax cash flow
- $3,595/yr
For passive investors: Depreciation is non-cash, so a rental often shows a tax loss while cash-flowing — sheltering income. Rental losses are passive: they offset passive income freely, and up to $25,000/yr can offset ordinary (W-2) income if you actively participate and your MAGI is under $100k (phasing out to $0 by $150k); unused losses carry forward. On sale, claimed depreciation is recaptured at up to 25%, and gains may owe capital-gains tax (a 1031 exchange can defer both). Figures are a year-1 estimate at your 24.0% rate — not tax advice; consult a CPA.
Condition & rehab AI · 9 photos
This well-maintained duplex offers a blend of charm and modern updates, making it an attractive investment opportunity.
Value-add opportunities
- Both Paint exterior trim — Enhances curb appeal and value
- Both Replace ceiling fan — Improves air circulation and aesthetics
- Both Update kitchen appliances — Modernizes the space and attracts buyers
- Both Install new bathroom fixtures — Enhances functionality and appeal
Renovation cost estimate screening
Value-add ROI direction
- Both Paint exterior trim — Enhances curb appeal and value ↑
- Both Replace ceiling fan — Improves air circulation and aesthetics ↑
- Both Update kitchen appliances — Modernizes the space and attracts buyers ↑
- Both Install new bathroom fixtures — Enhances functionality and appeal ↑
ⓘ Cost ranges are severity-bucket heuristics (US national rule-of-thumb). Get contractor quotes + a written scope before underwriting a rehab budget.
Schools (NCES district)
- District
- Milwaukee School District
- NCES district ID
- 5509600
- Math proficiency
- 10% ▼ -5.00%
- Reading proficiency
- 18% ▬ 0.00%
- Median HH income
- $36,339
- Composite
- 11.61/100
- National rank
- #9696
- State rank
- #337 of 342 in WI
Livability — Milwaukee
- Score
- 81/100
- State rank
- #55
- US rank
- #1534
Category grades
Schools grade is shown separately in the Schools card above.
Census & demographics
- Census place
- Milwaukee, WI
- County
- Milwaukee County · 926,379 people
- City population
- 573,768
- Metro
- Milwaukee-Waukesha, WI
- Population (ZIP)
- 23,922
- Household income
- $48,217
- Rent vs Own
- Severe rent burden
- 1730.0
Population outlook (Milwaukee County) Hauer SSP2
- Today (2025)
- 995,758 people
- By 2030
- 1,009,124 · +1.3%
- By 2040
- 1,028,128 · +3.3%
- By 2050
- 1,040,066 · +4.4%
- By 2075
- 1,057,849 · +6.2%
- By 2100
- 1,039,774 · +4.4%
Race, ethnicity, and origin ACS 2023
- Neighborhood character
- Predominantly Black (71%)
- Race & ethnicity
- Black 71% White 17% Hispanic / Latino 6% Two or more races 6% Asian 2%
- Hispanic origin (detail)
- Mexican 3% Puerto Rican 1%
- Common ancestry
- Romanian 2% Portuguese 1% Italian 1%
- Foreign-born
- 3% · Canada, Philippines
- Languages at home
- 94% English-only · Spanish 3% Other Asian/Pacific 2%
Political lean MEDSL · Milwaukee
- 2024 margin
- Solid D (+38.5) · D 68.3% · R 29.8% · Other 1.8%
- 2008→2024 swing
- +2.7pp toward D · 2008: 35.9pp · 2024: 38.5pp
- All cycles
- 2024: D+38.5 2020: D+39.9 2016: D+37.5 2012: D+34.6 2008: D+35.9
Not yet ingested
- Civics
- —
Market trends
- HPI YoY
- ▼ -76.77%
- Current HPI
- 280.0133
- Rent YoY
- ▲ 3.82%
- Metro
- Milwaukee-Waukesha, WI
- State GDP YoY
- ▲ 2.10%
- F500 in state
- 20
Industry mix (Fortune 500 HQ in WI)
| Industry | F500 HQs | Revenue |
|---|---|---|
| Industrial Machinery | 4 | $23B |
|
||
| Industrial Technology | 2 | $36B |
|
||
| Insurance | 1 | $36B |
|
||
| Professional Services | 1 | $19B |
|
||
| Utilities | 1 | $9B |
|
||
| Consumer Goods | 1 | $3B |
|
||
Price history
1 event — show timeline
- 2026-03-12 Listed $225,000 METROMLS
Cash-flow waterfall
monthlySold comps — $/sqft
last 12 mo · ≤1 miLoading sold comps…