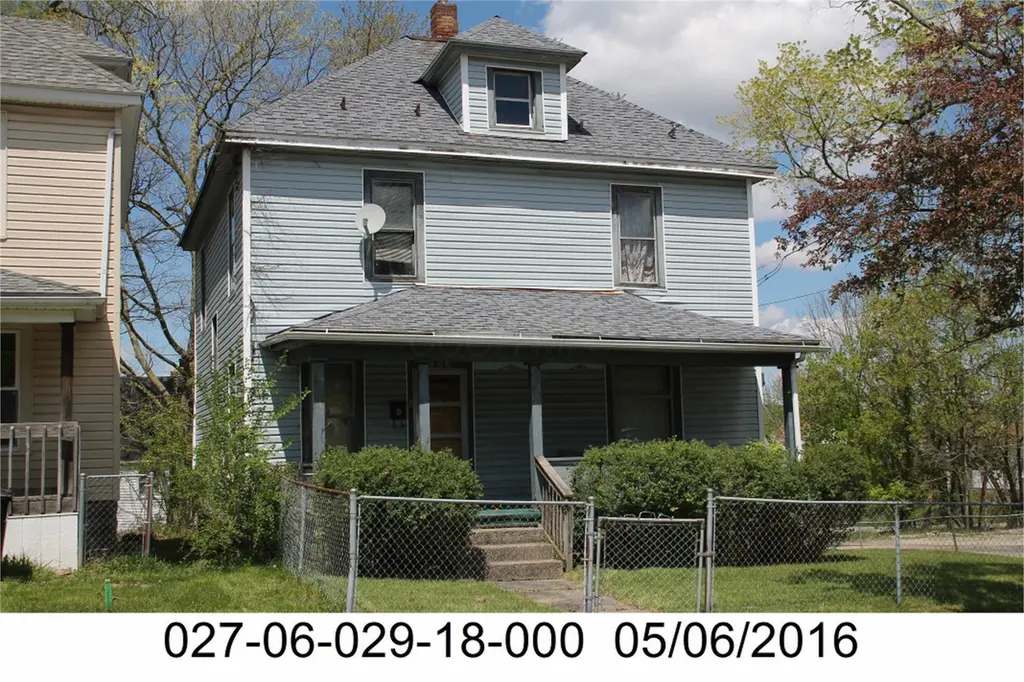
163 E 1st St · Mansfield, OH
Flood risk 1/10 · Minimal
- FEMA flood zone
- X (unshaded)
- Chance of flooding over 30 yrs
- 0.0%
- Est. flood insurance / yr
- $473 – $860
Fire risk 1/10 · Minimal
- Est. fire insurance / yr
- $713 – $1,323
Heat risk 3/10 · Minor
- Hot days now (above 96°F)
- 7 days/yr
- Hot days in 30 yrs
- 17 days/yr
Wind risk 2/10 · Minimal
- Chance of severe wind over 30 yrs
- —
Air-quality risk 2/10 · Minimal
- Unhealthy air days now
- 1 days/yr
- Unhealthy air days in 30 yrs
- 1 days/yr
Risk factors via First Street. Map © Google.
Why this score? — see what drove the A grade
The composite is a weighted blend of 9 inputs, each scored 0–100. Each bar is that input's sub-score; the figure is the points it added to the 100-point composite (weight × sub-score).
- Cash flow +30.0/30.0
- ARV discount +15.0/15.0
- 1% rule +10.0/10.0
- DSCR +10.0/10.0
- Appreciation +9.2/10.0
- Livability +3.8/5.0
- Rent growth +2.5/5.0
- Condition / age +2.5/5.0
- Schools +2.3/10.0
$43,000
🖨 Deal sheet 📄 Offer letter ✓ Due diligence
Listing remarks
Single family home fenced in on a corner lot offers 3 bedrooms, 1 bathroom, attached garage. This home offers a lot of potential for investors or handy man.
Key facts
- 4,356 sq ft lot
- Garage
- Built 1915
Property features AI
Exterior
- Parking: Attached garage (side load); On-street parking; 1 garage space
- Utilities: Public water; Public sewer
- Home design: Single-family residence; Two levels; Built in 1915; No shared/common walls
- Construction: Block and stone foundation
- Exterior features: Fenced lot
Interior
- Bathrooms: 1 full bathroom
- Interior features: Full basement; Living area approximately 1,582
Neighborhood map
What this means for you Summary
Snapshot
- This is a 3-bed/1.0-bath single-family listed at $43k.
Deal economics
- At list price, monthly cash flow is $465 ($6k/yr) — positive.
- The deal already cash-flows at list — no discount required.
- Meets the 1% rule at list price ($1k rent vs $43k).
- Recommended offer: $42k (3.0% below list) — sets the bar for market timing.
- Cap rate 19.3% vs local median 4.2% in Mansfield — top-decile yield for the area; either an underpriced asset or a hidden risk that comps aren't pricing in. Stress-test before assuming the spread holds.
Location & tenants
- Location reads 76/100 on livability (#224 in OH, #3,525 nationally) — a middle-class / working-renter tenant base. Strengths: commute A+, cost of living A+, housing A+; Watch: schools C-, crime D-, amenities D-.
- Mansfield City (urban): math 24% / reading 33% proficiency, ranked #590 of 656 in OH (top 90%) — low school quality limits family demand, transient renter base, plan for 1-2y turnover; 80% free/reduced lunch — lower-income household profile, screen leases tightly.
- Market conditions: 30 active listings in the ZIP; 4 comparable units currently listed for rent nearby; rentals lingering (median 44d on market — plan ~5-8 weeks vacancy on turnover, expect pricing pressure); 100% of comp listings sitting > 30 days — soft ceiling on asking rent; lower-income renter base — watch delinquency; 145 units permitted in Richland County in 2024 (0 in 5+ unit buildings).
- This rent runs 39% of the median local income ($32k/yr) — at the standard rent-burdened threshold; future hikes will face affordability resistance.
Forward outlook
- In year one you build about $4k of equity ($297 loan paydown + $4k appreciation (8.4% local appreciation)).
- Richland County population projected at -18% by 2050 — secular population decline; favor cash flow + early exit over multi-decade hold.
- At projected returns (8.4% appreciation + 3.0% rent growth), your $12k cash investment doubles in ~2 years — after that, you're playing with house money.
- By year 8, paydown + projected appreciation supports a ~$33k cash-out refi (75% LTV) — recoverable capital for the next deal without selling this one.
Negotiation context
- It's been on market 57 days — a 3% lower offer ($42k) is reasonable based on typical stale-listing flexibility.
Risks & watch-outs
- Watch-outs: property tax is 2.8% of price; built in 1915 — expect roof / HVAC / electrical / plumbing capex.
Questions for the listing agent
- It's been on market 57 days. Have you received any prior offers? Is the seller open to a 3% concession, seller financing, or rate buy-down credit?
- Built in 1915 — when were the roof, HVAC, electrical panel, plumbing, and water heater last replaced?
- Property tax is high relative to price — has the assessment been appealed recently, and will the sale trigger a re-assessment?
- Is there a deadline driving the sale (1031 exchange, divorce, estate, relocation)? That informs how much negotiation room exists.
- Crime grade is D in this area — have there been break-ins, vandalism, or insurance claims at this property in the last 3 years? What carrier currently insures it and at what premium?
- What's the average days-on-market for RENTAL listings here right now (not sales)? A rising rental-DOM trend means longer vacancies and softer asking-rent achievability than the comps imply.
- What's the recent tenant-quality profile in this submarket — average credit score on applications, eviction rate, late-payment / NSF rate, and stable-employment percentage? A property-management company in the area should have these aggregated.
- How much new for-sale + rental construction is in the pipeline within 1–3 miles? Heavy new supply typically softens prices + rents 12–24 months out; constrained supply supports both.
Investment metrics
- 1% rule
- 2.38% ✓
- Cap rate
- 19.26%
- Cash-on-cash
- 46.32%
- DSCR
- 3.06
- GRM
- 3.5
CMA / ARV
- ARV (median comp)
- $65,554
- List price
- $43,000
- Delta
- -34.41%
- Verdict
- UNDERPRICED
- Comps
- 20 within 1.0 mi
Show comp detail 12 sales within ~0.75 mi
| Address | Dist | Beds/Ba | Sqft | Sold | Price | $/sf | Match |
|---|---|---|---|---|---|---|---|
| 128 Hedges St | 0.09mi | 3/1.5 | 1,672 (+6%) | 1mo | $24,900 | $15 | 83 |
| 268 Superior St | 0.22mi | 3/1.0 | 1,498 (-5%) | 1mo | $38,000 | $25 | 80 |
| 223 Hedges St | 0.27mi | 3/2.0 | 1,687 (+7%) | 1mo | $14,000 | $8 | 71 |
| 195 Hedges St | 0.23mi | 4/1.5 (+1) | 1,483 (-6%) | 1mo | $141,500 | $95 | 71 |
| 223 E 2nd St | 0.15mi | 4/1.5 (+1) | 1,483 (-6%) | 9mo | $134,000 | $90 | 68 |
| 153 Hedges St | 0.14mi | 4/1.5 (+1) | 1,483 (-6%) | 12mo | $134,990 | $91 | 66 |
| 203 Home Ave | 0.29mi | 3/2.0 | 1,748 (+10%) | 2mo | $38,000 | $22 | 63 |
| 11 Blanche St | 0.58mi | 3/1.0 | 1,560 (-1%) | 13mo | $42,000 | $27 | 60 |
| 175 S Mulberry St | 0.45mi | 3/1.5 | 1,405 (-11%) | 3mo | $100,000 | $71 | 56 |
| 11 Hoffer Ave | 0.72mi | 3/1.5 | 1,528 (-3%) | 9mo | $92,700 | $61 | 51 |
| 274 S Main St | 0.49mi | 4/2.0 (+1) | 1,656 (+5%) | 12mo | $75,000 | $45 | 50 |
| 22 Small Ave | 0.42mi | 4/2.0 (+1) | 1,394 (-12%) | 3mo | $137,600 | $99 | 50 |
Match score weights: distance 35% · size 25% · config 20% · recency 20%. Top-matched comps best support the ARV.
Projected returns pro-forma
8.45% appreciation · 3.0% rent growth · sell at horizon
- IRR
- 58.6%
- Equity multiple
- 5.04×
- Total profit
- $48,605
- Equity at exit
- $33,998
- IRR
- 53.4%
- Equity multiple
- 10.90×
- Total profit
- $119,205
- Equity at exit
- $68,796
Cash invested: $12,040 (down + closing). Projections, not guarantees.
Landlord ↔ Tenant lean methodology
- Overall (STATE)
- 73 Landlord-Friendly
- State Ohio
- 73 Landlord-Friendly · R+6
- County
- — inherits STATE
- City
- — inherits STATE
ZIP-level market 44902
- Home prices YoY
- 2.9%
- Active inventory
- 30
- Price-to-rent
- 3.5×
Monthly cashflow live
- Estimated rent
- $1,022 medium interval (Pro) →
- Mortgage (P&I)
- −$225
- Tax from tax record
- −$99 /mo · $1,186/yr
- Insurance
- −$18
- HOA
- −$0
- Vacancy / Maint / Mgmt
- −$215
- Net cashflow
- $465
Break-even live
UW: 25.0% down · 7.5% · 30yr · 1.5% tax · 5.0% vac · 8.0% maint · 8.0% mgmt
Financing live
Cash to close
- Down payment
- $10,750
- Closing costs
- $1,290
- Reserves months
- —
- Total cash needed
- —
Loan-product check · same deal, 3 products live
Conventional
25% down · 7.5% · 30yr
- Down + closing
- —
- Monthly P&I
- —
- Monthly cashflow
- —
- DSCR
- —
- Eligible?
- —
Personal DTI + credit; lowest rate.
DSCR
20% down · 8.5% · 30yr
- Down + closing
- —
- Monthly P&I
- —
- Monthly cashflow
- —
- DSCR
- —
- Eligible?
- —
No personal income docs; deal must DSCR.
Hard money
10% down · 12.0% · 12mo
- Down + closing
- —
- Monthly P&I
- —
- Monthly cashflow
- —
- DSCR
- —
- Eligible?
- —
Short-term bridge; refi at stabilization.
Rent comps 4 comps
| Address | Beds | Baths | Sqft | Rent | $/sqft | DOM | Units | Dist |
|---|---|---|---|---|---|---|---|---|
| 147 Ford St Mansfield, OH | 3.0 | 1.5 | 1286 | $995 | $0.77 | 44d | 1 | 0.52mi |
| 243 W 1st St Mansfield, OH | 4.0 | 1.0 | 1470 | $1,195 | $0.81 | 44d | 1 | 0.77mi |
| 275 Cliffbrook Dr Mansfield, OH | 2.0 | 1.5 | 1200 | $925 | $0.77 | 44d | 1 | 1.26mi |
| 520 Lida St Mansfield, OH | 3.0 | 1.0 | 1300 | $850 | $0.65 | 44d | 1 | 1.29mi |
Listing history 17 events
-
2026-06-19days on market $43,000 Active 57 DOM
-
2026-06-18days on market $43,000 Active 56 DOM
-
2026-06-17days on market $43,000 Active 55 DOM
-
2026-06-16days on market $43,000 Active 54 DOM
-
2026-06-15days on market $43,000 Active 53 DOM
-
2026-06-14days on market $43,000 Active 51 DOM
-
2026-06-12days on market $43,000 Active 50 DOM
-
2026-06-09days on market $43,000 Active 47 DOM
-
2026-06-08days on market $43,000 Active 46 DOM
-
2026-06-07days on market $43,000 Active 45 DOM
-
2026-06-05days on market $43,000 Active 42 DOM
-
2026-06-03days on market $43,000 Active 41 DOM
-
2026-06-02days on market $43,000 Active 40 DOM
-
2026-06-01days on market $43,000 Active 39 DOM
-
2026-05-31days on market $43,000 Active 38 DOM
-
2026-05-30days on market $43,000 Active 37 DOM
-
2026-04-23$43,000 Active 156-char remark
ⓘ Source: listings_history table (triggers on properties + properties_extension) + one-shot
backfill from property_details.listing_events for pre-trigger history.
Tax reassessment forecast OH · Partial reset (capped growth)
- Current annual tax
- $1,186 · $99/mo
- Projected year-2 tax
- $1,186 · $99/mo
- Expected delta
- $0/yr ($0/mo · 0.0%)
ⓘ Screening estimate from a state-policy table — verify with the county assessor before closing.
Climate risk First Street
- Flood 1/10 Low FEMA zone X (unshaded) · 0% chance over 30 yrs
- Wildfire 1/10 Low
- Heat 3/10 Moderate 7 d/yr ≥96°F today · 17 d/yr by 30 yrs out
- Wind 2/10 Low
- Air quality 2/10 Low 1 unhealthy d/yr today · 1 by 30 yrs out
Nearby sold comps map
Loading sold comps map…
Walkable amenities ~0.75 mi
Loading nearby amenities…
Taxation est. · year 1
- Rental income
- $12,258
- − Mortgage interest
- −$2,409
- − Property taxes
- −$1,186
- − Insurance
- −$215
- − Repairs & maintenance
- −$981
- − Management
- −$981
- − Depreciation
- −$1,251
- Taxable income
- $5,236
- Est. tax owed @ 24.0%
- −$1,257
- After-tax cash flow
- $4,320/yr
For passive investors: Depreciation is non-cash, so a rental often shows a tax loss while cash-flowing — sheltering income. Rental losses are passive: they offset passive income freely, and up to $25,000/yr can offset ordinary (W-2) income if you actively participate and your MAGI is under $100k (phasing out to $0 by $150k); unused losses carry forward. On sale, claimed depreciation is recaptured at up to 25%, and gains may owe capital-gains tax (a 1031 exchange can defer both). Figures are a year-1 estimate at your 24.0% rate — not tax advice; consult a CPA.
Schools (NCES district)
- District
- Mansfield City
- NCES district ID
- 3904429
- Math proficiency
- 24% ▼ -19.00%
- Reading proficiency
- 33% ▼ -12.00%
- Median HH income
- $32,435
- Composite
- 23.25/100
- National rank
- #7934
- State rank
- #590 of 656 in OH
Livability — Mansfield
- Score
- 76/100
- State rank
- #224
- US rank
- #3525
Category grades
Schools grade is shown separately in the Schools card above.
Census & demographics
- Census place
- Mansfield, OH
- County
- Richland · 128,966 people
- City population
- 16,349
- Metro
- Mansfield, OH
- Population (ZIP)
- 4,876
- Household income
- $31,619
- Rent vs Own
- Severe rent burden
- 13.2
Population outlook (Richland County) Hauer SSP2
- Today (2025)
- 115,577 people
- By 2030
- 111,669 · -3.4%
- By 2040
- 103,323 · -10.6%
- By 2050
- 95,135 · -17.7%
- By 2075
- 76,719 · -33.6%
- By 2100
- 57,188 · -50.5%
Race, ethnicity, and origin ACS 2023
- Neighborhood character
- Diverse neighborhood (Simpson 0.61)
- Race & ethnicity
- White 52% Black 35% Two or more races 10% Hispanic / Latino 5%
- Common ancestry
- Italian 2% Serbian 2% Iranian 1%
- Foreign-born
- 1% · Canada
- Languages at home
- 95% English-only · Spanish 4% Other Indo-European 1%
Political lean MEDSL · Richland
- 2024 margin
- Solid R (+42.3) · D 28.4% · R 70.8%
- 2008→2024 swing
- -28.8pp toward R · 2008: -13.6pp · 2024: -42.3pp
- All cycles
- 2024: R+42.3 2020: R+39.7 2016: R+37.5 2012: R+20.1 2008: R+13.6
Not yet ingested
- Civics
- —
Market trends
- HPI YoY
- ▲ 8.45%
- Current HPI
- 302.035
- Rent YoY
- —
- Metro
- —
- State GDP YoY
- ▲ 1.98%
- F500 in state
- 48
Industry mix (Fortune 500 HQ in OH)
| Industry | F500 HQs | Revenue |
|---|---|---|
| Insurance | 3 | $145B |
|
||
| Industrial Machinery | 3 | $49B |
|
||
| Financial Services | 3 | $24B |
|
||
| Consumer Goods | 2 | $93B |
|
||
| Aerospace / Defense | 2 | $47B |
|
||
| Utilities | 2 | $33B |
|
||
Price history
1 event — show timeline
- 2026-04-23 Listed $43,000 CBRMLS
Property tax history
+3.3%/yrLatest (2025): $1,186 · +0.0% YoY. Source: county tax records.
Cash-flow waterfall
monthlySold comps — $/sqft
last 12 mo · ≤1 miLoading sold comps…