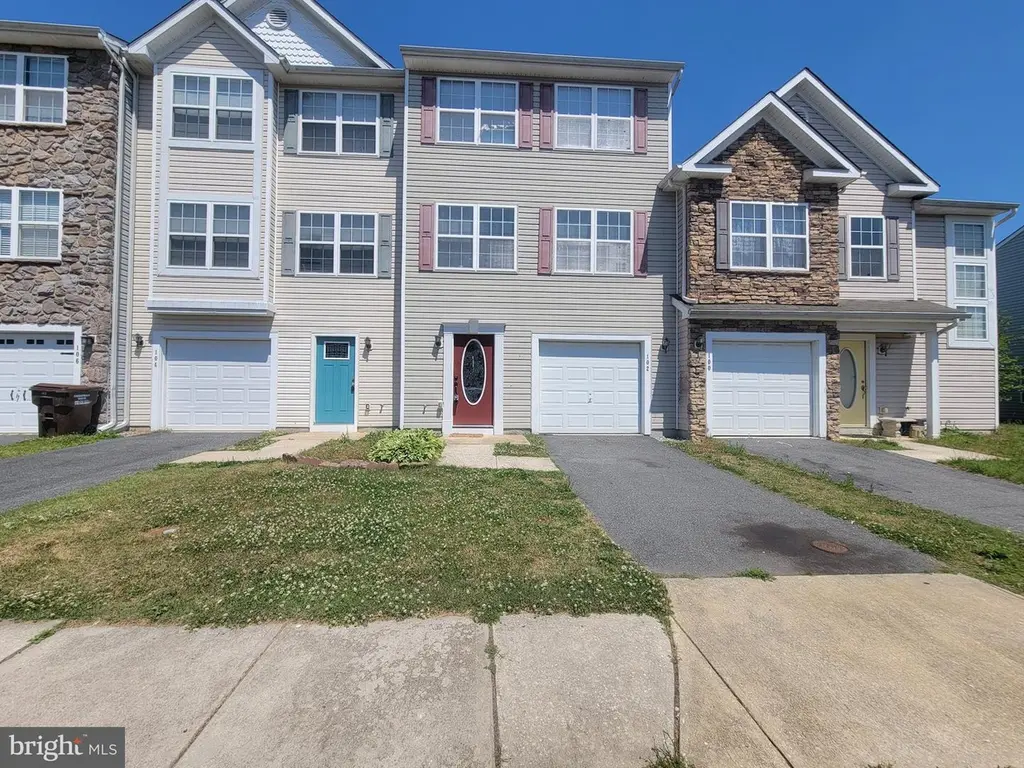
102 Oyster Catcher Ct · Cambridge, MD
Flood risk 1/10 · Minimal
- FEMA flood zone
- X (unshaded)
- Chance of flooding over 30 yrs
- 0.0%
- Est. flood insurance / yr
- $507 – $1,088
Fire risk 3/10 · Minor
- Est. fire insurance / yr
- $755 – $1,403
Heat risk 9/10 · Severe
- Hot days now (above 105°F)
- 7 days/yr
- Hot days in 30 yrs
- 16 days/yr
Wind risk 6/10 · Moderate
- Chance of severe wind over 30 yrs
- 75.0%
Air-quality risk 3/10 · Minor
- Unhealthy air days now
- 2 days/yr
- Unhealthy air days in 30 yrs
- 3 days/yr
Risk factors via First Street. Map © Google.
Why this score? — see what drove the D- grade
The composite is a weighted blend of 9 inputs, each scored 0–100. Each bar is that input's sub-score; the figure is the points it added to the 100-point composite (weight × sub-score).
- Cash flow +14.3/30.0
- ARV discount +6.4/15.0
- DSCR +4.4/10.0
- 1% rule +4.1/10.0
- Livability +3.2/5.0
- Rent growth +2.5/5.0
- Condition / age +2.5/5.0
- Schools +1.5/10.0
- Appreciation +0.0/10.0
$219,950
🖨 Deal sheet 📄 Offer letter ✓ Due diligence
Listing remarks
Spacious and well-maintained townhouse offering nearly 1,900 square feet of comfortable living space with an open, airy floor plan perfect for everyday living and entertaining. The bright kitchen opens to a private deck, ideal for morning coffee or evening relaxation. Entry-level features a welcoming family room, a convenient laundry area, and a half bath. Upstairs, enjoy a large combined living and dining area with neutral décor ready for your personal touch. The attractive primary suite offers generous space and ample closet storage. With abundant storage throughout and a convenient location just minutes from downtown Cambridge, shopping, dining, marinas, and all the Eastern Shore
Key facts
- Private deck
- Half bath
- Ample closet storage
Tags
Property features AI
Finance
- Other: Building name: CATTAIL; Above-grade finished area reported by assessor; No basement
- HOA & community: HOA fee of $120 paid quarterly; Pets allowed with no pet restrictions
Exterior
- Parking: Attached garage (front entry) with 1 garage space; Driveway; Parking lot
- Utilities: Public water; Public sewer; 200+ amp electric service; Natural gas available; Electric available; Cable TV available; Phone service available; Broadband and cable internet
- Home design: Interior townhouse/rowhouse; Fee simple ownership; Very good condition; Estimated year built
- Construction: Vinyl siding; Architectural shingle roof; Slab foundation; Building not winterized
- Exterior features: Deck(s); Sidewalks; Street lights; Not in a tidal flood zone; Property manager present
Interior
- Kitchen: Dishwasher; Electric oven/range; Refrigerator; Exhaust fan
- Bedrooms: Three bedrooms on the upper level
- Flooring: Carpet; Vinyl
- Bathrooms: Two full bathrooms; One half bathroom on the main level
- Heating & cooling: Forced air heating (natural gas); Central air conditioning; Electric hot water
- Interior features: Dry wall walls and ceilings; Living room, family room, foyer
- Laundry & utility: Washer and dryer included; Has laundry area
Neighborhood map
What this means for you Summary
Snapshot
- This is a 3-bed/2.5-bath townhouse listed at $220k.
Deal economics
- At list price, monthly cash flow is $42 ($502/yr) — positive.
- The deal already cash-flows at list — no discount required.
- To meet the 1% rule (rent ≥ 1% of price), the offer needs to be $201k (8.7% below list).
- Recommended offer: $201k (8.7% below list) — sets the bar for 1% rule.
- Cap rate 6.5% vs local median 4.2% in Cambridge — top-decile yield for the area; either an underpriced asset or a hidden risk that comps aren't pricing in. Stress-test before assuming the spread holds.
Location & tenants
- Location reads 65/100 on livability (#255 in MD) — a middle-class / working-renter tenant base. Strengths: cost of living A+, health & safety A+, housing B+; Watch: amenities D, crime F, employment F.
- Dorchester County Public Schools (rural): math 10% / reading 23% proficiency, ranked #23 of 24 in MD (top 96%) — low school quality limits family demand, transient renter base, plan for 1-2y turnover.
- Zoned schools: Sandy Hill Elementary (math 2% / reading 8%, grade F, #766 of 860 statewide, top 93%, 374 students, 100% FRL); Mace'S Lane Middle School (math 2% / reading 16%, grade F, #212 of 225 statewide, top 95%, 481 students, 100% FRL); Cambridge-South Dorchester High School (math 22% / reading 42%, grade F, #151 of 222 statewide, top 68%, 784 students, 100% FRL) — zoned schools average 100% FRL vs 58% district-wide (42 pts higher); higher-poverty schools than district average — tighter screening recommended.
- Market conditions: 292 active listings in the ZIP; 4 comparable units currently listed for rent nearby; rentals lingering (median 44d on market — plan ~5-8 weeks vacancy on turnover, expect pricing pressure); 100% of comp listings sitting > 30 days — soft ceiling on asking rent; 81 units permitted in Dorchester County in 2024 (0 in 5+ unit buildings).
Forward outlook
- Local home prices are declining (-3.0%/yr); year-one equity from $2k of loan paydown is wiped out by about $7k of value loss. Plan a longer hold.
- Dorchester County population projected to shrink 10% by 2050 — rents likely to lag national; underwrite the cash flow, not the appreciation.
Negotiation context
- It's been on market 30 days — a 2% lower offer ($217k) is reasonable based on typical stale-listing flexibility.
- 2 sale attempts with the ask held roughly flat each time — persistent listings suggest the price (not the market) is what's stuck; bring a comps-based counter.
- Current owner paid $47k; list at $220k implies a 368% gain — meaningful room to come down on a strong offer.
Risks & watch-outs
- Climate carrying-cost: major wind risk, 75% chance of damaging wind over 30y; extreme-heat days projected 7→16/yr by 2055 (HVAC capex compounding) — expect insurance premiums to compound above CPI over the hold.
Questions for the listing agent
- What does the HOA fee cover, when was the last increase, and are there any pending special assessments or reserve-fund shortfalls?
- Is there a deadline driving the sale (1031 exchange, divorce, estate, relocation)? That informs how much negotiation room exists.
- Schools are F-rated, which usually means shorter tenancies and higher turnover. Who's the typical renter profile here, and what's been the actual vacancy rate?
- Crime grade is F in this area — have there been break-ins, vandalism, or insurance claims at this property in the last 3 years? What carrier currently insures it and at what premium?
- The area grade is low — what's the realistic commute time and amenity access for the typical tenant pool here? Any planned neighborhood developments (good or bad) we should know about?
- What's the average days-on-market for RENTAL listings here right now (not sales)? A rising rental-DOM trend means longer vacancies and softer asking-rent achievability than the comps imply.
- What's the recent tenant-quality profile in this submarket — average credit score on applications, eviction rate, late-payment / NSF rate, and stable-employment percentage? A property-management company in the area should have these aggregated.
- How much new for-sale + rental construction is in the pipeline within 1–3 miles? Heavy new supply typically softens prices + rents 12–24 months out; constrained supply supports both.
Investment metrics
- 1% rule
- 0.91% ✗
- Cap rate
- 6.52%
- Cash-on-cash
- 0.81%
- DSCR
- 1.04
- GRM
- 9.1
CMA / ARV
- ARV (on-the-fly)
- $214,700
- Comps found
- 3
Show comp detail 3 sales within ~0.75 mi
| Address | Dist | Beds/Ba | Sqft | Sold | Price | $/sf | Match |
|---|---|---|---|---|---|---|---|
| 210 Wood Duck Dr | 0.08mi | 3/2.5 | 2,012 (+6%) | 5mo | $245,000 | $122 | 82 |
| 801 Wood Duck Dr | 0.20mi | 3/2.5 | 1,904 (+0%) | 18mo | $215,000 | $113 | 76 |
| 508 Wood Duck Dr | 0.16mi | 4/3.5 (+1) | 2,154 (+13%) | 6mo | $241,000 | $112 | 56 |
Match score weights: distance 35% · size 25% · config 20% · recency 20%. Top-matched comps best support the ARV.
Projected returns pro-forma
-3.0% appreciation · 3.0% rent growth · sell at horizon
- IRR
- -15.0%
- Equity multiple
- 0.47×
- Total profit
- $-32,932
- Equity at exit
- $32,795
- IRR
- -6.3%
- Equity multiple
- 0.59×
- Total profit
- $-25,062
- Equity at exit
- $19,017
Cash invested: $61,586 (down + closing). Projections, not guarantees.
Landlord ↔ Tenant lean methodology
- Overall (STATE)
- 27 Tenant-Leaning
- State Maryland
- 27 Tenant-Leaning · D+14
- County
- — inherits STATE
- City
- — inherits STATE
ZIP-level market 21613
- Home prices YoY
- -25.1%
- Active inventory
- 292
- Price-to-rent
- 9.1×
Monthly cashflow live
- Estimated rent
- $2,009 medium interval (Pro) →
- Mortgage (P&I)
- −$1,153
- Tax from tax record
- −$260 /mo · $3,118/yr
- Insurance
- −$92
- HOA
- −$40
- Vacancy / Maint / Mgmt
- −$422
- Net cashflow
- $42
Break-even live
UW: 25.0% down · 7.5% · 30yr · 1.5% tax · 5.0% vac · 8.0% maint · 8.0% mgmt
Financing live
Cash to close
- Down payment
- $54,988
- Closing costs
- $6,598
- Reserves months
- —
- Total cash needed
- —
Loan-product check · same deal, 3 products live
Conventional
25% down · 7.5% · 30yr
- Down + closing
- —
- Monthly P&I
- —
- Monthly cashflow
- —
- DSCR
- —
- Eligible?
- —
Personal DTI + credit; lowest rate.
DSCR
20% down · 8.5% · 30yr
- Down + closing
- —
- Monthly P&I
- —
- Monthly cashflow
- —
- DSCR
- —
- Eligible?
- —
No personal income docs; deal must DSCR.
Hard money
10% down · 12.0% · 12mo
- Down + closing
- —
- Monthly P&I
- —
- Monthly cashflow
- —
- DSCR
- —
- Eligible?
- —
Short-term bridge; refi at stabilization.
Rent comps 4 comps
| Address | Beds | Baths | Sqft | Rent | $/sqft | DOM | Units | Dist |
|---|---|---|---|---|---|---|---|---|
| 804 Allen St Cambridge, MD | 4.0 | 2.0 | 1326 | $1,800 | $1.36 | 44d | 1 | 0.99mi |
| 178 Regulator Dr N Cambridge, MD | 4.0 | 2.5 | 2220 | $2,500 | $1.13 | 44d | 1 | 1.05mi |
| 1507 Race St Cambridge, MD | 3.0 | 1.0 | 1260 | $1,695 | $1.35 | 44d | 1 | 1.37mi |
| 406 Robbins St Cambridge, MD | 3.0 | 2.0 | 1296 | $1,800 | $1.39 | 44d | 1 | 1.40mi |
HOA detail
- Monthly dues
- $40 · $480/yr
Listing history 22 events
-
2026-06-18days on market $219,950 Active 30 DOM
-
2026-06-17days on market $219,950 Active 29 DOM
-
2026-06-16days on market $219,950 Active 28 DOM
-
2026-06-15days on market $219,950 Active 27 DOM
-
2026-06-13days on market $219,950 Active 25 DOM
-
2026-06-12days on market $219,950 Active 24 DOM
-
2026-06-09days on market $219,950 Active 21 DOM
-
2026-06-08days on market $219,950 Active 20 DOM
-
2026-06-07days on market $219,950 Active 19 DOM
-
2026-06-07days on market $219,950 Active 18 DOM
-
2026-06-04days on market $219,950 Active 15 DOM
-
2026-06-02days on market $219,950 Active 14 DOM
-
2026-06-01days on market $219,950 Active 13 DOM
-
2026-05-31days on market $219,950 Active 12 DOM
-
2026-05-31days on market $219,950 Active 11 DOM
-
2026-05-19$219,950 Active
-
2025-02-18status Pending
-
2025-02-18historical
-
2025-02-05historical Active Under Contract
-
2025-02-01$215,900 Active
-
2025-01-29historical
-
2004-02-12soldstatus $47,000
ⓘ Source: listings_history table (triggers on properties + properties_extension) + one-shot
backfill from property_details.listing_events for pre-trigger history.
Tax reassessment forecast MD · Partial reset (capped growth)
- Current annual tax
- $3,118 · $260/mo
- Projected year-2 tax
- $3,118 · $260/mo
- Expected delta
- $0/yr ($0/mo · 0.0%)
ⓘ Screening estimate from a state-policy table — verify with the county assessor before closing.
Climate risk First Street
- Flood 1/10 Low FEMA zone X (unshaded) · 0% chance over 30 yrs
- Wildfire 3/10 Moderate
- Heat 9/10 Extreme 7 d/yr ≥105°F today · 16 d/yr by 30 yrs out
- Wind 6/10 Major 75% chance of damaging wind over 30 yrs
- Air quality 3/10 Moderate 2 unhealthy d/yr today · 3 by 30 yrs out
Nearby sold comps map
Loading sold comps map…
Walkable amenities ~0.75 mi
Loading nearby amenities…
Taxation est. · year 1
- Rental income
- $24,102
- − Mortgage interest
- −$12,321
- − Property taxes
- −$3,118
- − Insurance
- −$1,100
- − Repairs & maintenance
- −$1,928
- − Management
- −$1,928
- − HOA
- −$480
- − Depreciation
- −$6,399
- Taxable loss
- −$3,171
- Est. tax savings @ 24.0%
- +$761
- After-tax cash flow
- $1,263/yr
For passive investors: Depreciation is non-cash, so a rental often shows a tax loss while cash-flowing — sheltering income. Rental losses are passive: they offset passive income freely, and up to $25,000/yr can offset ordinary (W-2) income if you actively participate and your MAGI is under $100k (phasing out to $0 by $150k); unused losses carry forward. On sale, claimed depreciation is recaptured at up to 25%, and gains may owe capital-gains tax (a 1031 exchange can defer both). Figures are a year-1 estimate at your 24.0% rate — not tax advice; consult a CPA.
Schools (NCES district)
- District
- Dorchester County Public Schools
- NCES district ID
- 2400300
- Math proficiency
- 10% ▼ -14.00%
- Reading proficiency
- 23% ▼ -12.00%
- Median HH income
- $46,767
- Composite
- 14.65/100
- National rank
- #9404
- State rank
- #23 of 24 in MD
Livability — Cambridge
- Score
- 65/100
- State rank
- #255
- US rank
- #13046
Category grades
Schools grade is shown separately in the Schools card above.
Census & demographics
- Census place
- Cambridge, MD
- Population (ZIP)
- 18,167
Population outlook (Dorchester County) Hauer SSP2
- Today (2025)
- 31,699 people
- By 2030
- 31,054 · -2.0%
- By 2040
- 29,712 · -6.3%
- By 2050
- 28,618 · -9.7%
- By 2075
- 28,436 · -10.3%
- By 2100
- 28,937 · -8.7%
Race, ethnicity, and origin ACS 2023
- Neighborhood character
- Diverse neighborhood (Simpson 0.62)
- Race & ethnicity
- White 52% Black 33% Two or more races 10% Hispanic / Latino 6% Asian 2%
- Hispanic origin (detail)
- Puerto Rican 3%
- Common ancestry
- Romanian 1% Lithuanian 1% Italian 1%
- Foreign-born
- 4% · Canada
- Languages at home
- 95% English-only · Spanish 3% Other Indo-European 1% German/W. Germanic 1%
Political lean MEDSL · Dorchester
- 2024 margin
- R (+14.6) · D 41.6% · R 56.1% · Other 2.3%
- 2008→2024 swing
- -6.3pp toward R · 2008: -8.2pp · 2024: -14.6pp
- All cycles
- 2024: R+14.6 2020: R+11.9 2016: R+16.0 2012: R+6.6 2008: R+8.2
Not yet ingested
- Civics
- —
Market trends
- HPI YoY
- ▼ -91.03%
- Current HPI
- 271.1127
- Rent YoY
- —
- Metro
- —
- State GDP YoY
- ▲ 2.97%
- F500 in state
- 12
Industry mix (Fortune 500 HQ in MD)
| Industry | F500 HQs | Revenue |
|---|---|---|
| Aerospace / Defense | 1 | $71B |
|
||
| Utilities | 1 | $25B |
|
||
| Hotels | 1 | $24B |
|
||
| Consumer Goods | 1 | $7B |
|
||
| Real Estate | 1 | $6B |
|
||
| Chemicals | 1 | $2B |
|
||
Price history
+368.0% since first listed7 events — show timeline
- 2026-05-19 Listed $219,950 BRIGHT MLS
- 2025-02-18 Pending — BRIGHT MLS
- 2025-02-18 Listing Removed — BRIGHT MLS
- 2025-02-05 Contingent — BRIGHT MLS
- 2025-02-01 Listed $215,900 BRIGHT MLS
- 2025-01-29 Coming Soon — BRIGHT MLS
- 2004-02-12 Sold (Public Records) $47,000 Public Records
Property tax history
+3.8%/yrLatest (2025): $3,118 · +23.2% YoY. Source: county tax records.
Cash-flow waterfall
monthlySold comps — $/sqft
last 12 mo · ≤1 miLoading sold comps…