 Multi-family
2237 Colby Ln · Wylie, TX
Flood risk 1/10 · Minimal
- FEMA flood zone
- X (unshaded)
- Chance of flooding over 30 yrs
- 0.0%
- Est. flood insurance / yr
- $507 – $1,088
Fire risk 3/10 · Minor
- Est. fire insurance / yr
- $1,222 – $2,270
Heat risk 7/10 · Major
- Hot days now (above 110°F)
- 7 days/yr
- Hot days in 30 yrs
- 23 days/yr
Wind risk 6/10 · Moderate
- Chance of severe wind over 30 yrs
- 27.0%
Air-quality risk 3/10 · Minor
- Unhealthy air days now
- 2 days/yr
- Unhealthy air days in 30 yrs
- 3 days/yr
Risk factors via First Street. Map © Google.
Why this score? — see what drove the D- grade
The composite is a weighted blend of 9 inputs, each scored 0–100. Each bar is that input's sub-score; the figure is the points it added to the 100-point composite (weight × sub-score).
- Cash flow +9.9/30.0
- ARV discount +7.5/15.0
- Schools +5.7/10.0
- 1% rule +3.6/10.0
- Livability +3.5/5.0
- DSCR +2.8/10.0
- Condition / age +2.5/5.0
- Rent growth +2.2/5.0
- Appreciation +0.0/10.0
$255,000
🖨 Deal sheet (PDF) 📄 Offer letter ✓ Due diligence
Multi-family units
County records classify this as Multi-Family (2-4 Unit). Listing-text estimate: 1 unit. estimate disagrees with records
Listing remarks
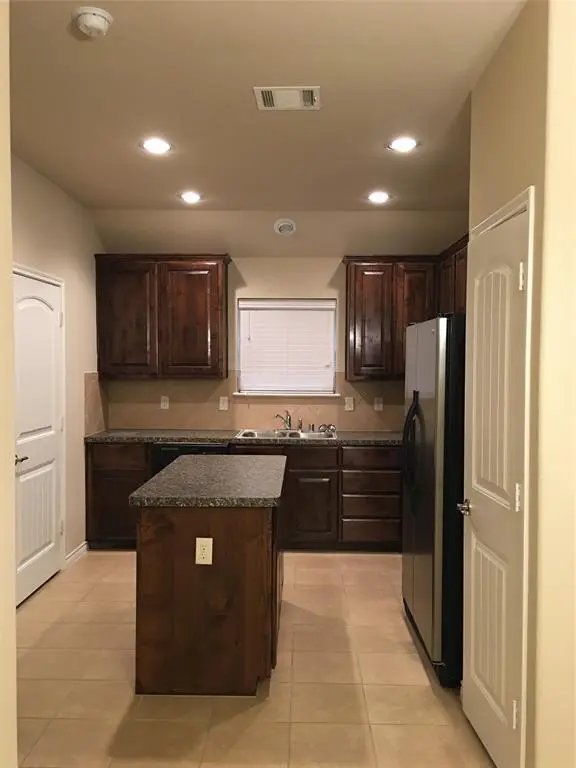
Empty and Move-In Ready! Beautiful duplex built in 2013 and located in the highly desirable Wylie Lakes Villas community—just a short walk to Lake Lavon. Enjoy a peaceful, low-maintenance lifestyle surrounded by nature, with community hike & bike trails, scenic pond views, and mature trees throughout the neighborhood. This well-maintained home features: Gorgeous 42-inch custom cabinets Spacious layout with modern finishes Extended covered front porch, perfect for relaxing Low-maintenance exterior and community living Quiet and charming neighborhood atmosphere Vacant and move-in ready Can accommodate a quick closing Whether you're a homeowner looking for comfort and c
Key facts
- Pond
- Hike & bike trails
- 3,049 sq ft lot
Tags
Property features AI
Finance
- Financial info: Treat As Clear loan type; No second mortgage indicated
- HOA & community: Mandatory HOA (managed by essex); HOA fees $175 semi-annually; HOA covers grounds maintenance and management fees
Exterior
- Parking: Attached garage (1-car) with approximately 10' width x 20' length; 1 covered parking space
- Utilities: City water; City sewer; Not in a municipal utility district
- Home design: Single family residence (attached); One story
- Construction: Built in 2013
- Exterior features: Lot less than 0.5 acre (approx. 0.07 acres); Subdivision: Wylie Lakes Ph 1b; Directions: From Plano Parkway; go 78 North; turn left on Eubank; turn right on Forest Ross; turn Right on Spencer; Turn Right on Colby Lane
Interior
- Kitchen: Dishwasher; Disposal; Electric cooktop
- Bedrooms: Primary bedroom on level 1, approximately 14 x 13
- Bathrooms: 2 full bathrooms
- Interior features: Built-in features; One living area; One dining area; Two total rooms (listed)
Neighborhood map
What this means for you Summary
Snapshot
- This is a 3-bed/2.0-bath multifamily listed at $255k.
Deal economics
- At list price, monthly cash flow is $-158 ($-2k/yr) — negative.
- To cash-flow at today's rent, offer at most $227k (11.0% below list).
- To meet the 1% rule (rent ≥ 1% of price), the offer needs to be $219k (14.1% below list).
- Recommended offer: $219k (14.1% below list) — sets the bar for 1% rule.
- Cap rate 5.5% vs local median 4.0% in Wylie — top-decile yield for the area; either an underpriced asset or a hidden risk that comps aren't pricing in. Stress-test before assuming the spread holds.
Location & tenants
- Location reads 69/100 on livability (#419 in TX) — a middle-class / working-renter tenant base. Strengths: crime A+, employment A+, housing A+; Watch: amenities F, commute F, health & safety F.
- Wylie ISD (suburban): math 64% / reading 63% proficiency, ranked #28 of 826 in TX (top 3%) — acceptable for families but not a draw, mixed tenant base, ~2y average lease.
- Zoned schools: P M Akin El (math 52% / reading 62%, grade C+, #505 of 4,322 statewide, top 13%, 586 students, 30% FRL) — zoned schools at 30% FRL track the district average.
- Market conditions: Rents soft (-1.4%/yr); 704 active listings in the ZIP; high-income renter base; 19,194 units permitted in Collin County in 2024 (3,988 in 5+ unit buildings).
Forward outlook
- Local home prices are declining (-3.0%/yr); year-one equity from $2k of loan paydown is wiped out by about $8k of value loss. Plan a longer hold.
- Collin County population projected at +60% by 2050 — long-run rental-demand tailwind backs the buy-and-hold thesis.
Negotiation context
- It's been on market 18 days — a 2% lower offer ($251k) is reasonable based on typical stale-listing flexibility.
Risks & watch-outs
- Climate carrying-cost: major wind risk, 27% chance of damaging wind over 30y; extreme-heat days projected 7→23/yr by 2055 (HVAC capex compounding) — expect insurance premiums to compound above CPI over the hold.
Questions for the listing agent
- What do current leases actually rent for vs. the listed asking? Can we see a recent rent roll and the last 12 months of T-12 income?
- What does the HOA fee cover, when was the last increase, and are there any pending special assessments or reserve-fund shortfalls?
- Is there a deadline driving the sale (1031 exchange, divorce, estate, relocation)? That informs how much negotiation room exists.
- Schools are B-rated — typically a magnet for longer-tenancy family renters. What's the average tenant stay here, and is there a school-zone premium baked into asking?
- The area grade is low — what's the realistic commute time and amenity access for the typical tenant pool here? Any planned neighborhood developments (good or bad) we should know about?
- What's the average days-on-market for RENTAL listings here right now (not sales)? A rising rental-DOM trend means longer vacancies and softer asking-rent achievability than the comps imply.
- What's the recent tenant-quality profile in this submarket — average credit score on applications, eviction rate, late-payment / NSF rate, and stable-employment percentage? A property-management company in the area should have these aggregated.
- How much new apartment / multifamily construction is in the pipeline within 1–3 miles? Heavy new supply (>2% of stock underway) typically softens rents 12–24 months out; light construction supports rent growth.
Investment metrics
- 1% rule
- 0.86% ✗
- Cap rate
- 5.55%
- Cash-on-cash
- -2.66%
- DSCR
- 0.88
- GRM
- 9.7
CMA / ARV
No comps found within radius.
Projected returns pro-forma
-3.0% appreciation · 0.0% rent growth · sell at horizon
- IRR
- -24.4%
- Equity multiple
- 0.19×
- Total profit
- $-57,708
- Equity at exit
- $38,021
- IRR
- -33.0%
- Equity multiple
- -0.23×
- Total profit
- $-87,587
- Equity at exit
- $22,048
Cash invested: $71,400 (down + closing). Projections, not guarantees.
Landlord ↔ Tenant lean methodology
- Overall (STATE)
- 87 Strongly Landlord-Friendly
- State Texas
- 87 Strongly Landlord-Friendly · R+5
- County
- — inherits STATE
- City
- — inherits STATE
ZIP-level market 75098
- Home prices YoY
- -24.5%
- Rents YoY
- -1.4%
- Active inventory
- 704
- Price-to-rent
- 9.7×
Monthly cashflow live
- Estimated rent
- $2,190 medium interval (Pro) →
- Mortgage (P&I)
- −$1,337
- Tax from tax record
- −$416 /mo · $4,993/yr
- Insurance
- −$106
- HOA
- −$29
- Vacancy / Maint / Mgmt
- −$460
- Net cashflow
- $-158
Break-even live
Sensitivity live
| Price | -10% $-14 | -5% $-86 | +0% $-158 | +5% $-230 | +10% $-303 |
|---|---|---|---|---|---|
| Rent | -10% $-331 | -5% $-245 | +0% $-158 | +5% $-72 | +10% $15 |
| Rate | -1.0pp $-30 | -0.5pp $-93 | base $-158 | +0.5pp $-224 | +1.0pp $-292 |
UW: 25.0% down · 7.5% · 30yr · 1.5% tax · 5.0% vac · 8.0% maint · 8.0% mgmt
Financing live
Cash to close
- Down payment
- $63,750
- Closing costs
- $7,650
- Reserves months
- —
- Total cash needed
- —
Loan-product check · same deal, 3 products live
Conventional
25% down · 7.5% · 30yr
- Down + closing
- —
- Monthly P&I
- —
- Monthly cashflow
- —
- DSCR
- —
- Eligible?
- —
Personal DTI + credit; lowest rate.
DSCR
20% down · 8.5% · 30yr
- Down + closing
- —
- Monthly P&I
- —
- Monthly cashflow
- —
- DSCR
- —
- Eligible?
- —
No personal income docs; deal must DSCR.
Hard money
10% down · 12.0% · 12mo
- Down + closing
- —
- Monthly P&I
- —
- Monthly cashflow
- —
- DSCR
- —
- Eligible?
- —
Short-term bridge; refi at stabilization.
HOA detail
- Monthly dues
- $29 · $348/yr
Listing history 13 events
-
2026-06-21days on market $255,000 Active 18 DOM
-
2026-06-18days on market $255,000 Active 15 DOM
-
2026-06-17days on market $255,000 Active 14 DOM
-
2026-06-16remarks 689-char remark
-
2026-06-16pricedays on market $255,000 Active 13 DOM
-
2026-06-15days on market $260,000 Active 12 DOM
-
2026-06-13days on market $260,000 Active 10 DOM
-
2026-06-13days on market $260,000 Active 9 DOM
-
2026-06-09days on market $260,000 Active 6 DOM
-
2026-06-08days on market $260,000 Active 5 DOM
-
2026-06-07days on market $260,000 Active 4 DOM
-
2026-06-04remarks 655-char remark
-
2026-06-04$260,000 Active 1 DOM
ⓘ Source: listings_history table (triggers on properties + properties_extension) + one-shot
backfill from property_details.listing_events for pre-trigger history.
Tax reassessment forecast TX · Resets to sale price
- Current annual tax
- $4,993 · $416/mo
- Projected year-2 tax
- $4,993 · $416/mo
- Expected delta
- $0/yr ($0/mo · 0.0%)
ⓘ Screening estimate from a state-policy table — verify with the county assessor before closing.
Climate risk First Street
- Flood 1/10 Low FEMA zone X (unshaded) · 0% chance over 30 yrs
- Wildfire 3/10 Moderate
- Heat 7/10 Severe 7 d/yr ≥110°F today · 23 d/yr by 30 yrs out
- Wind 6/10 Major 27% chance of damaging wind over 30 yrs
- Air quality 3/10 Moderate 2 unhealthy d/yr today · 3 by 30 yrs out
Nearby sold comps map
Loading sold comps map…
Walkable amenities ~0.75 mi
Loading nearby amenities…
Taxation est. · year 1
- Rental income
- $26,284
- − Mortgage interest
- −$14,284
- − Property taxes
- −$4,993
- − Insurance
- −$1,275
- − Repairs & maintenance
- −$2,103
- − Management
- −$2,103
- − HOA
- −$348
- − Depreciation
- −$7,418
- Taxable loss
- −$6,240
- Est. tax savings @ 24.0%
- +$1,498
- After-tax cash flow
- $-401/yr
For passive investors: Depreciation is non-cash, so a rental often shows a tax loss while cash-flowing — sheltering income. Rental losses are passive: they offset passive income freely, and up to $25,000/yr can offset ordinary (W-2) income if you actively participate and your MAGI is under $100k (phasing out to $0 by $150k); unused losses carry forward. On sale, claimed depreciation is recaptured at up to 25%, and gains may owe capital-gains tax (a 1031 exchange can defer both). Figures are a year-1 estimate at your 24.0% rate — not tax advice; consult a CPA.
Schools (NCES district)
- District
- Wylie ISD
- NCES district ID
- 4846530
- Math proficiency
- 64% ▼ -9.00%
- Reading proficiency
- 63% ▼ -3.00%
- Median HH income
- $84,145
- Composite
- 57.25/100
- National rank
- #1091
- State rank
- #28 of 826 in TX
Livability — Wylie
- Score
- 69/100
- State rank
- #419
- US rank
- #8623
Category grades
Schools grade is shown separately in the Schools card above.
Census & demographics
- Census place
- Wylie, TX
- County
- Collin County · 1,159,394 people
- City population
- 69,325
- Metro
- Dallas-Fort Worth-Arlington, TX
- Population (ZIP)
- 69,325
- Household income
- $122,089
- Rent vs Own
- Severe rent burden
- 996.0
Population outlook (Collin County) Hauer SSP2
- Today (2025)
- 1,210,074 people
- By 2030
- 1,358,201 · +12.2%
- By 2040
- 1,654,061 · +36.7%
- By 2050
- 1,937,359 · +60.1%
- By 2075
- 2,567,039 · +112.1%
- By 2100
- 2,952,048 · +144.0%
Race, ethnicity, and origin ACS 2023
- Neighborhood character
- Diverse neighborhood (Simpson 0.67)
- Race & ethnicity
- White 51% Hispanic / Latino 19% Two or more races 15% Black 13% Asian 11%
- Hispanic origin (detail)
- Mexican 12%
- Common ancestry
- Slovak 2% Lithuanian 2% Serbian 2%
- Foreign-born
- 21% · Canada, Vietnam, China
- Languages at home
- 70% English-only · Spanish 14% Other Indo-European 4% Vietnamese 2%
Political lean MEDSL · Collin
- 2024 margin
- R (+11.1) · D 43.1% · R 54.3% · Other 2.6%
- 2008→2024 swing
- +14.4pp toward D · 2008: -25.6pp · 2024: -11.1pp
- All cycles
- 2024: R+11.1 2020: R+4.3 2016: R+17.0 2012: R+31.6 2008: R+25.6
Not yet ingested
- Civics
- —
Market trends
- HPI YoY
- ▼ -84.91%
- Current HPI
- 261.9973
- Rent YoY
- ▼ -1.39%
- Metro
- Dallas-Fort Worth-Arlington, TX
- State GDP YoY
- ▲ 3.95%
- F500 in state
- 110
Industry mix (Fortune 500 HQ in TX)
| Industry | F500 HQs | Revenue |
|---|---|---|
| Energy | 16 | $1,198B |
|
||
| Technology | 5 | $198B |
|
||
| Engineering / Construction | 4 | $72B |
|
||
| Energy Services | 3 | $60B |
|
||
| Utilities | 3 | $41B |
|
||
| Healthcare | 2 | $330B |
|
||
Price history
1 event — show timeline
- 2026-06-03 Listed $260,000 NTREIS
Property tax history
+16.9%/yrLatest (2025): $4,993 · -4.6% YoY. Source: county tax records.
Cash-flow waterfall
monthlySold comps — $/sqft
last 12 mo · ≤1 miLoading sold comps…