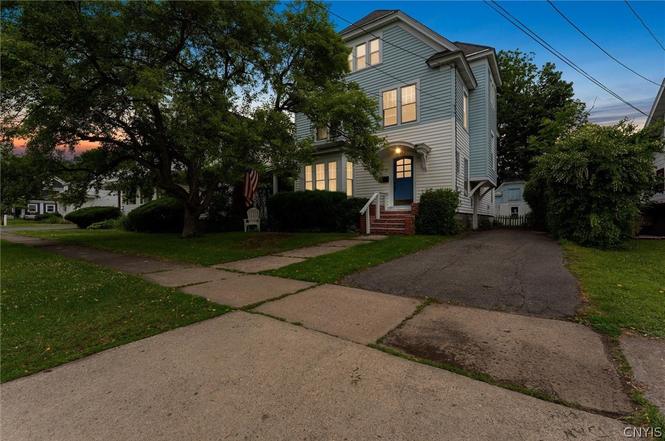
457 S 4th St · Fulton, NY
Flood risk 1/10 · Minimal
- FEMA flood zone
- X (unshaded)
- Chance of flooding over 30 yrs
- 0.0%
- Est. flood insurance / yr
- $473 – $860
Fire risk 3/10 · Minor
- Est. fire insurance / yr
- $691 – $1,283
Heat risk 2/10 · Minimal
- Hot days now (above 95°F)
- 7 days/yr
- Hot days in 30 yrs
- 16 days/yr
Wind risk 1/10 · Minimal
- Chance of severe wind over 30 yrs
- 1.0%
Air-quality risk 2/10 · Minimal
- Unhealthy air days now
- 1 days/yr
- Unhealthy air days in 30 yrs
- 1 days/yr
Risk factors via First Street. Map © Google.
Why this score? — see what drove the C grade
The composite is a weighted blend of 9 inputs, each scored 0–100. Each bar is that input's sub-score; the figure is the points it added to the 100-point composite (weight × sub-score).
- ARV discount +15.0/15.0
- Cash flow +13.5/30.0
- Appreciation +8.4/10.0
- 1% rule +5.6/10.0
- DSCR +4.1/10.0
- Livability +3.1/5.0
- Schools +3.0/10.0
- Rent growth +2.5/5.0
- Condition / age +2.5/5.0
$174,900
🖨 Deal sheet 📄 Offer letter ✓ Due diligence
Listing remarks
Welcome to 457 S 4th Street in Fulton, NY, a spacious and character-filled Colonial offering over 2,100 square feet of living space in the heart of Oswego County. This 5-bedroom, 1.5-bath home showcases beautiful natural woodwork throughout and blends timeless charm with important updates, including new windows installed in 2021 and a newer furnace. Conveniently located near local amenities and an easy drive to Oswego, NY, this property offers the space and flexibility today's buyers are looking for. The functional 2-story layout features generous living and entertaining areas, potential office space, a bright sunroom, and a well-appointed kitchen with ample room for gathering. The full bas
Key facts
- Natural woodwork
- Newer furnace
- Full basement
Tags
Property features AI
Exterior
- Parking: No garage
- Utilities: Electricity connected with circuit breaker panel; Public water connected; Sewer connected; High-speed internet available
- Home design: Two-story residence; Shingle roof; Vinyl siding; Copper plumbing; Block foundation; Existing (resale) property
- Construction: Built previously (existing); Vinyl siding; Copper plumbing; Shingle roof; Block foundation
- Exterior features: Blacktop driveway; Partial fencing; Fence; Covered porch; Porch; Barn(s); Outbuilding; Rectangular residential lot; City street frontage; Lot dimensions approximately 50 x 132
Interior
- Kitchen: Electric cooktop; Range hood; Dishwasher; Refrigerator; Exhaust fan
- Bedrooms: One bedroom on the main level
- Flooring: Carpet; Hardwood; Tile; Vinyl; Varies
- Bathrooms: One full bathroom; One half bathroom; Main level bathroom available
- Heating & cooling: Gas heating; Radiator heating
- Interior features: Separate/formal dining room; Entrance foyer; Separate/formal living room; Home office; Storage; Natural woodwork; Workshop; Has basement (full); Basement workshop/storage areas; Sunroom/Florida room
- Laundry & utility: Washer; Dryer; Laundry located in basement; Gas water heater
Neighborhood map
What this means for you Summary
Snapshot
- This is a 4-bed/1.0-bath single-family listed at $175k.
Deal economics
- At list price, monthly cash flow is $5 ($64/yr) — positive.
- The deal already cash-flows at list — no discount required.
- Meets the 1% rule at list price ($2k rent vs $175k).
Location & tenants
- Location reads 61/100 on livability (#907 in NY) — a middle-class / working-renter tenant base. Strengths: cost of living A+, housing A+; Watch: employment D, schools D-, crime F.
- Fulton City School District (town): math 29% / reading 43% proficiency, ranked #554 of 590 in NY (top 94%) — families likely to look elsewhere, expect single-tenant / working-renter base with shorter leases.
- Market conditions: 115 active listings in the ZIP; 1 comparable units currently listed for rent nearby; 172 units permitted in Oswego County in 2024 (27 in 5+ unit buildings).
Forward outlook
- In year one you build about $13k of equity ($1k loan paydown + $12k appreciation (6.8% local appreciation)).
- Oswego County population projected at -23% by 2050 — secular population decline; favor cash flow + early exit over multi-decade hold.
- At projected returns (6.8% appreciation + 3.0% rent growth), your $49k cash investment doubles in ~4 years — after that, you're playing with house money.
- By year 3, paydown + projected appreciation supports a ~$32k cash-out refi (75% LTV) — recoverable capital for the next deal without selling this one.
Negotiation context
- Only 1 days on market — expect competitive offers; lowballing is unlikely to land.
- Current owner paid $70k; list at $175k implies a 150% gain — meaningful room to come down on a strong offer.
Risks & watch-outs
- Watch-outs: property tax is 3.2% of price; built in 1930 — expect roof / HVAC / electrical / plumbing capex.
Questions for the listing agent
- Built in 1930 — when were the roof, HVAC, electrical panel, plumbing, and water heater last replaced?
- Property tax is high relative to price — has the assessment been appealed recently, and will the sale trigger a re-assessment?
- Is there a deadline driving the sale (1031 exchange, divorce, estate, relocation)? That informs how much negotiation room exists.
- Schools are D-rated, which usually means shorter tenancies and higher turnover. Who's the typical renter profile here, and what's been the actual vacancy rate?
- Crime grade is F in this area — have there been break-ins, vandalism, or insurance claims at this property in the last 3 years? What carrier currently insures it and at what premium?
- What's the average days-on-market for RENTAL listings here right now (not sales)? A rising rental-DOM trend means longer vacancies and softer asking-rent achievability than the comps imply.
- What's the recent tenant-quality profile in this submarket — average credit score on applications, eviction rate, late-payment / NSF rate, and stable-employment percentage? A property-management company in the area should have these aggregated.
- How much new for-sale + rental construction is in the pipeline within 1–3 miles? Heavy new supply typically softens prices + rents 12–24 months out; constrained supply supports both.
Investment metrics
- 1% rule
- 1.06% ✓
- Cap rate
- 6.33%
- Cash-on-cash
- 0.13%
- DSCR
- 1.01
- GRM
- 7.9
CMA / ARV
- ARV (on-the-fly)
- $220,317
- Comps found
- 12
Show comp detail 12 sales within ~0.75 mi
| Address | Dist | Beds/Ba | Sqft | Sold | Price | $/sf | Match |
|---|---|---|---|---|---|---|---|
| 406 Park St | 0.14mi | 5/2.0 (+1) | 2,028 (-5%) | 10mo | $159,900 | $79 | 67 |
| 306 Academy St | 0.45mi | 4/1.5 | 2,128 (-0%) | 14mo | $220,000 | $103 | 64 |
| 368 S 7th St | 0.23mi | 4/1.5 | 1,842 (-14%) | 3mo | $162,000 | $88 | 61 |
| 205 S 4th St | 0.43mi | 4/1.5 | 2,004 (-6%) | 8mo | $215,000 | $107 | 61 |
| 264 S 5th St | 0.33mi | 3/3.0 (-1) | 2,034 (-5%) | 9mo | $193,500 | $95 | 56 |
| 614 E Broadway St | 0.32mi | 4/2.5 | 1,920 (-10%) | 11mo | $185,000 | $96 | 53 |
| 313 W 3rd St S | 0.69mi | 4/2.5 | 2,040 (-5%) | 6mo | $126,175 | $62 | 49 |
| 56 Wildwood Ave | 0.56mi | 3/2.5 (-1) | 2,032 (-5%) | 9mo | $415,000 | $204 | 47 |
| 694 Forest Ave | 0.59mi | 5/2.5 (+1) | 2,220 (+4%) | 11mo | $300,000 | $135 | 46 |
| 413 Cayuga St | 0.70mi | 4/1.0 | 2,288 (+7%) | 15mo | $75,000 | $33 | 44 |
| 720 W 1st St S | 0.72mi | 4/2.0 | 1,897 (-11%) | 4mo | $200,000 | $105 | 40 |
| 20 Wildwood Ave | 0.73mi | 3/2.5 (-1) | 1,860 (-13%) | 6mo | $387,500 | $208 | 28 |
Match score weights: distance 35% · size 25% · config 20% · recency 20%. Top-matched comps best support the ARV.
Projected returns pro-forma
6.75% appreciation · 3.0% rent growth · sell at horizon
- IRR
- 17.3%
- Equity multiple
- 2.20×
- Total profit
- $58,876
- Equity at exit
- $118,308
- IRR
- 16.8%
- Equity multiple
- 4.50×
- Total profit
- $171,561
- Equity at exit
- $222,159
Cash invested: $48,972 (down + closing). Projections, not guarantees.
Landlord ↔ Tenant lean methodology
- Overall (STATE)
- 15 Strongly Tenant-Friendly
- State New York
- 15 Strongly Tenant-Friendly · D+10
- County
- — inherits STATE
- City
- — inherits STATE
ZIP-level market 13069
- Home prices YoY
- 2.3%
- Active inventory
- 115
- Price-to-rent
- 7.9×
Monthly cashflow live
- Estimated rent
- $1,850 medium interval (Pro) →
- Mortgage (P&I)
- −$917
- Tax from tax record
- −$466 /mo · $5,593/yr
- Insurance
- −$73
- HOA
- −$0
- Vacancy / Maint / Mgmt
- −$388
- Net cashflow
- $5
Break-even live
UW: 25.0% down · 7.5% · 30yr · 1.5% tax · 5.0% vac · 8.0% maint · 8.0% mgmt
Financing live
Cash to close
- Down payment
- $43,725
- Closing costs
- $5,247
- Reserves months
- —
- Total cash needed
- —
Loan-product check · same deal, 3 products live
Conventional
25% down · 7.5% · 30yr
- Down + closing
- —
- Monthly P&I
- —
- Monthly cashflow
- —
- DSCR
- —
- Eligible?
- —
Personal DTI + credit; lowest rate.
DSCR
20% down · 8.5% · 30yr
- Down + closing
- —
- Monthly P&I
- —
- Monthly cashflow
- —
- DSCR
- —
- Eligible?
- —
No personal income docs; deal must DSCR.
Hard money
10% down · 12.0% · 12mo
- Down + closing
- —
- Monthly P&I
- —
- Monthly cashflow
- —
- DSCR
- —
- Eligible?
- —
Short-term bridge; refi at stabilization.
Rent comps 1 comps
| Address | Beds | Baths | Sqft | Rent | $/sqft | DOM | Units | Dist |
|---|---|---|---|---|---|---|---|---|
| 303 S 5th St Fulton, NY | 4.0 | 1.5 | 1800 | $1,850 | $1.03 | 13d | 1 | 0.29mi |
Listing history 2 events
-
2026-06-18remarks 699-char remark
-
2026-06-18$174,900 Active 1 DOM
ⓘ Source: listings_history table (triggers on properties + properties_extension) + one-shot
backfill from property_details.listing_events for pre-trigger history.
Tax reassessment forecast NY · Partial reset (capped growth)
- Current annual tax
- $5,593 · $466/mo
- Projected year-2 tax
- $5,593 · $466/mo
- Expected delta
- $0/yr ($0/mo · 0.0%)
ⓘ Screening estimate from a state-policy table — verify with the county assessor before closing.
Climate risk First Street
- Flood 1/10 Low FEMA zone X (unshaded) · 0% chance over 30 yrs
- Wildfire 3/10 Moderate
- Heat 2/10 Low 7 d/yr ≥95°F today · 16 d/yr by 30 yrs out
- Wind 1/10 Low 100% chance of damaging wind over 30 yrs
- Air quality 2/10 Low 1 unhealthy d/yr today · 1 by 30 yrs out
Nearby sold comps map
Loading sold comps map…
Walkable amenities ~0.75 mi
Loading nearby amenities…
Taxation est. · year 1
- Rental income
- $22,200
- − Mortgage interest
- −$9,797
- − Property taxes
- −$5,593
- − Insurance
- −$874
- − Repairs & maintenance
- −$1,776
- − Management
- −$1,776
- − Depreciation
- −$5,088
- Taxable loss
- −$2,704
- Est. tax savings @ 24.0%
- +$649
- After-tax cash flow
- $713/yr
For passive investors: Depreciation is non-cash, so a rental often shows a tax loss while cash-flowing — sheltering income. Rental losses are passive: they offset passive income freely, and up to $25,000/yr can offset ordinary (W-2) income if you actively participate and your MAGI is under $100k (phasing out to $0 by $150k); unused losses carry forward. On sale, claimed depreciation is recaptured at up to 25%, and gains may owe capital-gains tax (a 1031 exchange can defer both). Figures are a year-1 estimate at your 24.0% rate — not tax advice; consult a CPA.
Schools (NCES district)
- District
- Fulton City School District
- NCES district ID
- 3611700
- Math proficiency
- 29% ▼ -11.00%
- Reading proficiency
- 43% ▲ 5.00%
- Median HH income
- $43,337
- Composite
- 30.49/100
- National rank
- #6220
- State rank
- #554 of 590 in NY
Livability — Fulton
- Score
- 61/100
- State rank
- #907
- US rank
- #17723
Category grades
Schools grade is shown separately in the Schools card above.
Census & demographics
- Census place
- Fulton, NY
- Population (ZIP)
- 23,176
Population outlook (Oswego County) Hauer SSP2
- Today (2025)
- 114,465 people
- By 2030
- 109,968 · -3.9%
- By 2040
- 99,205 · -13.3%
- By 2050
- 87,979 · -23.1%
- By 2075
- 65,100 · -43.1%
- By 2100
- 47,117 · -58.8%
Race, ethnicity, and origin ACS 2023
- Neighborhood character
- Predominantly White (93%)
- Race & ethnicity
- White 93% Hispanic / Latino 4% Two or more races 3%
- Common ancestry
- Lithuanian 6% Romanian 6% Iranian 2%
- Foreign-born
- 2% · Canada
- Languages at home
- 96% English-only · Spanish 2% German/W. Germanic 1%
Political lean MEDSL · Oswego
- 2024 margin
- Strong R (+24.2) · D 37.9% · R 62.1%
- 2008→2024 swing
- -26.6pp toward R · 2008: 2.5pp · 2024: -24.2pp
- All cycles
- 2024: R+24.2 2020: R+20.2 2016: R+23.2 2012: D+7.9 2008: D+2.5
Not yet ingested
- Civics
- —
Market trends
- HPI YoY
- ▲ 6.75%
- Current HPI
- 304.443
- Rent YoY
- —
- Metro
- —
- State GDP YoY
- ▲ 2.60%
- F500 in state
- 92
Industry mix (Fortune 500 HQ in NY)
| Industry | F500 HQs | Revenue |
|---|---|---|
| Financial Services | 10 | $950B |
|
||
| Consumer Goods | 9 | $162B |
|
||
| Insurance | 4 | $225B |
|
||
| Telecommunications | 2 | $144B |
|
||
| Pharmaceuticals | 2 | $112B |
|
||
| Media / Entertainment | 2 | $69B |
|
||
Price history
+118.6% since first listed3 events — show timeline
- 2026-06-18 Listed $174,900 CNYIS
- 2009-10-05 Sold (Public Records) $69,900 Public Records
- 1994-07-19 Sold (Public Records) $80,000 Public Records
Property tax history
+3.5%/yrLatest (2025): $5,593 · +7.5% YoY. Source: county tax records.
Cash-flow waterfall
monthlySold comps — $/sqft
last 12 mo · ≤1 miLoading sold comps…